Báo cáo y học: "Development and application of versatile high density microarrays for genome-wide analysis of Streptomyces coelicolor: characterization of the HspR regulon" ppsx
Bạn đang xem bản rút gọn của tài liệu. Xem và tải ngay bản đầy đủ của tài liệu tại đây (920.25 KB, 14 trang )
Genome Biology 2009, 10:R5
Open Access
2009Buccaet al.Volume 10, Issue 1, Article R5
Research
Development and application of versatile high density microarrays
for genome-wide analysis of Streptomyces coelicolor:
characterization of the HspR regulon
Giselda Bucca
¤
*
, Emma Laing
¤
*
, Vassilis Mersinias
*‡
, Nicholas Allenby
*
,
Douglas Hurd
†
, Jolyon Holdstock
†
, Volker Brenner
†
, Marcus Harrison
†
and
Colin P Smith
*
Addresses:
*
Microbial Sciences Division, Faculty of Health and Medical Sciences, University of Surrey, Guildford, GU2 7XH, UK.
†
Oxford Gene
Technology Ltd, Begbroke Business Park, Sandy Lane, Yarnton, Oxford OX5 1PF, UK.
‡
Current address: Institute of Immunology, Biomedical
Sciences Research Centre "Alexander Fleming", Athens 16672, Greece.
¤ These authors contributed equally to this work.
Correspondence: Colin P Smith. Email:
© 2009 Bucca et al.; licensee BioMed Central Ltd.
This is an open access article distributed under the terms of the Creative Commons Attribution License ( which
permits unrestricted use, distribution, and reproduction in any medium, provided the original work is properly cited.
Streptomyces coelicolor microarrays<p>Development of high-density microarrays for global analysis of gene expression and transcription factor binding in Streptomyces coe-licolor suggests a novel role for HspR in stress adaptation.</p>
Abstract
Background: DNA microarrays are a key resource for global analysis of genome content, gene expression and
the distribution of transcription factor binding sites. We describe the development and application of versatile
high density ink-jet in situ-synthesized DNA arrays for the G+C rich bacterium Streptomyces coelicolor. High G+C
content DNA probes often perform poorly on arrays, yielding either weak hybridization or non-specific signals.
Thus, more than one million 60-mer oligonucleotide probes were experimentally tested for sensitivity and
specificity to enable selection of optimal probe sets for the genome microarrays. The heat-shock HspR regulatory
system of S. coelicolor, a well-characterized repressor with a small number of known targets, was exploited to test
and validate the arrays for use in global chromatin immunoprecipitation-on-chip (ChIP-chip) and gene expression
analysis.
Results: In addition to confirming dnaK, clpB and lon as in vivo targets of HspR, it was revealed, using a novel ChIP-
chip data clustering method, that HspR also apparently interacts with ribosomal RNA (rrnD operon) and specific
transfer RNA genes (the tRNA
Gln
/tRNA
Glu
cluster). It is suggested that enhanced synthesis of Glu-tRNA
Glu
may
reflect increased demand for tetrapyrrole biosynthesis following heat-shock. Moreover, it was found that heat-
shock-induced genes are significantly enriched for Gln/Glu codons relative to the whole genome, a finding that
would be consistent with HspR-mediated control of the tRNA species.
Conclusions: This study suggests that HspR fulfils a broader, unprecedented role in adaptation to stresses than
previously recognized - influencing expression of key components of the translational apparatus in addition to
molecular chaperone and protease-encoding genes. It is envisaged that these experimentally optimized arrays will
provide a key resource for systems level studies of Streptomyces biology.
Published: 16 January 2009
Genome Biology 2009, 10:R5 (doi:10.1186/gb-2009-10-1-r5)
Received: 2 August 2008
Revised: 8 December 2008
Accepted: 16 January 2009
The electronic version of this article is the complete one and can be
found online at /> Genome Biology 2009, Volume 10, Issue 1, Article R5 Bucca et al. R5.2
Genome Biology 2009, 10:R5
Background
Streptomycetes represent an unusual and complex bacterial
genus. They display a mycelial 'multicellular' life cycle that
culminates in sporulation [1] and possess remarkable meta-
bolic diversity, both in their ability to catabolise complex sub-
strates and in their prodigious capacity to produce chemically
diverse 'secondary' metabolites, including the majority of nat-
urally occurring antibiotics and other bioactive compounds
used in medicine [2,3]. These characteristics form the major
justification for basic studies of streptomycete biology. Since
the completion of the genome sequence of the principal
model streptomycete, Streptomyces coelicolor A3(2) [4],
numerous systems-level studies have been initiated, encom-
passing transcriptomic/proteomic approaches and genome
scale metabolic network construction [5-8].
To date, Streptomyces DNA microarray-based studies have
been restricted largely to the use of spotted PCR products or
pre-synthesized long oligonucleotides, with a single probe
representing each gene [9]. Such arrays are not generally suit-
able for genome wide chromatin immunoprecipitation-on-
chip (ChIP-on-chip) analysis of transcription factor binding
sites [10]. The ChIP-on-chip technique has become an essen-
tial tool for system wide analysis of biological systems (for
example, [11-15]) since it provides a comprehensive assess-
ment of the direct targets, in vivo, of the transcription factor/
DNA-binding protein under investigation; this is a pre-requi-
site for reconstructing cellular transcription regulatory net-
works. Here we report the development of ink-jet in situ
synthesized (IJISS) DNA arrays for ChIP-on-chip analysis of
S. coelicolor.
Streptomycetes are unusual in possessing genomes of very
high G+C content. The S. coelicolor genome is 72.4% G+C
and individual coding sequences often exceed 80% G+C. This
extreme base composition compromises the design of suita-
ble probes for array-based detection of complementary
nucleic acid sequences because G+C-rich probes often
hybridize poorly with targets or they display a lack of specifi-
city. Consequently, in this study we adopted an experimental
approach to test a large collection of arrayed probes for sensi-
tivity and specificity prior to selecting a subset for the final
genome arrays. The objective was to produce a versatile
experimentally optimized array that could be used for both
genome-wide ChIP-on-chip analysis and global gene expres-
sion profiling.
The HspR heat-shock regulatory system of S. coelicolor [6]
was exploited to test and validate the sensitivity and specifi-
city of the IJISS arrays. HspR was selected because it repre-
sents a well-characterized repressor with a small number of
known targets. Streptomycetes have adopted diverse strate-
gies to rapidly adjust to sudden changes in the environment,
for example, from heat stress or other physico-chemical and
physiological stresses. As in all living organisms, they induce
expression of many genes in response to heat stress, including
the well characterized and universally conserved members of
the hsp70 (dnaK) and hsp60 (groEL) gene families (see [16-
18] for reviews). In Streptomyces and most Gram-positive
and Gram-negative bacteria the heat shock stimulon is under
the control of negative transcriptional regulators [19], unlike
Escherichia coli where the heat shock stimulon is under the
positive regulation of the alternative sigma factors σ
32
and σ
24
[20,21]. The heat shock stimulon mostly comprises two major
classes of genes encoding, respectively, molecular chaperones
and proteases that are induced under conditions that cause
protein misfolding/denaturation in order to maintain protein
quality control, or eliminate protein aggregates or badly dam-
aged proteins that would otherwise have a deleterious effect
on cell survival.
Three negative transcriptional regulators have been charac-
terized in Streptomyces species: HrcA, controlling the
groES/EL1 operon and groEL2 (for a review, see [22]); RheA
controlling hsp18 in Staphylococcus albus [23,24]; and HspR
controlling the dnaK operon, clpB molecular chaperone and
lon protease-encoding genes [25-27].
The HspR repressor has since been identified in some other
bacterial systems: Mycobacterium tuberculosis, where it con-
trols the expression of the hsp70 operon, clpB and acr2 genes
[28]; and Corynebacterium glutamicum [29], where it con-
trols the clpP1/P2 operon together with two other regulators,
ClgR and σ
H
. Furthermore, the HspR system has been
reported in other bacteria not belonging to the Actinomyc-
etales family, such as the Gram-negative Helicobacter pylori,
where HspR functions in conjunction with HrcA to regulate
the groES/EL and hrcA-dnaK-grpE operons [30-32], Deino-
coccus radiodurans, where HspR controls two novel mem-
bers of the regulon (hsp20 and ftsH) in addition to known
members such as dnaK, dnaJ, grpE, lonB and clpB [33], Bifi-
dobacterium breve [34] and Campylobacter jejuni [35].
In the present study we have optimized methods for chroma-
tin immunoprecipitation and have produced optimized high
density arrays for ChIP-on-chip analysis of S. coelicolor. Here
we exploit this technology (to our knowledge applied for the
first time with Streptomyces) to redefine the HspR regulon of
S. coelicolor. The microarray design allows gene expression
data to be superimposed for the same probes, enabling dis-
crimination between indirect effects of either over-expressing
or disrupting a regulator gene from the direct effect resulting
from the in vivo binding of the respective regulator to its tar-
get genes. In addition to confirming dnaK, clpB and lon as in
vivo targets of HspR, the ChIP-on-chip studies reported here
indicate that HspR also has a role in regulation of expression
of ribosomal RNA and specific transfer RNA genes, for incor-
poration of Gln and Glu, the latter potentially linked with
tetrapyrrole biosynthesis. This suggests that HspR fulfils a
broader role in adaptation to stresses, such as heat-shock,
than was previously recognized - influencing expression of
key components of the translational apparatus in addition to
Genome Biology 2009, Volume 10, Issue 1, Article R5 Bucca et al. R5.3
Genome Biology 2009, 10:R5
major molecular chaperone and protease-encoding genes. It
is envisaged that these IJISS arrays will find wide application
in systems level studies of Streptomyces biology.
Results and discussion
DNA microarray design
Two different S. coelicolor IJISS DNA microarrays were
designed, featuring, respectively, 22,000 (Sco-Chip
2
-v1) and
44,000 (Sco-Chip
2
-v2) 60-mer oligonucleotide probes. In
each case the same experimental optimization approach was
used (Figure 1) where a large set (approximately 1 million) of
60-mer probes were printed in parallel with corresponding
probes that had a 3-nucleotide mismatch. Cyanine-3 (Cy3)
and Cyanine-5 (Cy5)-labeled S. coelicolor genomic DNA was
hybridized against the test arrays and the probe performance
was scored using the following equations. Firstly the Cy3 and
Cy5 background-subtracted signals, designated 'g' and 'r',
respectively, obtained by feature extraction of the arrays
using the Agilent feature extraction software (Version 9.1.3.1)
were entered into the following formula:
A = (gMM/gPM + rMM/rPM)/2
where the signal from the perfectly matched probe is desig-
nated 'PM' while that from the corresponding mismatched
probe is designated 'MM'. For values of A greater than 1, A
was set to 1 before entering it into the second equation:
R = [1 - arctan (A × π/2)] × [1 - exp(- (gPM + rPM)/2000)]
The resulting R-value was used to rank all tested probes. The
higher the value, the better the probe performance. This
method of ranking probes was developed within Oxford Gene
Technology Ltd and has been applied to various prokaryotic
organisms for empirical microarray probe design.
Sets of probes within a defined region, either gene or inter-
genic, were ranked. All probes were considered relative to
each other without applying thresholds and the desired den-
sity of probe coverage was achieved by selecting top-ranked
probes where possible. Performing the above experimental
optimization approach is, in our opinion, a necessary step,
given that approximately 40% of the in silico designed probes
failed quality control. Sufficient probe coverage was obtained
using fewer than 5% of probes ranked below the median value
of the ranking distribution. The remaining 95% of the opti-
mized probe set were picked from probes performing above
average with a strong bias for very well performing probes.
For both array formats the probes were deposited at random
positions on the slide surfaces to minimize the risk of any
position-specific artifacts.
Sco-Chip
2
-v1 array
All possible 60-mer probes for all targets (both coding and
non-coding sequences) in the S. coelicolor genome (based on
the S. coelicolor A3(2) [EMBL:AL645882.2
]) were designed.
For this version of the array all non-coding sequences
upstream of protein-encoding genes were selected (sequences
where transcription factors are most likely to bind) and mul-
tiple 60-mer probes targeting those regions were selected
from the 'all possible probes' set. Following this initial selec-
tion, a total of 84,268 probes were experimentally tested and
the best performing 21,064 probes that represented all
upstream intergenic regions (an average of 3 approximately
110 bp spaced probes to each upstream site) in the genome
were synthesized on the array. As this array design was devel-
oped specifically for ChIP-on-chip experiments, all probe
sequences corresponded to one strand only (that in
[EMBL:AL645882.2
]) since the particular DNA strand was
unimportant. (Note that intergenic regions flanked by tran-
scription terminators for convergently transcribed genes
were not selected for this array.)
Sco-Chip
2
-v2 array
From the 'all possible probes' set (see above), 964,820 60-
mer probes were selected and printed to target all coding and
non-coding sequences with minimal distance between the
probes and maximal coverage of the genome. Following
experimental validation of probe signal and specificity,
43,798 of the best performing probes were selected to give
broad coverage. Probes within protein coding sequences cor-
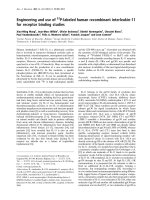
Overview of array design strategyFigure 1
Overview of array design strategy.
Store
In silico design of all possible 60- mer
probes in the S. coelicolor genome
Select all probes for regions of interest:
intergenic regi ons for Sco-Chip
2
-v1, coding
and intergenic regions for Sco-Chip
2
-v2
Synthesize selected probes along with
respective mismatch probes on to arrays
and hybridize with genomic DNA
Select good quality probes (good intensity,
no cross-hybridization etc.) that give
maximum coverage of regions of interest
given the density of array (22k or 44k)
Synthesize best -performing
probes on to arrays
Design complete.
StoreStore
.
-
Genome Biology 2009, Volume 10, Issue 1, Article R5 Bucca et al. R5.4
Genome Biology 2009, 10:R5
responded to the mRNA strand for (cDNA-based) detection
of gene expression. For intergenic regions the probe
sequences corresponded to one strand only (that in
[EMBL:AL645882.2
]). The average spacing of probes in the
genome was approximately 135 bp.
Genome-wide identification of in vivo HspR binding
sites
The experimentally optimized Sco-Chip
2
-v1 and Sco-Chip
2
-
v2 arrays were used consecutively to identify in vivo targets of
HspR. The latter array was designed to also enable quantifi-
cation of gene expression. In order to validate the sensitivity
and specificity of these arrays, we chose the well-studied tran-
scriptional repressor HspR, which was previously known to
bind to only three promoter regions in the genome of S. coeli-
color: upstream of the dnaK operon; the protease-encoding
gene lon; and the clpB gene, which is transcribed in an operon
with SCO3660. These results were based on transcriptome
analysis of an hspR disruption mutant and complementary in
silico genome wide searches for HspR binding sites [6].
For the ChIP-on-chip experiments, samples of S. coelicolor
cultures at early stationary phase were treated with formalde-
hyde and subjected to immunoprecipitation (IP) as described
in Materials and methods. For these experiments, S. coeli-
color was cultivated under non-heat-shock conditions in a
rich liquid medium containing 10.3% sucrose to support dis-
persed growth of the mycelium and provide sufficient bio-
mass for the ChIP protocol; this was to maximize
formaldehyde penetration and to determine the genomic dis-
tribution of HspR under non-stressed conditions (the 'rest-
ing' state). Following the IP reaction, the DNA was recovered,
labeled with Cy3-dCTP and then co-hybridized onto the Sco-
Chip
2
-v1 and Sco-Chip
2
-v2 arrays together with the Cy5-
dCTP-labeled total chromatin as reference (Sco-Chip
2
-v1) or
with Cy5-dCTP labeled mock 'no-antibody' IP chromatin
(Sco-Chip
2
-v2) (see Materials and methods). The results pre-
sented in Figures 2 and 3 (and Additional data file 3) repre-
sent the average of two biological replicates. They confirm
that HspR does bind, in vivo, to the dnaK, clpB and lon pro-
moter regions and, importantly, have served to identify addi-
tional putative HspR targets. The statistical approaches used
to score probe enrichment ratios (gene targets) as significant
differed between the two array formats because in Sco-Chip
2
-
v1 the probes were focused only on promoter regions while in
Sco-Chip
2
-v2 the probes were relatively evenly spaced across
the genome (see Materials and methods). The targets scored
as significant using Sco-Chip
2
-v1 were dnaK, clpB, lon and
SCO5639 and those on Sco-Chip
2
-v2 were dnaK, clpB, lon
and probe sequences between SCO3019-SCO3020 and
SCO5549-SCO5550, corresponding, respectively, to the pro-
moter region of the rrnD ribosomal RNA operon and a five-
tRNA cluster encoding tRNA
Gln
and tRNA
Glu
species; if the
cut-off threshold was slightly relaxed for the Sco-Chip
2
-v2
data, then SCO5639 was also identified.
The respective nucleotide sequences of the new putative sta-
ble RNA targets of HspR had been excluded from Sco-Chip
2
-
v1 because they are non-protein-coding and are positioned
between convergently transcribed genes. The discovery that
HspR may regulate specific tRNA and rRNA genes is unprec-
edented and suggests a more global role for HspR in the stress
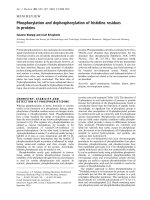
HspR-mediated enrichment of array probes across the S. coelicolor genomeFigure 2
HspR-mediated enrichment of array probes across the S.
coelicolor genome. Black dots indicate probes identified as being
significantly enriched (see Materials and methods). Note that there are
multiple probes for each gene/intergenic region. (a) Probes identified with
array Sco-Chip
2
-v1. The list of significant probes is given in Additional data
file 12. (b) Probes identified with array Sco-Chip
2
-v2 (listed in Additional
data file 13).
(a)
(b)
Genome Biology 2009, Volume 10, Issue 1, Article R5 Bucca et al. R5.5
Genome Biology 2009, 10:R5
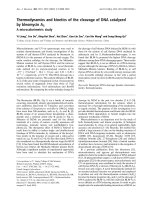
Probe signals across significantly scoring HspR target regions using the Sco-Chip
2
-v2 arrayFigure 3
Probe signals across significantly scoring HspR target regions using the Sco-Chip
2
-v2 array. (a) the dnaK operon, (b) the clpB (SCO3661)
operon, (c) the lon gene (SCO5285), (d) the rrnD ribosomal RNA operon and (e) the tRNA
Gln/Glu
cluster. The anti-HspR-enriched probes are plotted on
a linear scale (red), the heat-shock expression ratio at 42°C versus 30°C is plotted in log
2
scale (blue), and the expression ratio of the hspR disruption
mutant versus wild-type is plotted in log
2
scale (green). Open circles indicate the start co-ordinate (relative to genome sequence) of each probe that
passed quality control filtering. The genetic organization of each region is indicated below the plot; each arrow represents a coding sequence or stable
RNA gene as defined in [EMBL:AL645882.2
].
hspR dnaJ grpE dnaK SCO3660 clpB
lon ׀ rrnD operon ׀
tRNA
Gl n/Glu
׀׀
A B
C D
E
Key:
hspR dnaJ grpE dnaK SCO3660 clpB
lon ׀ rrnD operon ׀
tRNA
Gl n/Glu
׀׀
(a) (b)
(c) (d)
(e)
Key:
A verage Ab bound chromatin/No Ab bound chromatin
Average log
2
42°C/30°C expression ratio
Average log
2
hspR mutant/wild type expression-ratio
Genome Biology 2009, Volume 10, Issue 1, Article R5 Bucca et al. R5.6
Genome Biology 2009, 10:R5
response of Streptomyces. The HspR-specific probe enrich-
ments in the previously known and the new putative HspR
targets are shown in Figure 3 (and Additional data file 3).
The heat-shock stimulon of S. coelicolor
The versatility of the Sco-Chip
2
-v2 design allowed us to detect
gene expression using the same probe set. Thus, in Figure 3
the expression data from two pairs of comparisons are also
superimposed on the ChIP enrichment data: the ratio of
expression from hspR disruption mutants relative to the wild-
type strain; and the ratio of expression from cultures heat-
shocked at 42°C relative to non-heat-shocked control cul-
tures. It is noted that the observed reduction of relative tran-
script levels of operonic genes more distal from the operon
promoter (as in the dnaK operon; Figure 3a) is consistent
with general observations of polarity of expression of Strepto-
myces operons [36].
The gene expression studies were conducted using RNA sam-
ples from strains cultivated on supplemented minimal
medium agar plates, rather than rich liquid medium. This was
for several reasons. First, the magnitude of the heat-shock
response is relatively lower and less reproducible in heat-
shocked mycelium cultivated in the rich YEME+10.3%
sucrose liquid medium, compared with the heat-shock
response of the surface-grown minimal medium cultures.
Second, the hspR disruption mutants used in this study are
unstable because hspR is an essential gene [6,27]. The disrup-
tion of hspR is via a single integration event of a non-replicat-
ing plasmid and there is a strong selective pressure for its
excision. Thus, in liquid culture the mycelium in which the
disruption plasmid has excised outgrows the mutant myc-
elium, which is at a growth disadvantage, leading to a domi-
nant wild-type revertant phenotype. In surface-grown
cultures this reversion is markedly attenuated, where a low
frequency of reversion maintains viability. Third, the RNA
samples used here for comparison with the ChIP data have
been extensively validated by other methods [6,27]. The
above experiment allowed, for the first time, a comprehensive
identification of the heat-shock stimulon of S. coelicolor at
the transcriptome level, where rank products analysis
revealed 119 up-regulated genes (based on a probability of
false prediction (pfp) threshold of <0.15 (see Materials and
methods)) as a result of heat-shock (Additional data file 4).
The use of such thresholds has been reported elsewhere
[7,37].
Two genes on the heat-shock list with relatively high pfp val-
ues (SCO3202, pfp = 0.12; SCO4157, pfp = 0.13) were selected
for independent validation by quantitative real time PCR
(qPCR) to confirm true heat-shock induction (Additional data
file 9); furthermore, SCO3660, a known member of the HspR
regulon [6], had a pfp value of 0.12. This justified the use of
the pfp threshold adopted here. The significantly up-regu-
lated heat shock genes include all members of the dnaK
operon, clpB, lon and the chaperonin-encoding groES-
groEL1 operon and groEL2. Two more protease-encoding
genes are also present in the heat-shock list: SCO4157, encod-
ing the homologue of E. coli HtrA, a serine protease involved
in degradation of periplasmic misfolded proteins, and
SCO6515. Notably, eight oxidoreductase-encoding genes are
present, some of them being strongly up-regulated by heat-
shock and transcribed in an operon (SCO1131
-SCO1134). The
operon encoding different subunits of the nitrate reductase
(SCO0216-SCO0219) and the nitrite/nitrate transporter-
encoding gene SCO0213 are also heat-inducible together with
the principal 'gas vesicle protein'-encoding operon
(SCO6499-SCO6508) [38], the cytochrome oxidase-encoding
genes SCO3945-SCO3946 and two genes of sigE operon (sigE
(SCO3356) and the lipoprotein-encoding gene cseA
(SCO3357)) [39]. It is of interest that more than 10% of the
heat-shock-induced genes (14) encode transcriptional regula-
tors and included SCO0174 (the most induced), five sigma
factors (HrdD (SCO3202), SigB (SCO0600), SigE (SCO3356),
SigL (SCO7278) and SigM (SCO7314)) and an anti-sigma fac-
tor antagonist (SCO7325). A separate, complementary analy-
sis of the heat-shock response in wild-type S. coelicolor
cultivated under identical conditions in YEME to those used
for the ChIP-on-chip studies demonstrated that most of the
above 119 heat-shock induced genes (102/119) were also heat-
induced in the YEME medium (Additional data file 11); how-
ever, the level of induction of the well-known molecular chap-
erone-encoding genes was attenuated relative to the surface
grown SMMS cultures. It is interesting to note that 16 of the
17 genes not heat-induced in the YEME cultures are clustered
in a discrete region at the left end of the chromosome between
SCO162 and SCO219; this may reflect the differences in the
widely different nutritional compositions of the two growth
media and these genes may require additional transcription
factors for their induction.
The list of 55 genes significantly up-regulated in an hspR dis-
ruption mutant relative to the wild-type is presented in Addi-
tional data file 5 (cut-off pfp < 0.15). It includes all previously
known members of the HspR regulon and other notable genes
that, on the basis of the ChIP-on-chip analysis, are not con-
sidered to be directly controlled by HspR; their induction
could be a consequence of the up-regulation of molecular
chaperone or protease-encoding gene expression in the HspR
mutant. Genes for five putative transcriptional regulators are
represented in the list.
New putative targets of HspR
The sensitivity of the IJISS arrays was deduced to be high
since all previously known HspR targets were identified on
both array designs. SCO5639 was not identified as belonging
to the HspR regulon in a previous study [6]. SCO5639
encodes a hypothetical protein of 176 amino acids in length
and, unusually for streptomycete genes, has a low G+C con-
tent (approximately 53%) and is flanked by genes also of low
G+C content: SCO5638 (55% G+C), which encodes an inte-
gral membrane protein, and SCO5640 (54% G+C), which
Genome Biology 2009, Volume 10, Issue 1, Article R5 Bucca et al. R5.7
Genome Biology 2009, 10:R5
encodes a hypothetical protein. Moreover, the adjacent gene,
SCO5641, encodes a putative transposase, suggesting that
SCO5639 could have been laterally acquired recently. Pfam
[40] searches of the deduced amino acid sequence of
SCO5639 returned the 'domain of unknown function'
DUF1863, corresponding to a domain that adopts the 'flavo-
doxin fold' with "a probable role in signal transduction as a
phosphorylation-independent conformational switch pro-
tein". Other proteins that contain this domain (37 known in
total, including another actinomycete, Corynebacterium effi-
ciens) are also uncharacterized. Similarly, blastp [41,42]
results identified further hypotheticals (at E-value < 1
e-10
) and
found a similarity, albeit low (35% identity), to the phospho-
rylation site of the calcineurin temperature suppressor (Cts1)
of Cryptococcus neoformans (a yeast), which is responsible
for restoring growth of calcineurin mutant strains at 37°C
among other functions such as cell separation and hyphal
elongation [43]. This link with temperature would be consist-
ent with SCO5639 being a target of HspR.
The HspR binding motif
In previous work the minimal consensus operator for HspR
binding, generated by the alignment of upstream sequences
of clpB, lon and dnaK, was documented as 5'-TTGAG-
YNNNNNNNACTCAA [6]. A MEME (Maximum Em for Motif
Elicitation) alignment (see Materials and methods) of the
upstream sequences of these three genes and SCO5639 pro-
duced a modified consensus sequence of 5'-TKGARTNN-
NYNNRAYTCA (Figure 4). This new consensus sequence was
used to search the S. coelicolor genome using RSAT [44,45]
with default settings; five matches were found, SCO4410 and
the above four genes.
In vitro analysis of new HspR targets
Gel shift assays were conducted using DNA sequences
upstream of the dnaK operon as a positive control [26] (data
not shown), SCO5639 and SCO4410. The results indicate that
HspR binds in vitro to the putative HspR motifs of SCO5639
and SCO4410 (Figure 5). However, a convincing gel-shift was
only obtained for SCO5639 and SCO4410 with the HspR-con-
taining E. coli cell extracts and not with the purified, refolded,
HspR, suggesting that additional factors might be required
for an efficient binding/stabilization of HspR at the SCO5639
and SCO4410 promoters; such factors would need to have a
counterpart in E. coli to explain these results. An alternative
explanation could be that the HspR-DnaK complex in the
SCO5639 and SCO4410 promoter regions is weaker and that
this binding is not necessarily responsible for modulating
heat-shock regulation of these genes. Expression of these two
genes following heat-shock and in a hspR disruption mutant
was assessed by qPCR (Additional data files 9 and 10).
SCO5639 was only modestly heat-induced (by 23%) but,
importantly, it was up-regulated approximately fivefold in a
hspR disruption mutant. It is possible that SCO5639 is co-
regulated by other factors that are not influenced directly by
heat. SCO4410, a very poorly expressed gene, was induced
Consensus operator sequence for HspRFigure 4
Consensus operator sequence for HspR. The nucleotide sequence was determined by the alignment of the upstream regions of HspR targets
identified by Sco-Chip
2
-v1 (see Materials and methods). The sequences are displayed above the consensus plot; numbering of nucleotides is relative to the
predicted start codon of each gene. In the graphical representation of the consensus sequence the height of each nucleotide indicates the level of
conservation [76,77].
-129CCGCTCGGAT TGGAATTACTAAGATTCAGGATGCAGCACGCATCGTAAA-177SCO5639
-54CGGATAAGAG TTGAGTCCGCTCGACTCACCTCTGTTGACCCATCGCCGG-102SCO3671
-3CTCCCTTTCA TTGAGTCGATGTAACTCAACTTGACTGCCGAAGGGGAGA-51SCO5285
-31GCCCGACTCC TTGAGTGGCCCTGACTCAACTTTGTGTACGCTGGACGAG-79SCO3661
-129CCGCTCGGAT TGGAATTACTAAGATTCAGGATGCAGCACGCATCGTAAA-177SCO5639
-54CGGATAAGAG TTGAGTCCGCTCGACTCACCTCTGTTGACCCATCGCCGG-102SCO3671
-3CTCCCTTTCA TTGAGTCGATGTAACTCAACTTGACTGCCGAAGGGGAGA-51SCO5285
-31GCCCGACTCC TTGAGTGGCCCTGACTCAACTTTGTGTACGCTGGACGAG-79SCO3661
Genome Biology 2009, Volume 10, Issue 1, Article R5 Bucca et al. R5.8
Genome Biology 2009, 10:R5
approximately 3-fold by heat-shock and it was up-regulated
approximately 15-fold in a hspR disruption mutant. On the
basis of these results, SCO4410 and SCO5639 are considered
to be genuine targets of HspR. The SCO4410 gene, which is
predicted to encode an anti-anti-sigma factor was not identi-
fied in the ChIP-on-chip experiments. It is known that false
negatives occur in such studies and they are considered to
arise due to sequestration of the transcription factor in nucle-
oprotein complexes, rendering them inaccessible to the spe-
cific test antibody used for the IP reaction; it should be noted
that one of the best studied protein-DNA complexes, the
CRP-lac promoter complex of E. coli, was not identified in
ChIP-on-chip analysis of CRP binding in E. coli [12].
Stable RNA genes as putative targets for HspR
The observation that HspR appears to bind to the promoter
region of the rrnD operon and to multiple sequences within
the five-tRNA
Gln/Glu
cluster is unprecedented. Other than the
previously known HspR targets, these were the only two
regions identified as statistically significant by the data clus-
tering method reported in this study for the Sco-Chip
2
-v2-
derived data. Previous studies would not have identified sta-
ble RNA genes as potential targets because representative
probes had not been printed on the arrays. Furthermore, the
typical 'transcription factor binding site' consensus sequence
identification technique is based on searching the upstream
regions of protein-encoding genes and/or a set threshold is
applied in silico, which may not be able to simulate the true in
vivo binding that occurs. Indeed, the in silico analysis carried
out in this study (discussed in Materials and methods),
revealed only partial recognition of the defined HspR consen-
sus (Additional data file 6) whilst the in vivo data (ChIP-on-
chip enrichment ratios) indicate HspR binding. Thus, it is
likely that other transcription factors also bind to these
regions, or that other DNA sequences facilitate HspR-bind-
ing, and it is possible that such factors could positively influ-
ence the binding of HspR, relieving its dependence on a
substantial consensus sequence match. In this context it is
notable that the most highly enriched probes flank both the
beginnings and ends of the rrnD operon and five-tRNA clus-
ter (Figure 3d,e, respectively); it is conceivable that HspR
forms a looped complex at both of these stable RNA-encoding
regions. A MEME analysis (see Materials and methods)
revealed a non-palindromic motif shared between the HspR
targets identified with the Sco-Chip
2
-v2 array (Additional
data file 7); the biological significance of this motif is not
clear.
HspR regulates the DnaK chaperone machine, a system that
plays an important role in the cotranslational folding of pro-
teins [46] in addition to assisting folding of unfolded or par-
tially unfolded mature polypeptides. It could be rationalized
that HspR inactivation also facilitates expression of rRNA
and tRNAs following heat-shock, or other stresses, as part of
the transient adaptive response to environmental stresses.
From the gene expression analysis (Figure 3; Additional data
files 14 and 15) there is a detectable enhancement (albeit
small) of rrnD and tRNA
Gln/Glu
transcript levels in heat-
shocked cultures and in an hspR disruption mutant; a high
over-representation would not be expected because these
particular stable RNA genes are highly expressed under nor-
mal growth conditions (data not shown) and a transient
(approximately 15 minute) induction of one of the rRNA
operons would not have a major impact on the large pre-exist-
ing pool of these stable species within the cytoplasm. From
averaging of signals from the multiple probes in this region,
the increase in the rrnD 16S rRNA transcript level was ≥ 10%
following heat-shock and ≥ 20% in an hspR disruption
mutant. We suggest that HspR-mediated control of rrnD
transcription facilitates the maintenance of rRNA transcrip-
tion following heat-shock. There are precedents for heat-
stimulated transcription of rRNA operons in both Streptomy-
ces and E. coli. León and Mellado demonstrated partial heat-
shock stimulation of some rRNA promoters in the closely
related species S. lividans [47]. In E. coli the heat-shock
sigma factor σ
32
was shown to direct transcription of the rrnB
P1 promoter and the authors suggest that σ
32
-directed tran-
scription of rRNA promoters might play a role in ribosome
synthesis at high temperatures [48]. There are also reports of
developmental regulation of rRNA and ribosomal protein
synthesis in S. coelicolor [49,50]. The upstream region of
rrnD of S. coelicolor displays significant differences from that
of other rRNA promoters in this genome (S. coelicolor con-
tains six rrn operons). In this context it is of relevance that a
recent study suggests that the p3 and p4 promoters of rrnD
Gel-shift assays of putative new HspR targets: SCO5639 and SCO4410Figure 5
Gel-shift assays of putative new HspR targets: SCO5639 and
SCO4410. HspR-binding at the SCO5639 and SCO4410 promoter regions.
Oligonucleotide pairs are detailed in Materials and methods. Protein
extract from E. coli over-expressing hspR was incubated with 200 fmol
biotinylated DNA fragment without competitor DNA (lanes 1-3) with,
respectively, 4, 6 and 12 μg cell extract. In the lane marked 'C
1
' in the
SCO5639 gel shift, 4 μg cell extract and 200-fold molar excess of specific
competitor DNA were loaded. In lanes C
1
-C
3
in the SCO4410 gel shift, 4,
6 and 12 μg cell extract were loaded, respectively, together with 200-fold
molar excess of specific competitor DNA. Lane F shows unbound DNA
(no added protein). Arrows indicate positions of bound (upper arrows)
and unbound double-stranded DNA target.
C
1
3 2 1 F C
3
C
2
C
1
3 2 1 F
SCO5639 SCO4410
Genome Biology 2009, Volume 10, Issue 1, Article R5 Bucca et al. R5.9
Genome Biology 2009, 10:R5
are differentially regulated by additional (as yet unidentified)
factors [51]. It is tempting to speculate that HspR-mediated
induction of rrnD transcription may result in the production
of a subset of ribosomes with a specific role in translation of
stress-responsive proteins.
Transient stimulation of transcription of the tRNA
Gln/Glu
clus-
ter may lead to an enhancement in the cellular level of
uncharged tRNAs - particularly since Gln-tRNA
Gln
formation
requires transamidation of Glu-tRNA
Gln
[52]. In this context
it might be relevant that the tRNA
Gln/Glu
cluster encodes the
only two tRNA
Gln
species in S. coelicolor and the transient
accumulation of uncharged tRNAs is known to be a major
trigger for the stringent response [53].
Most organisms contain only one Glu-tRNA
Glu
species [54].
The tRNA
Gln/Glu
cluster identified in this study encodes three
Glu-tRNA
Glu
species (recognizing the GAG codon); one other
Glu-tRNA
Glu
gene is encoded elsewhere in the S. coelicolor
genome and recognizes the GAA codon, which is a very rarely
used streptomycete codon. Glu-tRNA
Glu
has two major roles
in the cell. In addition to its role in protein synthesis, Glu-
tRNA
Glu
is a substrate in the first step of tetrapyrrole biosyn-
thesis, to produce heme, for example [54,55]. Inspection of
the predicted protein products from the S. coelicolor genome
indicates that this is the only available route for tetrapyrrole
biosynthesis in this organism. It is possible, therefore, that
there is an enhanced requirement for tetrapyrrole production
following heat-shock (and concomitant oxidative stress), to
provide heme, for example, for cytochrome biosynthesis and
for catalase and superoxide dismutase production and this
could be achieved by HspR-mediated regulation of Glu-tRNA-
Glu
expression.
An additional possible explanation for enhanced expression
of this sub-set of tRNAs could be that there is a higher tran-
sient demand for Gln and Glu in protein synthesis immedi-
ately following heat-shock. Transcript levels of two of the five
tRNA species was enhanced approximately 10% in hspR dis-
ruptants (Figure 3; Additional data file 15). Indeed, the Gln/
Glu frequency (the percentage of Gln/Glu codons in a codon
set) in the heat-shock up-regulated gene set (Additional data
file 4) is higher than that obtained for the entire genome
(9.76% versus 8.32%). To estimate the significance of this
finding, 10,000 random subsets of genes from the entire
genome, of the same size as the up-regulated gene list, were
created and their Gln/Glu frequency was calculated. It was
found (through the use of the Z-score) that the heat-shock up-
regulated gene set had an enhanced Gln/Glu codon frequency
compared to any of the random sets, yielding a significance p-
value of < 1.06 × 10
-7
. It is concluded that there is statistically
significant enrichment of Gln/Glu codons in the heat-shock
up-regulated genes and we speculate that HspR mediates
transient stimulation of expression of the relevant tRNAs.
Although the biological significance of this finding is not
clear, it may be relevant that Glu (and Lys) tend to be over-
represented in thermostable proteins [56]. The difference in
amino acid composition of the heat-shock genes relative to all
genes, for all amino acids and amino acid pairs, is given in
Additional data file 8.
Conclusion
High density IJISS DNA arrays have been developed for glo-
bal analysis of Streptomyces gene expression and transcrip-
tion factor binding. The HspR regulatory system of S.
coelicolor was exploited to validate their sensitivity and spe-
cificity. New insights were gained into the possible role of
HspR in regulation of cellular physiology - encompassing sta-
ble RNA synthesis in addition to molecular chaperone and
protease production. It is envisaged that these arrays will find
widespread use in systems level analysis of Streptomyces coe-
licolor biology.
Materials and methods
Streptomyces strains and culture conditions
For the ChIP-on-chip studies the prototrophic S. coelicolor
strain MT1110, a SCP1
-
SCP2
-
derivative of the wild-type
strain, John Innes Stock Number 1147 [57], was cultivated in
YEME liquid medium plus 10% sucrose at 30°C in a rotary
shaking incubator. For the gene expression studies the previ-
ously reported two independent hspR disruption mutants,
MT1151 and MT1153, were used together with the two inde-
pendent, otherwise isogenic, hspR
+
integrants, MT1152 and
MT1154 [58]. The heat-shock conditions were as reported
previously [26].
Chromatin immunoprecipitation
In order to obtain Streptomyces chromatin of high quality, it
was found that rapid, low temperature, physical disruption of
the mycelium constituted a more reproducible method than
the conventional lysozyme treatment methods. S. coelicolor
MT1110 was cultivated at 30°C in 50 ml YEME liquid medium
in 250 ml flasks with springs (supplemented with 10%
sucrose, glycine and MgCl
2
as specified in [58] up to early sta-
tionary phase (OD
450
approximately 2.0). Cultures were
divided into 20 ml aliquots and formaldehyde treated (final
concentration, 1%) for 10 minutes at 30°C in order to in vivo
crosslink proteins to DNA; glycine (final concentration of 0.5
M) was added to quench the formaldehyde and the culture
was incubated for a further 5 minutes at 30°C. Mycelium was
harvested by centrifugation, frozen in liquid nitrogen and
then transferred to a 7 ml PTFE shaking flask with cap (which
was also immersed in liquid nitrogen to cool it down). Myc-
elium was disrupted in a Mikrodismembrator U mechanical
device (Sartorius Stedim Biotech, Epsom, Surrey, UK) for 2 ×
1 minute at 2,000 rpm with one 10 mm diameter chromium
steel grinding ball and contents of one tube of lysing matrix B
(Q-BIOgene, Cambridge, UK). Chromatin processing and IP
were based on previous methods [59,60] with additional
modifications. The pulverized mycelium was transferred to a
Genome Biology 2009, Volume 10, Issue 1, Article R5 Bucca et al. R5.10
Genome Biology 2009, 10:R5
tube containing 1 ml lysis buffer (10 mM Tris-HCl, pH 8, 20%
sucrose, 50 mM NaCl, 10 mM EDTA, Protease Inhibitor Cock-
tail (Roche, Burgess Hill, West Sussex, UK); one tablet per 10
ml); 3 ml IP buffer (50 mM Tris-HCl, pH 8, 150 mM NaCl,
0.5% Triton X-100, plus Protease Inhibitor Cocktail) was
added and the chromatin was sheared by sonication (Sonics
VibraCell VCX130, CH-1217 Meyrin/Satigny, Switzerland) on
ice. One 2 ml aliquot was sonicated 2 × 20 s power ON at 50%
power, 40 s power OFF and the other 2 ml chromatin sample
was sonicated 4 × 20 s power ON at 50% power, 40 s power
OFF, to obtain the optimal DNA size range of 0.5-1.0 kb. Cell
lysates were cleared by centrifugation at 12,000 rpm for 25
minutes. To assess chromatin quality, aliquots of the chroma-
tin (70 μl) were treated with proteinase K (100 μg, Roche) for
2 h and the DNA-protein complexes were de-crosslinked at
65°C for 6 h; 5 μl aliquots were subjected to electrophoresis
and the chromatin fraction(s) with optimal size range were
subjected to IP either with specific antibody or with no anti-
body (mock IP) as control. The IgG fraction containing anti-
HspR polyclonal antibodies [61] and the fraction from pre-
immune serum from the same rabbit used for immunization
were purified through Nab Protein A spin columns (Pierce,
ThermoFisher Scientific, Cramlington, Northumberland,
UK). Chromatin IP was carried out with 100 μl specific anti-
body added to 800 μl of chromatin overnight at 4°C on a
rotating wheel at 12 rpm; 80 μl of either sepharose protein A
(Sigma, Gillingham, Dorset, UK) or Ultralink immobilized
Protein A/G beads (Pierce; previously washed twice in phos-
phate-buffered saline (PBS), once in PBS containing 5 μg/ml
bovine serum albumin and resuspended in one half bead vol-
ume of PBS containing a protease inhibitor cocktail) were
added to the immunoprecipitated chromatin and incubated
for a further 3-4 h at 4°C on a rotating wheel at 12 rpm. The
DNA-protein complexes bound to the beads were pelleted at
3,300 rpm for 1 minute and washed four times by resuspen-
sion in 1 ml ice cold IP buffer (wash 1), IP buffer plus salt
(wash 2, as wash 1 but with 500 mM NaCl), wash buffer (wash
3, 10 mM Tris pH 8, 250 mM LiCl, 1 mM EDTA, 0.5% nonidet
P-40 and 0.5% Na deoxycholate) and TE pH 7.6 (wash 4),
with incubation at 4°C in a rotating wheel for 15 minutes and
centrifugation at 3,300 rpm for 1 minute. After the first wash
the protein A/G bound DNA protein complexes were trans-
ferred to a non-stick microfuge tube.
Immunoprecipitated complexes were eluted overnight at
55°C in Tris-EDTA, pH 7.6 (TE), 1% SDS, 100 μg Proteinase K
(Roche) in 240 μl volume. A 170 μl aliquot of input chromatin
(not subjected to IP) or mock-IP chromatin was incubated in
parallel under the same conditions with 240 μl of elution
buffer. Crosslinks were dissociated at 65°C for 30 minutes fol-
lowed by centrifugation at 3,300 rpm for 1 minute. The pro-
tein A/G beads were washed in 50 μl TE and the supernatants
were pooled. The immunoprecipitated and input chromatin/
mock-IP samples were extracted twice with phenol/chloro-
form/isoamyl alcohol (25:24:1) pH 8, then once with chloro-
form and the DNA was ethanol precipitated in the presence of
20 μg glycogen as carrier, resuspended in 20 μl ultrapure
water and quantified with a NanoDrop spectrophotometer.
Nucleic acid labeling and IJISS array hybridizations
Immunoprecipitated and input control DNA were labeled
with Cy3-dCTP and Cy5-dCTP, respectively, using the Bio-
Prime kit (Invitrogen, Paisley, UK). DNA (0.1-1 μg) was dena-
tured at 94°C for 3 minutes in 40 μl including 20 μl 2.5×
random primer mix and kept on ice. Nucleotide mix (5 μl; 2
mM dATP, 2 mM dGTP, 2 mM dTTP, 0.5 mM dCTP), 3.75 μl
Cy3/Cy5-dCTP (Perkin Elmer, Beaconsfield, Bucks, UK) and
1.5 μl of Klenow fragment were added and the reaction was
incubated at 37°C overnight. The labeled DNA was purified
using the MinElute PCR purification kit (Qiagen, Crawley,
West Sussex, UK) and the incorporated Cy3/Cy5-dCTP was
quantified with the NanoDrop ND-1000 spectrophotometer.
For gene expression analysis, cDNA synthesis and labeling
were conducted as described previously [62].
For hybridization on Sco-Chip
2
-v1 arrays, 40 pmol of Cy3-
labeled immunoprecipitated DNA was co-hybridized with the
same amount of Cy5-labeled total input chromatin DNA in
500 μl Agilent hybridization buffer (1 M NaCl, 50 mM MES,
pH 7, 20% formamide, 1% Triton X-100 buffer), in an Agilent
Technologies hybridization chamber, rotated at 55°C for 60 h
in an Agilent Technologies hybridization oven. For hybridiza-
tion on Sco-Chip
2
-v2 arrays, 10-40 pmol of Cy3-labeled
immunoprecipitated DNA were co-hybridized with the same
amount of Cy5-labeled control mock IP DNA in 120 μl Agilent
hybridization buffer as above. To control for Cy-dye bias, the
hybridization was repeated with the same IP DNA samples
labeled in the opposite dye orientation. Two biological repli-
cates were hybridized on both array formats.
The arrays were washed once in 50 ml of 6 × SSPE, 0.005%
N-lauryl sarcosine and once in 0.06 × SSPE, 0.18% polyethyl-
ene glycol 200, both for 5 minutes at room temperature. The
arrays were briefly immersed in Agilent Technologies stabili-
zation and drying solution prior to processing in an Agilent
Technologies scanner. The probe signals were quantified
using Agilent's Feature Extraction software (version 9.1.3.1).
Two different types of dual hybridizations were conducted on
the arrays. With the Sco-Chip
2
-v1 arrays, HspR-IP chromatin
was co-hybridized with Cy5-labeled total input chromatin as
reference and the mock 'no-antibody' IP chromatin was also
co-hybridized with total input chromatin on a separate array;
the enrichment ratios for each probe were calculated as the
signal from the former divided by that from the latter array.
With Sco-Chip
2
-v2, the HspR-IP chromatin was co-hybrid-
ized directly with the mock 'no antibody' IP chromatin - the
sample processed in the same way as the HspR-IP, but with-
out the specific antibody. To compensate for any dye bias in
the latter experiments, replicate hybridizations were con-
ducted with both Cy3/Cy5 dye orientations on different
arrays. It should be noted that the experimental design in
Genome Biology 2009, Volume 10, Issue 1, Article R5 Bucca et al. R5.11
Genome Biology 2009, 10:R5
terms of hybridizations are different for Sco-Chip
2
-v1 (IP or
mock IP versus total chromatin) and Sco-Chip
2
-v2 (IP versus
mock IP), being comparable, respectively, to 'traditional'
microarray (expression) experimental designs of indirect and
direct hybridizations. However, both designs are valid since
ultimately the same output ratio of interest (IP/mock IP sig-
nal) is calculated. The direct hybridization approach, intro-
duced for Sco-Chip
2
-v2, is preferred because there is likely to
be a reduction in variance (as fewer arrays are used to derive
the same ratios).
RNA isolation analysis, cDNA synthesis and labeling
The RNA preparations used during this study were the same
as those reported in [27]. The RNA was isolated from 36 h S.
coelicolor MT1110 cultures grown on SMMS agar, by the
method reported previously [57]; RNA from YEME plus 10%
sucrose was isolated from 40 h batch cultures by the RNeasy
method described in [27]. RNA quality and integrity was re-
assessed using the Agilent Bioanalyzer 2100 system. The Cy3/
Cy5-dCTP labeled cDNA was synthesized from 10 μg RNA
samples following the methods described in [27].
Microarray data pre-processing
All (ChIP-on-chip and expression) hybridized arrays were
scanned using an Agilent Technologies microarray scanner
and resultant intensities calculated using Agilent Technolo-
gies Image Analysis and Feature Extraction software (version
9.1.3.1) with local background correction. Log
2
signal/refer-
ence ratios were calculated for all arrays, the reference chan-
nel either representing total input chromatin (Sco-Chip
2
-v1
array), mock 'no-antibody' IP (Sco-Chip
2
-v2 array) or cDNA
(Sco-Chip
2
-v2 array).
ChIP-on-chip array data were not normalized as the typical
microarray normalization assumptions do not hold [63]. All
expression arrays were normalized by the Loess method
using the LIMMA package [64,65] in R (version 2.5.0
[66,67]). For the heat-shock experiment, across array nor-
malization was applied such that the median absolute devia-
tions (MADs) were similar (scale function in LIMMA); no
further normalization was applied to the data from the hspR
mutant/wild-type comparison.
Within the output of the Feature Extraction software (Agilent
Technologies) there are four binary (1 for bad, 0 for good) var-
iables (gIsFeatNonUnifOL/rIsFeatNonUnifOL, gIsBGNonU-
nifOL/rIsBGNonUnifOL, gIsFeatPopnOL/rIsFeatPopnOL
and gIsBGPopnOL/rIsBGPopnOL) that describe outliers in
each channel on an array. Spots on the Sco-Chip
2
-v1 array
were flagged as poor quality if at least one of the four Feature
Extraction variables for the total input chromatin reference
channel had the value 1 (bad). Spots on each of the Sco-Chip
2
-
v2 arrays were flagged if at least one of the two channels was
classed as an outlier by Feature Extraction.
All data were filtered such that only those probes were
retained for analysis that had good quality data (not flagged)
in each replicate array (to control dye bias) within each inde-
pendent experiment: 20,586 probes for Sco-Chip
2
-v1 array;
43,056 probes for Sco-Chip
2
(ChIP-on-chip); and 43,263
probes for the Sco-Chip
2
-v2 gene expression analysis.
Microarray expression data analysis
The filtered data sets for the gene expression experiments
were analyzed using rank products analysis [37] via the Rank-
Prod package in R (version 2.5.0) [68]. This method has been
shown to be robust in the identification of true differentially
expressed genes in data sets where there are few replicates
and/or large variance [69,70]. Differentially expressed genes
were identified as having a pfp value [37] less than or equal to
0.15, equal to a false discovery rate of approximately 15%, a
threshold value lower than that applied in the literature with
this technique [37]. The microarray-derived expression data
have been deposited in ArrayExpress (accession numbers [E-
MAXD-44], [E-MAXD-46] and [E-MAXD-49]).
ChIP-on-chip data analysis
Sco-Chip
2
-v1 array
Genes were identified as having upstream regions enriched/
bound by HspR by the following steps. Step 1, probes that had
a significant (corrected p-value < 0.05, non-parametric t-test
[71] (using Bioconductor package [65])) difference between
log
2
'antibody IP'/total chromatin and log
2
'no-antibody IP'/
total chromatin were identified. Step 2, the average (across
biological replicates) log
2
antibody IP/total chromatin - log
2
no antibody IP/total chromatin distribution of significant
probes was plotted. Step 3, the right tail, the region of the dis-
tribution that departs from the typical Gaussian curve of the
distribution, was identified and used as the threshold (Addi-
tional data file 1). Step 4, enriched probes were identified as
having a ratio (average log
2
antibody IP/total chromatin - log
2
no antibody IP/total chromatin) > threshold (Figure 2a). Step
5, genes that had at least two probes enriched in a promoter
proximal region were scored as likely targets of HspR (Addi-
tional data file 3).
Sco-Chip
2
-v2 array
Genes/regions considered to be directly controlled by HspR
were first identified using steps 1-4 (see Additional data file 2
and Figure 3) as described above with the following excep-
tions: significant probes were determined by the difference
between log
2
'HspR antibody IP'/'no-antibody IP' and log
2
'HspR pre-immune serum antibody IP'/'no-antibody IP' (step
1); average (across biological replicates) log
2
'HspR antibody
IP'/'no-antibody IP' distribution of significant probes was
plotted (step 2) to determine the threshold (>1.5 on log
2
scale)
of selection (step 3). Then the novel approach, for ChIP-on-
chip analysis, of clustering enriched probes was undertaken
as follows such that identified probe clusters corresponded to
the most likely targets of HspR. Steps 1-4 were as above. Step
5, enriched probes were represented by their corresponding
Genome Biology 2009, Volume 10, Issue 1, Article R5 Bucca et al. R5.12
Genome Biology 2009, 10:R5
position in the genome. A distance matrix was constructed
based on the Euclidean distance between each pair (within
the enriched probes set) of probe positions, when represented
on a log scale. Step 6, the distance matrix was normalized
such that each distance was between 0 and 1 and converted
into a similarity matrix by subtracting each normalized dis-
tance from 1. Thus, probes with a similarity score of 0 are dis-
tant from each other in the genome and probes with a
similarity score close to 1 are near each other in the genome.
Step 7, the similarity matrix was given as input to the cluster-
ing algorithm CAST (Clustering Affinity Search Technique)
[72], which intrinsically calculates the optimal partitioning of
a data set (via addition and removal of members to a cluster
such that the affinity of a cluster remains 'tight') given a cer-
tain threshold. The threshold of 0.5 was used to cluster
probes; this threshold is equivalent to grouping enriched
probes that occur within 2.9 kb of each other in the genome.
Step 8, clusters of size greater than 1 were annotated with
gene names (SCO numbers) and designated as genes/regions
bound by HspR.
The ChIP-on-chip data have been deposited in ArrayExpress
(accession number [E-MAXD-48]).
Nucleotide sequence motif analysis
Identification of putative HspR target sites with HspR consensus
sequence
For each gene identified experimentally as having a putative
HspR binding site, the respective upstream sequence, 300
nucleotides upstream of the translational start codon and 200
nucleotides downstream of the translational start codon, in
the correct transcriptional orientation, was extracted from
the annotated genome file of S. coelicolor. The entire set of
upstream sequences was then aligned independently to the
previously published HspR consensus sequence (5'-
TTGAGYN(7)ACTCAA) [6] using ClustalW [73].
Derivation of a new HspR consensus sequence
The set of upstream sequences representing putative HspR
binding sites was submitted to the MEME (Multiple Em for
Motif Elicitation) server [74,75] using default settings except
for: minimum width of the motif to search for was set to 5
nucleotides and maximum width to 30 nucleotides (to reflect
the common transcription factor recognition site length in
prokaryotes); and maximum number of sites to find was set to
10, to restrict the amount of data obtained.
Quantitative real time PCR analysis of selected differentially
expressed genes
Specific primers and probes for SCO4410, SCO5639,
SCO3202 and SCO4157 were designed using Primer 3 soft-
ware and used for qPCR as described previously [7]. The
sequences for the forward and reverse primers and dual
labeled probes were: SCO4410 forward primer 5'-GTGTCG-
GGCGAACTGG, reverse primer 5'-CCGGGACGCGATGA, and
dual labeled probe 5'-TCTGCGATTCCAGCGGGGTC;
SCO5639 forward primer 5'-ACCATGAAGACGAGAGA-
GAGG, reverse primer 5'-GTGCACGAACACGTCT, and dual
labeled probe 5'-ATGCCGGGCGACGTGCTAAA; SCO3202
forward primer 5'-CTGATCCAGGAGGGCAAC, reverse
primer 5'-GCGTACGTGGAGAACTTGAA, and dual labeled
probe 5'-TCCGCGCGGTCGAGAAGTTC; SCO4157 forward
primer 5'-GACGTACAAGGCGATCCAG, reverse primer 5'-
ATGATGTTGCCGTTCATGTC, and dual labeled probe 5'-
CCCTCAACCCGGGCAACTCC.
Electrophoretic mobility shift assays
Gel-shift assays were conducted using the Light Shift Chemi-
luminescence EMSA kit (Pierce), following the manufac-
turer's instructions. The 3'-biotinylated oligonucleotides
comprising the HspR binding site, IR3 [26] in the promoter
region of the dnaK operon, and similar motifs in the promoter
regions of SCO5639 and SCO4410 were annealed to their
complementary strands and 200 fmol were used in the bind-
ing reaction together with either purified DnaK-refolded
HspR (as described in [61]) or a JM109 E. coli cell extract
over-expressing hspR [26]. In competition experiments a
200-fold excess of the same, but non-biotinylated, DNA was
included in the electrophoretic mobility shift assay reaction.
The dnaK biotinylated probe used in gel shift assays was 5'-
TGCACACTTGAGCCTGTTCCACTCAAGTCAGCTGGAG; the
SCO5639 biotinylated probe was 5'-TCGGATTGGAAT-
TACTAAGATTCAGGATGCAGCACGCATCGT and the
SCO4410 biotinylated probe was 5'-CGTTTCGGGTGAATC-
CCGAAAATTCCAGACGTTCCGACGAGG.
Abbreviations
ChIP-on-chip: chromatin immunoprecipitation-on-chip;
Cy3: cyanine-3 dye; Cy5: cyanine-5 dye; IP: immunoprecipi-
tation; IJISS: ink-jet in situ-synthesized; MEME: Maximum
Em for Motif Elicitation; pfp: probability of false prediction;
qPCR: quantitative real time PCR.
Authors' contributions
GB performed the microbiological and molecular biology
work, including most of the ChIP method development and
microarray-based experiments. EL participated in the array
design, developed the new ChIP-chip data clustering method,
conducted the microarray data/sequence analysis and other
statistical studies. VM and DH contributed to microarray val-
idation and method development. NA contributed to method
development. JH, VB and MH conducted the probe design,
final probe selection and co-ordinated microarray fabrica-
tion. MH co-ordinated the array design activities of Oxford
Gene Technology Ltd. CPS conceived of the study and partic-
ipated in its design and coordination. GB, EL and CPS wrote
the manuscript.
Genome Biology 2009, Volume 10, Issue 1, Article R5 Bucca et al. R5.13
Genome Biology 2009, 10:R5
Additional data files
The following additional data are available with the online
version of this paper. Additional data file 1 illustrates the dis-
tribution of significant probes from Sco-Chip
2
-v1 arrays.
Additional data file 2 illustrates the distribution of significant
probes from Sco-Chip
2
-v2 arrays. Additional data file 3 illus-
trates probe signals across significantly scoring HspR target
regions using the Sco-Chip
2
-v1 array. Additional data file 4
tabulates genes significantly up-regulated following heat-
shock at 42°C. Additional data file 5 lists the genes up-regu-
lated in an hspR disruption mutant. Additional data file 6
illustrates the partial matches to the HspR-binding consensus
sequence within the five tRNA
Gln/Glu
cluster. Additional data
file 7 details the motif identified from MEME analysis of the
HspR targets identified with the Sco-Chip
2
-v2 array. Addi-
tional data file 8 tabulates amino acid composition of heat-
shock-induced gene products relative to all annotated pro-
teins. Additional data file 9 details qPCR expression data for
selected heat induced genes. Additional data file 10 shows the
qPCR expression data for SCO4410 and SCO5639. Additional
data file 11 shows the comparison of heat shock expression
data in SMMS and YEME cultures. Additional file 12 lists
probes found to be significantly enriched for HspR on Sco-
Chip
2
-v1 arrays. Additional file 13 lists probes found to be sig-
nificantly enriched for HspR on Sco-Chip
2
-v2 arrays. Addi-
tional data file 14 shows an enlarged image of Figure 3d.
Additional data file 15 shows an enlarged image of Figure 3e.
Additional data file 1Distribution of significant probe signals from Sco-Chip
2
-v1 arraysAverage (across biological replicates) plotted as [log
2
Antibody bound/Total chromatin - log
2
'No Antibody' bound/Total chroma-tin]. The red line indicates the threshold applied to identify enriched probes.Click here for fileAdditional data file 2Distribution of significant probe signals from Sco-Chip
2
-v2 arraysAverage (across biological replicates) plotted as [log
2
Antibody bound/'No Antibody' bound]. The red line indicates the threshold applied to identify enriched probes.Click here for fileAdditional data file 3Probe signals across significantly scoring HspR target regions using the Sco-Chip
2
-v1 arrayThe anti-HspR-enriched probes are plotted on a linear scale. Open circles indicate the start co-ordinate (relative to genome sequence) of each probe that passed quality control filtering. The genetic organization of each region is indicated below the plot; each arrow represents a coding sequence or stable RNA gene as defined in [EMBL:AL645882.2].Click here for fileAdditional data file 4The heat shock-stimulon of S. coelicolorTabulation of genes significantly up-regulated following heat-shock at 42°C.Click here for fileAdditional data file 5Genes up-regulated in an hspR disruption mutantTabulation of genes significantly up-regulated in an hspR disrup-tion mutant relative to wild-type.Click here for fileAdditional data file 6Partial matches to the HspR-binding consensus sequence within the five tRNA
Gln/Glu
clusterPartial matches to the HspR-binding consensus sequence within the five tRNA
Gln/Glu
cluster.Click here for fileAdditional data file 7Motif identified from MEME analysis of the HspR targets identified with Sco-Chip
2
-v2 arrayMotif identified from MEME analysis of the HspR targets identified with the Sco-Chip
2
-v2 array.Click here for fileAdditional data file 8Over-representation of amino acids in heat-shock-induced gene products relative to all annotated proteins from the S. coelicolor genomeOver-representation of amino acids in heat-shock induced gene products (listed in Additional data file 4) relative to all annotated proteins from the S. coelicolor genome [EMBL: AL645882.2].Click here for fileAdditional data file 9Quantitative real time PCR verification of expression of selected heat-induced genesSCO3202 (hrdD) and SCO4157 had respective rank products pfp values of 0.12 and 0.13. SCO4410 and SCO5639 were identified as new putative targets for HspR. Average values are plotted from the same two independent biological replicates of each condition used in the array-based expression analysis.Click here for fileAdditional data file 10Quantitative real time PCR assessment of expression of SCO4410 and SCO5639 in hspR disruption mutantsAverage values are plotted from the same two independent biolog-ical replicates of each condition used in the array-based expression analysis.Click here for fileAdditional data file 11Comparison of expression of heat-shock genes from SMMS sur-face-grown cultures in YEME+10.3% sucrose liquid culturesComparison of expression of heat-shock genes from SMMS sur-face-grown cultures (Additional data file 4) in YEME+10.3% sucrose liquid cultures (as used in ChIP-on-chip experiments).Click here for fileAdditional data file 12Probes found to be significantly enriched for HspR on Sco-Chip
2
-v1 arraysProbes found to be significantly enriched for HspR on Sco-Chip
2
-v1 arrays.Click here for fileAdditional data file 13Probes found to be significantly enriched for HspR on Sco-Chip
2
-v2 arraysProbes found to be significantly enriched for HspR on Sco-Chip
2
-v2 arrays.Click here for fileAdditional data file 14An enlarged image of Figure 3d (rrnD data)An enlarged image of Figure 3d (rrnD data), with a dotted line along log ratio of 0.Click here for fileAdditional data file 15An enlarged image of Figure 3e (tRNA cluster data)An enlarged image of Figure 3e (tRNA cluster data), with a dotted line along log ratio of 0.Click here for file
Acknowledgements
We thank David Grainger and David Hodgson for helpful discussions and
David Hodgson for contributions to method development. We thank the
anonymous reviewers for constructive comments. This work was funded
by the BBSRC (grants G18886 to CPS and BBD0115821 to A Kierzek, CPS,
M Bushell and C Avignone-Rossa) and the European Commission (FP6 Pro-
gramme, ActinoGEN IP005224 to CPS).
References
1. Elliot MA, Buttner MJ, Nodwell JR: Multicellular development in
Streptomyces. In Myxobacteria: Multicellularity and Differentiation
Edited by: Whitworth DE. Washinton DC: ASM Press; 2008:419-439.
2. Bibb MJ: Regulation of secondary metabolism in streptomyc-
etes. Curr Opin Microbiol 2005, 8:208-215.
3. Challis GL, Hopwood DA: Synergy and contingency as driving
forces for the evolution of multiple secondary metabolite
production by Streptomyces species. Proc Natl Acad Sci USA
100:14555-14561.
4. Bentley SD, Chater KF, Cerdeño-Tárraga AM, Challis GL, Thomson
NR, James KD, Harris DE, Quail MA, Kieser H, Harper D, Bateman
A, Brown S, Chandra G, Chen CW, Collins M, Cronin A, Fraser A,
Goble A, Hidalgo J, Hornsby T, Howarth S, Huang CH, Kieser T,
Larke L, Murphy L, Oliver K, O'Neil S, Rabbinowitsch E, Rajandream
MA, Rutherford K, et al.: Complete genome sequence of the
model actinomycete Streptomyces coelicolor A3(2). Nature
2002, 417:141-147.
5. Huang J, Lih CJ, Pan KH, Cohen SN: Global analysis of growth
phase responsive gene expression and regulation of antibi-
otic biosynthetic pathways in Streptomyces coelicolor using
DNA microarrays. Genes Dev 2001, 15:3183-3192.
6. Bucca G, Brassington AM, Hotchkiss G, Mersinias V, Smith CP: Neg-
ative feedback regulation of dnaK, clpB and lon expression by
the DnaK chaperone machine in Streptomyces coelicolor,
identified by transcriptome and in vivo DnaK-depletion anal-
ysis. Mol Microbiol 2003, 50:153-166.
7. Hesketh A, Bucca G, Laing E, Flett F, Hotchkiss G, Smith CP, Chater
KF: New pleiotropic effects of eliminating a rare tRNA from
Streptomyces coelicolor, revealed by combined proteomic
and transcriptomic analysis of liquid cultures. BMC Genomics
2007, 8:261.
8. Borodina I, Krabben P, Nielsen J: Genome-scale analysis of Strep-
tomyces coelicolor A3(2) metabolism.
Genome Res 2005,
15:820-829.
9. The Streptomyces coelicolor Microarray Resource [http://
www.surrey.ac.uk/SBMS/Fgenomics/Microarrays/]
10. Wade JT, Struhl K, Busby SJ, Grainger DC: Genomic analysis of
protein-DNA interactions in bacteria: insights into transcrip-
tion and chromosome organization. Mol Microbiol 2007,
65:21-26.
11. Eichenberger P, Fujita M, Jensen ST, Conlon EM, Rudner DZ, Wang
ST, Ferguson C, Haga K, Sato T, Liu JS, Losick R: The program of
gene transcription for a single differentiating cell type during
sporulation in Bacillus subtilis. PLoS Biol 2004, 2:e328.
12. Grainger DC, Hurd D, Harrison M, Holdstock J, Busby SJ: Studies of
the distribution of Escherichia coli cAMP-receptor protein
and RNA polymerase along the E. coli chromosome. Proc Natl
Acad Sci USA 2005, 102:17693-17698.
13. Grainger DC, Hurd D, Goldberg MD, Busby SJ: Association of
nucleoid proteins with coding and non-coding segments of
the Escherichia coli genome. Nucleic Acids Res 2006,
34:4642-4652.
14. Grainger DC, Aiba H, Hurd D, Browning DF, Busby SJ: Transcrip-
tion factor distribution in Escherichia coli: studies with FNR
protein. Nucleic Acids Res 2007, 35:269-278.
15. Lucchini S, Rowley G, Goldberg MD, Hurd D, Harrison M, Hinton JC:
H-NS mediates the silencing of laterally acquired genes in
bacteria. PLoS Pathog 2006, 2:e81.
16. Kültz D: Molecular and evolutionary basis of the cellular
stress response. Annu Rev Physiol 2005, 67:225-257.
17. Bukau B, Weissman J, Horwich A: Molecular chaperones and
protein quality control. Cell 2006, 125:443-451.
18. Genevaux P, Georgopoulos C, Kelley WL:
The Hsp70 chaperone
machines of Escherichia coli: a paradigm for the repartition of
chaperone functions. Mol Microbiol 2007, 66:840-857.
19. Narberhaus F: Negative regulation of bacterial heat shock
genes. Mol Microbiol 1999, 31:1-8.
20. Yura T, Nagai H, Mori H: Regulation of the heat-shock response
in bacteria. Annu Rev Microbiol 1993, 47:321-350.
21. Alba BM, Gross CA: Regulation of the Escherichia coli sigma-
dependent envelope stress response. Mol Microbiol 2004,
52:613-619.
22. Servant P, Mazodier P: Negative regulation of the heat shock
response in Streptomyces. Arch Microbiol 2001, 176:237-242.
23. Servant P, Rapoport G, Mazodier P: RheA repressor of hsp18 in
Streptomyces albus G. Microbiology 1999, 145:2385-2391.
24. Servant P, Grandvalet C, Mazodier P: The RheA repressor in the
thermosensor of the HSP18 heat shock response in Strepto-
myces albus. Proc Natl Acad Sci U S A 2000, 97:3538-3543.
25. Grandvalet C, Servant P, Mazodier P: Disruption of hspR, the
repressor gene of the dnaK operon in Streptomyces albus G.
Mol Microbiol 1997, 23:77-84.
26. Bucca G, Ferina G, Puglia AM, Smith CP: The dnaK operon of
Streptomyces coelicolor encodes a novel heat-shock protein
which binds to the promoter region of the operon. Mol Micro-
biol 1995, 17:663-674.
27. Bucca G, Hindle Z, Smith CP: Regulation of the dnaK operon of
Streptomyces coelicolor
A3(2) is governed by HspR, an
autoregulatory repressor protein. J Bacteriol 1997,
179:5999-6004.
28. Stewart GR, Wernisch L, Stabler R, Mangan JA, Hinds J, Laing KG,
Young DB, Butcher PD: Dissection of the heat-shock response
in Mycobacterium tuberculosis using mutants and microar-
rays. Microbiology 2002, 148:3129-3138.
29. Engels S, Schweitzer JE, Ludwig C, Bott M, Schaffer S: clpC and
clpP1P2 gene expression in Corynebacterium glutamicum is
controlled by a regulatory network involving the transcrip-
tional regulators ClgR and HspR as well as the ECF sigma
factor sigmaH. Mol Microbiol 2004, 52:285-302.
30. Spohn G, Scarlato V: The autoregulatory HspR repressor pro-
tein governs chaperone gene transcription in Helicobacter
pylori. Mol Microbiol 1999, 34:663-674.
31. Spohn G, Danielli A, Roncarati D, Delany I, Rappouli R, Scarlato V:
Dual control of Helicobacter pylori heat shock gene transcrip-
Genome Biology 2009, Volume 10, Issue 1, Article R5 Bucca et al. R5.14
Genome Biology 2009, 10:R5
tion by HspR and HrcA. J Bacteriol 2004, 186:2956-2965.
32. Roncarati D, Danielli A, Spohn G, Delany I, Scarlato V: Transcrip-
tional regulation of stress response and motility functions in
Helicobacter pylori is mediated by HspR and HrcA. J Bacteriol
2007, 189:7234-7243.
33. Schmid AK, Howell HA, Battista JR, Peterson SN, Lidstrom ME:
HspR is a global negative regulator of heat shock gene
expression in Deinococcus radiodurans. Mol Microbiol 2005,
55:1579-1590.
34. Ventura M, Kenny JG, Zhang Z, Fitzgerald GF, van Sinderen D: The
clpB gene of Bifidobacterium breve UCC 2003: transcriptional
analysis and first insights into stress induction. Microbiology
2005, 151:2861-2872.
35. Andersen MT, Brøndsted L, Pearson BM, Mulholland F, Parker M, Pin
C, Wells JM, Ingmer H: Diverse roles for HspR in Campylobacter
jejuni revealed by the proteome, transcriptome and pheno-
typic characterization of an hspR mutant. Microbiology 2005,
151:905-915.
36. Laing E, Mersinias V, Smith CP, Hubbard SJ: Analysis of gene
expression in operons of Streptomyces coelicolor. Genome Biol
2006, 7:R46.
37. Breitling R, Armengaud P, Amtmann A, Herzyk P: Rank products: a
simple, yet powerful, new method to detect differentially
regulated genes in replicated microarray experiments. FEBS
Lett 2004, 573:83-92.
38. Van Keulen G, Hopwood DA, Dijkhuizen L, Sawers RG: Gas vesicles
in actinomycetes: old buoys in novel habitats? Trends Microbiol
2005, 13:350-354.
39. Hong HJ, Paget MS, Buttner MJ: A signal transduction system in
Streptomyces coelicolor that activates the expression of a
putative cell wall glycan operon in response to vancomycin
and other cell wall-specific antibiotics. Mol Microbiol 2002,
44:1199-1211.
40. Finn RD, Mistry J, Schuser-Böckler B, Griffiths-Jones S, Hollich V,
Lassmann T, Moxon S, Marshall M, Khanna A, Durbin R, Eddy SR, Son-
nhammer ELL, Bateman A: Pfam: clans, web tools and services.
Nucleic Acids Res 2006, 34:D247-D251.
41. SIB Blast Network Service [ />42. Altschul SF, Madden TL, Schäffer AA, Zhang J, Zhang Z, Miller W, Lip-
man DJ: Gapped BLAST and PSI-BLAST: a new generation of
protein database search programs. Nucleic Acids Res 1997,
25:3389-3402.
43. Fox DS, Cox GM, Heitman J: Phospholipid-binding protein Cts1
controls septation and functions coordinately with cal-
cineurin in Cryptococcus neoformans. Eukaryot Cell 2003,
2:1025-1035.
44. Regulatory Sequence Analysis Tools [ />45. van Helden J: Regulatory sequence analysis tools. Nucleic Acids
Res 2003, 31:3593-3596.
46. Hartl FU, Hayer-Hartl M: Molecular chaperones in the cytosol:
from nascent chain to folded protein. Science 2002,
295:1852-1858.
47. de León P, Mellado R: Ribosomal RNA synthesis in Streptomyces
lividans under heat shock conditions. Gene 1997, 194:125-132.
48. Newlands JT, Gaal T, Mecsas J, Gourse RL: Transcription of the
Escherichia coli rrnB P1 promoter by the Heat shock RNA
Polymerase (Eσ
32
) in vitro. J Bacteriol 1993, 175:661-668.
49. Kim HL, Shin EK, Kim HM, Ryou SM, Kim S, Cha CJ, Bae J, Lee K:
Heterogeneous rRNAs are differentially expressed during
the morphological development of Streptomyces coelicolor.
FEMS Microbiol Lett 2007, 275:146-152.
50. Blanco G, Rodicio MR, Puglia AM, Méndez C, Thompson CJ, Salas JA:
Synthesis of ribosomal proteins during growth of Streptomy-
ces coelicolor. Mol Microbiol 1994, 12:375-385.
51. Hahn MY, Roe J-H: Partial purification of factors for differential
transcription of the rrnD promoters for ribosomal RNA syn-
thesis in Streptomyces coelicolor. J Microbiol 2007, 45:534-540.
52. Feng L, Sheppard K, Namgoong S, Ambrogelly A, Polycarpo C,
Randau L, Tumbula-Hansen D, Söll D: Aminoacyl-tRNA synthesis
by pre-translational amino acid modification. RNA Biol 2004,
1:16-20.
53. Cashel M, Gentry V, Hernandez VJ, Vinella D: The stringent
response. In Escherichia coli and Salmonella Cellular and Molecular Biol-
ogy Volume 1. 2nd edition. Edited by: Neidhardt FC, Curtiss R. Wash-
ington DC: ASM Press; 1996:1458-1496.
54. Levicán G, Katz A, Valenzuela P, Söll D, Orellana O: A tRNA
Glu
that
uncouples protein and tetrapyrrole biosynthesis. FEBS Lett
2005, 579:6383-6387.
55. Jahn D, Verkamp E, Söll D: Glutamyl-transfer RNA; a precursor
of heme and chlorophyll biosynthesis. Trends Biochem Sci 1992,
17:215-218.
56. Farias ST, Bonato MC: Preferred amino acids and thermostabil-
ity. Genet Mol Res 2003, 2:383-393.
57. Hindle Z, Smith CP: Substrate induction and catabolite repres-
sion of the Streptomyces coelicolor glycerol operon are medi-
ated through the GylR protein. Mol Microbiol 1994, 12:737-745.
58. Kieser T, Bibb MJ, Buttner MJ, Chater KF, Hopwood DA: Practical
Streptomyces Genetics Norwich: John Innes Centre; 2000.
59. Grainger DC, Overton TW, Reppas N, Wade JT, Tamai E, Hobman
JL, Constantinidou C, Struhl K, Church G, Busby SJ: Genomic stud-
ies with Escherichia coli MelR protein: applications of chro-
matin immunoprecipitation and microarrays. J Bacteriol 2004,
186:6938-6943.
60. McKenzie NL, Nodwell JR: Phosphorylated AbsA2 negatively
regulates antibiotic production in Streptomyces coelicolor
through interactions with pathway-specific regulatory gene
promoters. J Bacteriol 2007, 189:5284-5292.
61. Bucca G, Brassington AM, Schönfeld HJ, Smith CP: The HspR regu-
lon of Streptomyces coelicolor: a role for the DnaK chaperone
as a transcriptional corepressor. Mol Microbiol 2000,
38:1093-1103.
62. University of Surrey Streptomyces Microarray Hybridisation
Protocol [ />docs/Strep_hyb_protocol_1005.pdf]
63. Buck MJ, Lieb JD: ChIP-chip: considerations for the design,
analysis, and application of genome-wide chromatin immu-
noprecipitation experiments. Genomics 2004, 83:349-360.
64. Smyth GK, Speed TP: Normalization of cDNA microarray data.
Methods 2003, 31:265-273.
65. Gentleman RC, Carey VJ, Bates DM, Bolstad B, Dettling M, Dudoit S,
Ellis B, Gautier L, Ge Y, Gentry J, Hornik K, Hothorn T, Huber W,
Iacus S, Irizarry R, Leisch F, Li C, Maechler M, Rossini AJ, Sawitzki G,
Smith C, Smyth G, Tierney L, Yang JY, Zhang J: Bioconductor: open
software development for computational biology and bioin-
formatics. Genome Biol 2004, 5:R80.
66. R []
67. R Development Core Team: R: a Language and Environment for Statis-
tical Computing Austria: R Foundation for Statistical Computing:
Vienna; 2005.
68. Hong F, Breitling R, McEntee CW, Wittner BS, Nemhauser JL, Chory
J: RankProd: a Bioconductor package for detecting differen-
tially expressed genes in meta-analysis. Bioinformatics 2006,
22:2825-2827.
69. Jeffery IB, Desmond GH, Culhane AC: Comparison and evalua-
tion of methods for generating differentially expressed gene
lists from microarray data. BMC Bioinformatics 2006, 7:359.
70. Hong F, Breitling R: A comparison of meta-analysis methods
for detecting differentially expressed genes in microarray
experiments. Bioinformatics 2008, 24:374-382.
71. Benjamini Y, Hochberg Y: Controlling the false discovery rate: a
practical and powerful approach to multiple testing. J R Stat
Soc 1999, 57:289-300.
72. Ben-Dor A, Shamir R, Yakhini Z: Clustering gene expression pat-
terns. J Comput Biol 1999, 6:281-297.
73. Larkin MA, Blackshields G, Brown NP, Chenna R, McGettigan PA,
McWilliam H, Valentin F, Wallace IM, Wilm A, Lopez R, Thompson
JD, Gibson TJ, Higgins DG: Clustal W and Clustal X version 2.0.
Bioinformatics 2007, 23:2947-2948.
74. MEME [ />75. Bailey TL, Elkan C: Fitting a mixture model by expectation
maximization to discover motifs in biopolymers. In Proceed-
ings of the Second International Conference on Intelligent Systems for
Molecular Biology: August 14-17, 1994; Stanford, California Edited by:
Altman R, Brutlag D, Karp P, Lathrop R, Searls D. Menlo Park, CA:
AAAI Press; 1994:28-36.
76.
WebLogo [ />77. Crooks GE, Hon G, Chandonia JM, Brenner SE: WebLogo: a
sequence logo generator. Genome Res 2004, 14:1188-1190.