Báo cáo y học: "A genome-wide genetic signature of Jewish ancestry perfectly separates individuals with and without full Jewish ancestry in a large random sample of European Americans" potx
Bạn đang xem bản rút gọn của tài liệu. Xem và tải ngay bản đầy đủ của tài liệu tại đây (555.61 KB, 7 trang )
Genome Biology 2009, 10:R7
Open Access
2009Needet al.Volume 10, Issue 1, Article R7
Research
A genome-wide genetic signature of Jewish ancestry perfectly
separates individuals with and without full Jewish ancestry in a large
random sample of European Americans
Anna C Need, Dalia Kasperavičiūtė, Elizabeth T Cirulli and
David B Goldstein
Address: Center for Human Genome Variation, Institute for Genome Sciences and Policy, Research Drive, Duke University, Durham, NC 27708,
USA.
Correspondence: David B Goldstein. Email:
© 2009 Need et al.; licensee BioMed Central Ltd.
This is an open access article distributed under the terms of the Creative Commons Attribution License ( which
permits unrestricted use, distribution, and reproduction in any medium, provided the original work is properly cited.
Genomes and Jewish ancestry<p>A principal components analysis of genomic information showed that individuals with full Jewish ancestry formed a clearly distinct cluster from those individuals with no Jewish ancestry.</p>
Abstract
Background: It was recently shown that the genetic distinction between self-identified Ashkenazi
Jewish and non-Jewish individuals is a prominent component of genome-wide patterns of genetic
variation in European Americans. No study however has yet assessed how accurately self-identified
(Ashkenazi) Jewish ancestry can be inferred from genomic information, nor whether the degree of
Jewish ancestry can be inferred among individuals with fewer than four Jewish grandparents.
Results: Using a principal components analysis, we found that the individuals with full Jewish
ancestry formed a clearly distinct cluster from those individuals with no Jewish ancestry. Using the
position on the first principal component axis, every single individual with self-reported full Jewish
ancestry had a higher score than any individual with no Jewish ancestry.
Conclusions: Here we show that within Americans of European ancestry there is a perfect
genetic corollary of Jewish ancestry which, in principle, would permit near perfect genetic inference
of Ashkenazi Jewish ancestry. In fact, even subjects with a single Jewish grandparent can be
statistically distinguished from those without Jewish ancestry. We also found that subjects with
Jewish ancestry were slightly more heterozygous than the subjects with no Jewish ancestry,
suggesting that the genetic distinction between Jews and non-Jews may be more attributable to a
Near-Eastern origin for Jewish populations than to population bottlenecks.
Background
Many genetic and non-genetic lines of evidence make clear
that there are differences amongst the Jewish and non-Jew-
ish peoples of Europe. There are both specific genetic diseases
(for example, Tay-Sachs) and particular mutations (for exam-
ple, the breast cancer BRCA1 185delAG mutation) that have
considerably higher incidences in Jewish populations, and
both Y chromosome and mitochondrial DNA lineages show
associations with Jewish heritage [1-5]. No study, however,
has directly addressed the question of whether Jewish indi-
viduals form a consistently identifiable group on the basis of
genetic data alone, as has been documented for other racial/
Published: 22 January 2009
Genome Biology 2009, 10:R7 (doi:10.1186/gb-2009-10-1-r7)
Received: 19 September 2008
Revised: 16 December 2008
Accepted: 22 January 2009
The electronic version of this article is the complete one and can be
found online at /> Genome Biology 2009, Volume 10, Issue 1, Article R7 Need et al. R7.2
Genome Biology 2009, 10:R7
ethnic groups [6]. Recently, Price et al. [7] showed that self-
described Jewish ancestry was a major determinant of popu-
lation genetic structure in European populations, but they did
not address the question of whether genetic data might be
able to accurately identify which individuals do and do not
have Jewish ancestry. Here we investigate whether it is possi-
ble to accurately infer the degree of Jewish ancestry using
only an individual's genomic information.
To address this, we considered a random sample of 611 unre-
lated self-described Caucasian subjects mostly residing in
America who specifically reported whether they had Jewish
ancestry, and if so, how many grandparents were 'Jewish'. All
individuals were genotyped for approximately 550,000 poly-
morphic markers and we applied a principal-component-
based method to describe the population genetic structure [8]
of the sample. Out of the 611 subjects, 507 reported no Jewish
ancestry, 55 reported 4 Jewish grandparents, 4 reported 3
Jewish grandparents, 37 reported 2 Jewish grandparents and
8 reported 1 Jewish grandparent. Of these, 23 reported that
they were Ashkenazim, one reported four Sephardic grand-
parents, two reported three Ashkenazi and one Sephardic
grandparent, and two reported two Sephardic grandparents.
A further 62 provided European or Russian country-of-origin
information for at least one grandparent and 14 were able to
give no more information than 'European-American'.
Results
Our first test was to assess how accurately individuals with
full Jewish ancestry (all four grandparents) could be distin-
guished from those with no Jewish ancestry using the score
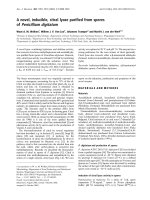
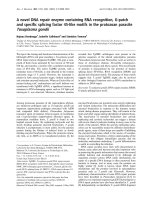
on the first principal component axis (PC1). We found that the
individuals with full Jewish ancestry formed a clearly distinct
cluster from those individuals with no Jewish ancestry (Fig-
ure 1). Strikingly, if we look only at the position on the first
PC1 scores for Jewish and non-Jewish subjectsFigure 1
PC1 scores for Jewish and non-Jewish subjects. The score on PC1 plotted against the score on PC2 for Jewish (blue) and non-Jewish (red) subjects.
Genome Biology 2009, Volume 10, Issue 1, Article R7 Need et al. R7.3
Genome Biology 2009, 10:R7
principal component, in this dataset, every single individual
with self-reported full Jewish ancestry has a higher score than
any individual with no Jewish ancestry. Interestingly, for the
two subjects that appear intermediate between the clear 'Jew-
ish' and 'Non-Jewish' clusters, one of them reports two Jew-
ish grandparents of Sephardic origin, and one declares full
Jewish ancestry, but without country of origin for their grand-
parents. These analyses imply the possibility of perfect or
near perfect resolution of full Jewish ancestry using only
genetic data. We should note, however, that if one were to
attempt inference about Jewish ancestry it would be neces-
sary to have a 'training set' such as that described here to
determine the appropriate divisions between individuals with
and without Jewish ancestry since the 'clusters' fall next to
each other. This implies that, in practice, resolution of full
Jewish ancestry would likely be less than perfect, but that the
fact that we observed non-overlapping distributions on the
first principle component implies that both specificity and
sensitivity would be high.
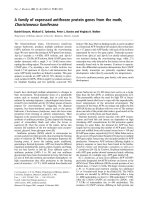
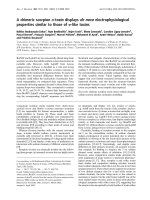
We went on to assess whether participants with one, two or
three Jewish grandparents could be statistically distin-
guished from one another and from individuals with either
full or no Jewish ancestry. As expected, most of these subjects
were positioned in between the non-Jewish and the full-Jew-
ish subjects on PC1 (Figure 2).
All but two (36/37) of the subjects with two Jewish parents
scored between 0.03 and 0.08 on PC1, all four subjects with
three Jewish grandparents scored between 0.08 and 0.1 on
PC1, and 496/507 subjects declaring no Jewish ancestry
scored below 0.3. The subjects with only one Jewish grand-
parent were not distinguishable based on PC1 position. The
subjects that did not score within the expected range for their
self-declared ancestry are shown in Table 1, along with their
ancestral information where known. The majority of inform-
ative subjects with no Jewish ancestry that scored most highly
on PC1 were either of Italian or Eastern Mediterranean
descent. This indicates that in a mixed American context,
these populations may not be easily distinguishable from sub-
jects with a single Jewish parent.
Finally, we used one-way ANOVA to determine which groups
were significantly different by PC1 score from non-Jewish
subjects. We found that all four groups with Jewish ancestry
were significantly different, on average, from those with no
Jewish ancestry: 4 versus 0 grandparents, p = 8.5 × 10
-256
; 3
versus 0, p = 4.77 × 10
-41
; 2 versus 0, p = 6.8 × 10
-96
; 1 versus
PC1 versus PC2 for people with or without Jewish ancestryFigure 2
PC1 versus PC2 for people with or without Jewish ancestry. The score on PC1 plotted against the score on PC2 for people with four, three, two, one and
no Jewish grandparents.
Genome Biology 2009, Volume 10, Issue 1, Article R7 Need et al. R7.4
Genome Biology 2009, 10:R7
0, p = 7.8 × 10
-10
. This shows that even with only a single Jew-
ish grandparent there remains a statistically definable signa-
ture of Jewish ancestry amongst Americans of European
ancestry, although the perfect genetic discrimination of Jew-
ish versus non-Jewish ancestry present in comparing full
Jewish to no Jewish ancestry is lost at an individual level.
To address the question of whether this axis may not be pre-
dicting Jewish, but rather (contemporary) Middle Eastern
ancestry, we used the genome-wide single nucleotide poly-
morphism (SNP) data from the CEPH Human Genome Diver-
sity Panel [9]. We added to our European-Americans nine
other populations reflecting North Europe (Orcadian, n = 15;
Central Europe (French, n = 28; French-Basque, n = 24;
Northern Italian, n = 12); Southern Europe (Tuscan, n = 8;
Sardinian, n = 28); and Eastern Europe (Russian, n = 25;
Adygei, n = 17, an ethnic group of the Russian Caucasus). We
also included Palestinian (n = 46), Druze (n = 42) and
Bedouin (n = 45) samples as groups that might be similar to
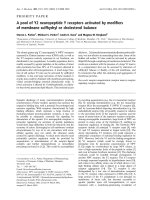
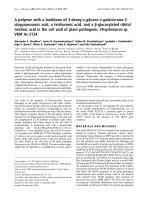
ancestral Jewish 'source' populations [10]. We found that the
Middle Eastern populations clustered separately from the
European and European-American populations, as expected,
and the subjects with four Jewish grandparents clustered
close to (but separate from) the Adygei and lay between the
Middle Eastern and the European and European-American
populations (Figure 3). This is an important finding for a
number of reasons. Firstly, the Jewish subjects remain in a
separate cluster when mixed with both European and Middle
Eastern populations, suggesting that the original principal
component axis seen in the European-Americans is indeed a
Jewish-specific axis, at least in the context of the populations
considered here. Secondly, the Jewish cluster lies approxi-
mately midway between the European and the Middle East-
ern clusters, implying that the Ashkenazi Jews may contain
mixed ancestry from these two regions. This is consistent
with the Y chromosome and mitochondrial DNA genetic evi-
dence that has been interpreted by some to suggest a stronger
paternal genetic heritage of Jewish populations from the Mid-
dle East and stronger maternal genetic heritage from the host
populations of the Diaspora [10]. Finally, the proximity of the
Jewish cluster to the Adygei is of interest, but the small sam-
ple size of the Adygei and sparse availability of Central Asian
populations makes interpretation of this proximity difficult.
Discussion
These analyses make clear that individuals with full Jewish
ancestry are a genetically distinct group from those having no
(self-reported) Jewish ancestry. Of the subjects that self-iden-
tified as Jewish and knew their type, almost all were Ashkena-
zim. Of the Jewish subjects that did not know their type but
could provide information on grandparent country of origin,
the vast majority had Eastern or Central European ancestry,
and none had Mediterranean or Middle Eastern ancestry.
Finally, one of the two subjects reporting partial Sephardic
ancestry did not cluster clearly with the other Jewish subjects.
Considering also that 90% of American Jews are Ashkenazim
[3], we conclude that this axis is specific to Ashkenazi Jews,
and that we cannot make any conclusions about other types of
American Jews (for example, Sephardic, Mizrahi) from these
data.
Table 1
Subjects that did not score within the PC1 range expected for their self-declared Jewish ancestry group
Jewish grandparents Expected score on PC1 Actual score on PC1 Maternal GM Maternal GF Paternal GM Paternal GF
4 0.09-0.12 0.07 UK* Unknown* USA* USA*
0.06 E. Europe E. Europe Unknown Unknown
2 0.03-0.08 0.11 USA USA USA USA
-0.02 UK
†
UK
†
Russia
†
Russia
†
0 <0.03 0.054 Italy Italy USA USA
0.049 E. Med. E. Med. USA E. Med.
0.048 USA USA Unknown Unknown
0.045 E. Med.
‡
E. Med.
‡
E. Med.
‡
E. Med.
‡
0.045 USA USA Italy Italy
0.049 E. Med. USA USA USA
0.043 W. Europe
§
W. Europe
§
W. Europe
§
W. Europe
§
0.041 Unknown Scandinavia W. Europe W. Europe
0.038 USA USA USA USA
0.032 USA USA USA USA
0.032 Italy Italy Italy Italy
*Two of the grandparents are Sephardic Jews rather than Ashkenazi.
†
Country of origin is USA; UK/Russia indicates ancestry.
‡
Specific countries not
listed to prevent identification of subject, here Eastern Mediterranean indicates either Cyprus, Albania, Lebanon or Turkey;
§
No further details
known. E., east; Med. Mediterranean; W., west.
Genome Biology 2009, Volume 10, Issue 1, Article R7 Need et al. R7.5
Genome Biology 2009, 10:R7
This leaves open the question, however, of why Americans of
Jewish ancestry are a distinct group. There are two extreme
possibilities: either the Jewish group reflects ancestry from
source populations other than those of non-Jewish Ameri-
cans; or Jewish populations have undergone bottlenecks that
change their genetic makeup.
These possibilities can be distinguished to a degree by com-
paring the position of the full Ashkenazi Jewish cluster to a
series of geographically distributed populations represented
by the human genome diversity panel [9]. We found that the
full Jewish cluster fell between that of Middle Eastern and
European populations. We also compared the average heter-
ozygosity across the set of linkage disequilibrium-pruned pol-
ymorphisms in those with full Jewish ancestry to those
without, and found that the subjects with four Jewish grand-
parents were, on average, slightly more heterozygous than the
subjects with no Jewish ancestry. These data therefore sug-
gest that the Jewish group is distinguished from non-Jewish
Europeans more because of their genetic heritage in the Near
East than due to population bottlenecks perturbing the
genetic composition of Jewish groups.
Conclusion
We show that, at least in the context of the studied sample, it
is possible to predict full Ashkenazi Jewish ancestry with
100% sensitivity and 100% specificity, although it should be
noted that the exact dividing line between a Jewish and non-
Jewish cluster will vary across sample sets, which, in practice,
would reduce the accuracy of the prediction. While the full
historical demographic explanations for this distinction
remain to be resolved, it is clear that the genomes of individ-
uals with full Ashkenazi Jewish ancestry carry an unambigu-
ous signature of their Jewish heritage, and this seems more
likely to be due to their specific Middle Eastern ancestry than
to inbreeding.
Materials and methods
Self-described race/ethnicity
The subjects were initially asked to check one of the following
racial/ethnic labels: African, African-American, Caucasian,
Hispanic, Native American, Middle Eastern/Central Asian,
East Asian, South Asian, and Pacific Islander. They were also
asked to write down the country of origin of all four grandpar-
ents. Following these categorizations the subjects were also
asked if any of their grandparents were Jewish, and if so, to
indicate which type (with Ashkenazi and Sephardic provided
as examples). Only Caucasian subjects were selected for anal-
PC1 versus PC2 of Eigenstrat analysis including European and Middle Eastern subjects from the CEPH Diversity PanelFigure 3
PC1 versus PC2 of Eigenstrat analysis including European and Middle Eastern subjects from the CEPH Diversity Panel. Subjects with one, two or three
Jewish grandparents were excluded. Four subjects with outlying scores were excluded for better visualization of the remaining data points: a Bedouin at -
0.2776,0.2012; and three Mozabites at -0.2608,0.1952; -0.2265,0.1621; -0.1611,0.1314.
Genome Biology 2009, Volume 10, Issue 1, Article R7 Need et al. R7.6
Genome Biology 2009, 10:R7
ysis, and country of origin data are provided for those subjects
that had this information (Additional data file 1). The study
was approved by the Duke University Medical Center IRB,
and all subjects gave informed consent.
Genotyping
All subjects were whole-genome genotyped using either the
Illumina Infinium HumanHap550 version 1, the Illumina
Infinium HumanHap550 version 3 or the Infinium Human-
Hap 610-quad chips. For quality control purposes, we
employed a 'one percent rule' that discarded from analysis
any SNP that had more than 1% of samples that could not be
reliably scored, and any sample that had fewer than 99%
SNPs reliably called. We carried out a test of cryptic related-
ness to remove any relatives or duplicates within the sample,
and we ensured that all genetically predicted sexes matched
those in the genotype file, to check for genotype-ID mis-
matches. Genotype files are available as plink map and ped
files (Additional data file 4).
Eigenstrat analysis
To find Eigenstrat axes, we started with autosomal SNPs with
minor allele frequency >0.01 from the set of SNPs that over-
lapped between the Illumina Infinium HumanHap550 ver-
sion 1, Illumina Infinium HumanHap550 version 3, and the
Infinium HD 610-quad chips. In order to prevent over-repre-
sentation of regions with more redundant SNPs, we used the
indep-pairwise command in the plink software package [11]
to reduce linkage disequilibrium between the remaining var-
iants by eliminating any SNP that had a pairwise r
2
> 0.3 with
any other SNP in a 1,500 bp window (step size 150 bp). We
also removed SNPs from certain known high LD regions
(chr8:8000000 12000000, chr6:25000000 33500000,
chr11:45000000 57000000, chr5:44000000 51500000).
This reduced the original dataset to 121,834 SNPs (Additional
data file 2). We then used smartpca and EIGENSOFT [8,12].
After the first run of smartpca there were 12 significant axes,
but several of these seemed to be driven by a small number of
outlier individuals. We then repeated the principal compo-
nents analysis (PCA), this time allowing the automatic
removal of all individuals that exceeded six standard devia-
tions along the first ten principal component axes. Over 4
iterations, 19 outliers were removed, leaving 611 subjects. The
19 outliers included two subjects with 4 Jewish grandparents
(1 identified by the subject as Sephardic), 1 with 2 Jewish
grandparents and 16 of non-Jewish ancestry. In most cases
the outliers had one or more grandparents from the Middle
East, North Africa, Hawaii or South America.
Statistical analysis of association of ancestry with
principal component axes
PCA of the whole-genome data (after LD reduction) indicated
the existence of five major ancestry axes, all driven by SNPs
distributed throughout the genome. As expected from the
work of Price et al. [7], the first principal component emerg-
ing from the Eigenstrat analyses was strongly correlated with
Jewish ancestry (one-way ANOVA comparing groups with 0,
1, 2, 3 and 4 Jewish grandparents, F
4,606
= 1068.4, p = 8.5 ×
10
-273
). We therefore used an individual's position on this axis
to assess how well Jewish ancestry could be predicted from
the genetic data. Specifically, we used one-way ANOVA to see
if those subjects declaring 1 (n = 8), 2 (n = 37), 3 (n = 4) or 4
(n = 55) Jewish grandparents were significantly different on
PC1 from those declaring no Jewish grandparents (n = 507),
and we identified clear clusters of individuals with different
ancestries on this first principal component.
Analysis on combined Duke and CEPH-HDGP samples
Firstly we attempted to analyze population structure on the
mixed Duke/CEPH populations by including all SNPs, having
again reduced redundancy as described above. However,
because the Duke and CEPH populations were genotyped and
quality controlled separately, a PCA that included all SNPs
revealed multiple significant axes, reflecting systematic dif-
ferences in laboratory procedures between the two genotyp-
ing sites. In order to focus on axes that reflected population
structure and not genotyping procedures, we reduced the
dataset to a core set of SNPs that did not show any systematic
differences between the sites. To do this, we first reduced the
dataset by sorting the reduced-LD dataset by chromosome
and location and selecting a subset of SNPs (for example, one
in every five along the chromosome) for analysis. We then
removed any SNP that did not have genotype data for all indi-
viduals. We performed the PCA using EIGENSOFT as above,
and examined the q-q plots for the distribution of SNP load-
ings, checking for axes with heavy tails. If such axes were
detected, we removed the 'outlier' SNPs with particularly
strong loadings on those axes (absolute value >1), and reap-
plied EIGENSOFT as before. Once all axes appeared to have a
normal distribution, we plotted the axes and colored the sub-
jects according to country of origin, and checked to see that
the Duke population was mixed in with the European samples
as expected (for example, subjects with four Italian or Rus-
sian grandparents clustered closer to their respective CEPH
populations than to each other). We found that the largest set
of SNPs that met these criteria was a set of 13,573 SNPs (Addi-
tional data file 3). It is possible that we could increase this
dataset and gain better resolution for the European popula-
tions that remain undistinguished, but this was sufficient for
the needs of this work.
Abbreviations
PC1: first principal component axis; PCA: principal compo-
nents analysis; SNP: single nucleotide polymorphism.
Authors' contributions
ACN, ETC and DK recruited the subjects, genotyped them
and performed genotyping quality control; ACN performed
the analyses and ACN and DBG wrote the paper.
Genome Biology 2009, Volume 10, Issue 1, Article R7 Need et al. R7.7
Genome Biology 2009, 10:R7
Additional data files
The following additional data are available with the online
version of this paper. Additional data file 1 is a CSV file dis-
playing the country of origin (or ancestry if US was country of
origin and ancestry was provided) of the 611 European-Amer-
ican samples used in the study. Additional data file 2 is a list
of all SNPs included in the original analysis (n = 121,834).
Additional data file 3 is a list of all SNPs included in the com-
bined Duke and CEPH analysis (n = 13,573). Additional data
file 4 is a zip file providing genotype data in plink format for
the 121,834 SNPs included in the original analysis.
Additional data file 1Country of origin (or ancestry if US was country of origin and ancestry was provided) of the 611 European-American samples used in the study'No data' is inserted if the subject identified the grandparents as Caucasian, Eurasian or American.Click here for fileAdditional data file 2SNPs included in the original analysisSNPs included in the original analysis (n = 121,834).Click here for fileAdditional data file 3SNPs included in the combined Duke and CEPH analysisSNPs included in the combined Duke and CEPH analysis (n = 13,573).Click here for fileAdditional data file 4Genotype data in plink format for the 121,834 SNPs included in the original analysisThis includes a map file and a ped file. The map file has one line per SNP and the following columns: chromosome, rs#, genetic distance (blank) and position. The ped file has one line per subject and the following columns: Family ID (anonymous identifier), Individual ID (always 1, as subjects are unrelated), Paternal ID, Maternal ID (both zero), sex (1 = male, 2 = female) and phenotype, which in this case is the number of declared Jewish grandparents.Click here for file
Acknowledgements
Thanks to all the subjects that took part in this study. This work was funded
by Duke IGSP start-up funding for DBG.
References
1. Thomas MG, Parfitt T, Weiss DA, Skorecki K, Wilson JF, le Roux M,
Bradman N, Goldstein DB: Y chromosomes traveling south: the
cohen modal haplotype and the origins of the Lemba - the
"Black Jews of Southern Africa". Am J Hum Genet 2000,
66:674-686.
2. Thomas MG, Weale ME, Jones AL, Richards M, Smith A, Redhead N,
Torroni A, Scozzari R, Gratrix F, Tarekegn A, Wilson JF, Capelli C,
Bradman N, Goldstein DB: Founding mothers of Jewish commu-
nities: geographically separated Jewish groups were inde-
pendently founded by very few female ancestors. Am J Hum
Genet 2002, 70:1411-1420.
3. Ostrer H: A genetic profile of contemporary Jewish popula-
tions. Nat Rev Genet 2001, 2:891-898.
4. Behar DM, Metspalu E, Kivisild T, Achilli A, Hadid Y, Tzur S, Pereira
L, Amorim A, Quintana-Murci L, Majamaa K, Herrnstadt C, Howell N,
Balanovsky O, Kutuev I, Pshenichnov A, Gurwitz D, Bonne-Tamir B,
Torroni A, Villems R, Skorecki K: The matrilineal ancestry of
Ashkenazi Jewry: portrait of a recent founder event. Am J
Hum Genet 2006, 78:487-497.
5. Behar DM, Garrigan D, Kaplan ME, Mobasher Z, Rosengarten D,
Karafet TM, Quintana-Murci L, Ostrer H, Skorecki K, Hammer MF:
Contrasting patterns of Y chromosome variation in
Ashkenazi Jewish and host non-Jewish European popula-
tions. Hum Genet 2004, 114:354-365.
6. Rosenberg NA, Pritchard JK, Weber JL, Cann HM, Kidd KK, Zhivot-
ovsky LA, Feldman MW: Genetic structure of human popula-
tions. Science 2002, 298:2381-2385.
7. Price AL, Butler J, Patterson N, Capelli C, Pascali VL, Scarnicci F, Ruiz-
Linares A, Groop L, Saetta AA, Korkolopoulou P, Seligsohn U, Wal-
iszewska A, Schirmer C, Ardlie K, Ramos A, Nemesh J, Arbeitman L,
Goldstein DB, Reich D, Hirschhorn JN: Discerning the ancestry of
European Americans in genetic association studies. PLoS
Genet 2008, 4:e236.
8. Price AL, Patterson NJ, Plenge RM, Weinblatt ME, Shadick NA, Reich
D: Principal components analysis corrects for stratification
in genome-wide association studies. Nat Genet 2006, 38:904.
9. Jakobsson M, Scholz SW, Scheet P, Gibbs JR, VanLiere JM, Fung HC,
Szpiech ZA, Degnan JH, Wang K, Guerreiro R, Bras JM, Schymick JC,
Hernandez DG, Traynor BJ, Simon-Sanchez J, Matarin M, Britton A,
Leemput J van de, Rafferty I, Bucan M, Cann HM, Hardy JA, Rosenberg
NA, Singleton AB: Genotype, haplotype and copy-number var-
iation in worldwide human populations. Nature 2008,
451:998-1003.
10. Goldstein DB: Jacob's Legacy: A Genetic View of Jewish History New
Haven, CT: Yale University Press; 2008.
11. Purcell S, Neale B, Todd-Brown K, Thomas L, Ferreira MA, Bender
D, Maller J, Sklar P, de Bakker PI, Daly MJ, Sham PC: PLINK: a tool
set for whole-genome association and population-based link-
age analyses. Am J Hum Genet 2007, 81:559-575.
12. Patterson N, Price AL, Reich D: Population structure and
Eigenanalysis. PLoS Genet 2006, 2:e190.