Báo cáo y học: "Exploring the transcriptional landscape of plant circadian rhythms using genome tiling arrays" potx
Bạn đang xem bản rút gọn của tài liệu. Xem và tải ngay bản đầy đủ của tài liệu tại đây (1.05 MB, 12 trang )
Genome Biology 2009, 10:R17
Open Access
2009Hazenet al.Volume 10, Issue 2, Article R17
Research
Exploring the transcriptional landscape of plant circadian rhythms
using genome tiling arrays
Samuel P Hazen
*¶
, Felix Naef
†
, Tom Quisel
†
, Joshua M Gendron
*
,
Huaming Chen
‡
, Joseph R Ecker
‡
, Justin O Borevitz
§
and Steve A Kay
*
Addresses:
*
Section of Cell and Developmental Biology, University of California San Diego, Gilman Drive, La Jolla, CA 92093-0130, USA.
†
School of Life Science, Ecole Polytechnique Federale de Lausanne (EPFL), CH-1015 Lausanne, Switzerland.
‡
Plant Biology Laboratory and
Genome Analysis Laboratory, The Salk Institute for Biological Studies, N. Torrey Pines Road, La Jolla, CA 92037, USA.
§
Department of
Evolution and Ecology, University of Chicago, E. 57th Street, Chicago, IL 60637, USA.
¶
Biology Department, University of Massachusetts, N.
Pleasant Street, Amherst, MA 01003, USA.
Correspondence: Steve A Kay. Email:
© 2009 Hazen et al.; licensee BioMed Central Ltd.
This is an open access article distributed under the terms of the Creative Commons Attribution License ( which
permits unrestricted use, distribution, and reproduction in any medium, provided the original work is properly cited.
Plant circadian transcription<p>Whole genome tiling array analysis reveals the extent of transcriptional oscillation for both coding and non-coding genes in regulating Arabidopsis thaliana circadian rhythms</p>
Abstract
Background: Organisms are able to anticipate changes in the daily environment with an internal
oscillator know as the circadian clock. Transcription is an important mechanism in maintaining
these oscillations. Here we explore, using whole genome tiling arrays, the extent of rhythmic
expression patterns genome-wide, with an unbiased analysis of coding and noncoding regions of
the Arabidopsis genome.
Results: As in previous studies, we detected a circadian rhythm for approximately 25% of the
protein coding genes in the genome. With an unbiased interrogation of the genome, extensive
rhythmic introns were detected predominantly in phase with adjacent rhythmic exons, creating a
transcript that, if translated, would be expected to produce a truncated protein. In some cases,
such as the MYB transcription factor AT2G20400, an intron was found to exhibit a circadian rhythm
while the remainder of the transcript was otherwise arrhythmic. In addition to several known
noncoding transcripts, including microRNA, trans-acting short interfering RNA, and small nucleolar
RNA, greater than one thousand intergenic regions were detected as circadian clock regulated,
many of which have no predicted function, either coding or noncoding. Nearly 7% of the protein
coding genes produced rhythmic antisense transcripts, often for genes whose sense strand was not
similarly rhythmic.
Conclusions: This study revealed widespread circadian clock regulation of the Arabidopsis genome
extending well beyond the protein coding transcripts measured to date. This suggests a greater
level of structural and temporal dynamics than previously known.
Background
Many organisms exhibit cyclic changes in physiology and
behavior in accordance with predictable changes in their daily
environment, namely shifts in temperature and light intensity
owing to transitioning exposure to the sun caused by the
Earth's rotation. In addition to reacting directly to external
Published: 11 February 2009
Genome Biology 2009, 10:R17 (doi:10.1186/gb-2009-10-2-r17)
Received: 5 August 2008
Revised: 9 December 2008
Accepted: 11 February 2009
The electronic version of this article is the complete one and can be
found online at /> Genome Biology 2009, Volume 10, Issue 2, Article R17 Hazen et al. R17.2
Genome Biology 2009, 10:R17
stimuli, many organisms time their behavior in anticipation
of periodic changes in the environment. Such circadian
rhythms are believed to be adaptive and, indeed, have been
demonstrated in both prokaryotic and eukaryotic photosyn-
thetic organisms [1,2]. The endogenous timing mechanism
known as circadian clocks is widespread across life and is pri-
marily based on interlocking transcriptional feedback loops
and regulated protein turnover [3].
Circadian clock regulation of transcription in plants appears
to be extensive and many pathways governing processes such
as photosynthesis, cold acclimation, and cell wall dynamics,
for example, exhibit circadian rhythms at multiple levels [4-
6]. Estimates of the extent of circadian clock regulation are
primarily derived from the use of high-density oligonucle-
otide arrays with features that mostly correspond to the 3' end
of genes annotated as protein coding (see, for example, [4-6]).
Recently, there has been a flourish of transcript mapping
using genome tiling arrays capable of measuring nearly all
nonredundant sequences in the genome, far beyond the capa-
bility of previous studies [7-9]. In excess of the number of
protein coding transcripts, noncoding RNAs (ncRNAs),
which include natural antisense transcripts (NATs), appear to
be a large component of the remarkably complex transcrip-
tome in all organisms examined to date: Arabidopsis,
Caenorhabditis elegans, Chlamydomonas, Drosophila,
Escheichia coli, human, rice, and yeast [10-24]. Aside from
hybridization-based detection systems, sequencing
approaches such as serial analysis of gene expression (SAGE),
massively parallel signature sequencing (MPSS), and direc-
tional cDNA cloning and sequencing have confirmed wide-
spread existence of these transcripts in plants and other
species [25-27]. It is not difficult to fathom the existence of
numerous and sundry ncRNAs. There are several classes of
long studied ncRNAs, such as transfer RNA (tRNA), ribos-
omal RNA (rRNA), and small nuclear RNA (snRNA) in addi-
tion to the more recently discovered small nucleolar RNA
(snoRNA), microRNA (miRNA), and short interfering RNA
(siRNA) [28]. Nevertheless, the existence of these specific
forms does not explain the excessive ncRNAs measured by til-
ing arrays. This suggests a complex RNA regulatory network
akin to that revealed through the study of X chromosome
silencing, for example [29].
Tiling array experiments have done little to characterize
large-scale transcriptional activity beyond to say it exists.
Here, we explore circadian clock controlled transcriptional
regulation in Arabidopsis using high-density oligonucleotide
tiling arrays. In addition to protein coding genes and inter-
genic regions, we measured circadian regulation of introns, as
well as clock-regulated NATs.
Results and discussion
Tiling array characteristics and performance
The Affymetrix Arabidopsis tiling arrays each contain
1,683,620 unique 25-mer oligonucleotide features. One array
is composed of the forward or Watson strand and the other
the reverse or Crick strand. The Arabidopsis Information
Resource Version 7 (TAIR7) genome annotation includes a
total of 32,041 genes, of which 27,029 are considered to be
protein coding [30]. Nearly 95% (25,677) of the protein cod-
ing genes have at least two corresponding exon array features,
as do 74% (2,863) of the transposons and pseudogenes (Table
1). Due to their small size and sequence redundancy within
gene families, only 202 of the 1,123 annotated ncRNAs have
at least two corresponding array features and, of those, 62 are
miRNA.
Labeled cRNA was prepared from 12 samples collected during
a 2-day circadian time course at 4-hour resolution. Samples
were independently hybridized to each array as previously
described [4]. Spectral analysis was used to test for a circa-
dian rhythm in the hybridization intensity of each feature
across the 2-day time course. Rather than treat each feature
as an independent experiment, a sliding window approach
was used to exploit the redundant signal in neighboring fea-
tures (see Materials and methods). As a test of the capabilities
of the tiling arrays, RNA time course, and spectral analysis,
we specifically looked at the expression of 14 circadian clock
associated genes: CIRCADIAN CLOCK ASSOCIATED1
(CCA1), LATE ELONGATED HYPOCOTYL (LHY),
GIGANTEA (GI), TIMING OF CAB2 EXPRESSION1 (TOC1),
PSEUDO RESPONSE REGULATOR3, 5, 7, and 9 (PRR3, 5, 7,
and 9), LOV KELCH PROTEIN2 (LKP2), LUX ARRHYTHMO
Table 1
Arabidopsis genome and AtTILE1 array annotation data
Annotation TAIR7* AtTILE1 CCGs
†
Protein coding 27,029 25,677 6,269
Pseudogenes or TE 3,889 2,863 81
Noncoding RNAs 1,123
MicroRNA 114 62 (30) 6
Small nucleolar RNA 71 17 (29) 1
Small nuclear RNA 13 0 ND
Pre-transfer RNA 689 2 (129) 0
Ribosomal RNA 4 0 ND
Other 221 121 (29) 15
Total 32,041 6,372
Annotation units receiving consideration had at least two unique
corresponding array features. Values in parentheses are the number of
transcripts with a single corresponding feature. *The Arabidopsis
Information Resource (TAIR) version 7 genome annotation [30].
†
Circadian clock regulated genes. ND, not determined; TE,
transposable element.
Genome Biology 2009, Volume 10, Issue 2, Article R17 Hazen et al. R17.3
Genome Biology 2009, 10:R17
(LUX), EARLY FLOWERING3 and 4 (ELF3 and ELF4), FLA-
VIN-BINDING, KELCH REPEAT, F-BOX 1 (FKF1) and ZEIT-
LUPE (ZTL) [31]. In Figures 1, 2, 3, and 4 we plot the results
of the spectral analysis of the expression level time course for
individual features on the array. Each of these genes had at
least two exon features that satisfied the p < 0.005 cut-off as
well as a phase (Additional data files 1 and 2) similar to that
reported previously. Two clock genes with weak rhythms at
the transcriptional level, LKP2 [32] and ZTL, exhibited the
expected behavior (Figure 3). A clock gene that does not cycle
at the transcriptional level, TIME FOR COFFEE [33], was
similarly found not to exhibit circadian regulation (Figure
4c).
In addition to these consistencies, we compared the tiling
array dataset with a similarly produced 2-day time course
[GEO:GSE8365] [34] hybridized to the Affymetrix ATH1
gene array. The spectral analysis for each gene on the gene
array was plotted against all of the features for that transcript
on the tilling array. While comparison between these plat-
forms should be interpreted cautiously, there was strong
accord between data sets for significance in rhythmicity as
well as circadian phase (Additional data file 3). At the genome
level, 24.4% of the protein coding genes were circadian clock
regulated (false discovery rate < 0.05%), that is to say, the
transcript exhibited a rhythmic 24-hour period over a 2-day
time course (Table S3 in Additional data file 4). This result is
well within the range of recent reports [35,36] that used the
Arabidopsis ATH1 array. In these studies, more than 75% of
the protein coding transcripts assayed were found to cycle
when driven by various conditions of photocycles and/or
thermocycles or under constant conditions. While all phases
were represented, there was an increase in frequency of genes
with peak expression just prior to dawn and dusk, suggesting
an important role of the circadian clock in anticipating the
transitions between day and night (Figure 5a). These data can
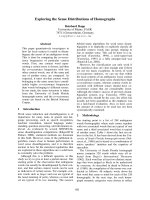
The Arabidopsis tiling arrays portray several interesting classes of circadian behavior in the genomeFigure 1
The Arabidopsis tiling arrays portray several interesting classes of circadian behavior in the genome. Each symbol is a feature on the tilling array showing
location in the genome (x-axis) and significance of the spectral analysis (y-axis) for (a) LUX ARRHYTHMO, (b) CIRCADIAN CLOCK ASSOCIATED1, (c) LATE
ELONGATED HYPOCOTYL, and (d) EARLY FLOWERING3. The top half of each panel displays the Watson strand and the bottom half the Crick strand.
Individual features that exceed the false discovery rate 5% p-value threshold (-) are considered to have a circadian rhythm.
6
4
2
0
2
4
6
11065350 11067350 11069350
FDR 5%
p
-value threshold
6
4
2
0
2
4
6
19252300 19253300 19254300 19255300 19256300
FDR 5% p-value threshold
6
4
2
0
2
4
6
17193600 17194600 17195600 17196600
FDR 5%
p
-value threshold
6
4
2
0
2
4
6
33000 34000 35000 36000 37000 38000
FDR 5%
p
-value threshold
Chromosome 3 (bp) Chromosome 2 (bp)
Chromosome 1 (bp) Chromosome 2 (bp)
log10 of cycling p-valuelog10 of cycling p-value
Sense strand exon
Antisense strand exon
Sense strand intron
Antisense strand intron
Adjacent features
LUX ARRHYTHMO CIRCADIAN CLOCK ASSOCIATED1
LATE ELONGATED HYPOCOTYL
EARLY FLOWERING3
At3g46640
At2g46830
At1g01060
At2G25930
(a) (b)
(c)
(d)
Genome Biology 2009, Volume 10, Issue 2, Article R17 Hazen et al. R17.4
Genome Biology 2009, 10:R17
also be queried and visualized at the Arabidopsis Cyclome
Expression Database [37].
Circadian clock regulation of introns
Unlike the design of the Arabidopsis ATGenome1 and ATH1
arrays, where features quantify hybridization of the sense
strand transcript of the protein coding regions, AtTILE1 fea-
tures also correspond to 597,856 intergenic and 301,733
intronic loci on each strand. Interestingly, these features
capably detected 499 transcripts with rhythmic introns
(Table S4 in Additional data file 4). In cases where cycling
introns were observed in genes with cycling exons (n = 213),
the introns frequently had a similar phase to the coding
regions of the transcript (Figure 5b). Unlike an alternatively
spliced exon, introns are nonsense sequences and their inclu-
sion tends to introduce a translational stop, as in the exam-
ples of ELF3 (Figure 1b) and CONSTANS LIKE2 (COL2)
(Figure 4d). Transcripts of these genes were transcriptionally
verified for an exon and intron using quantitative PCR of
reverse transcriptase amplified cDNA (QRT-PCR) of an
experimentally independent time course (Additional data file
5). For both genes (ELF3 [GenBank:AY136385
and Y11994];
COL2 [GenBank:L81119
and L81120]), a cDNA of both splice
forms, with and without the detected cycling intron, has been
captured and sequenced. By assaying RNA from pooled whole
seedlings with an oligonucleotide array platform, it is not
clear if both variants occur in the same cell or tissue types or
if they are simply immature transcripts sampled prior to com-
plete processing. Hybridization intensities of individual fea-
tures do suggest the intron variant of COL2, for example, is
present in appreciable quantities (Additional data file 5). If
so, this presents somewhat of a conundrum. For example,
mutations in ELF3 can cause a rather dramatic effect on flow-
ering time and circadian rhythms in Arabidopsis [38] and,
curiously, inclusion of the second intron, as we observed,
could produce a protein similar to that of the elf3-1 mutant
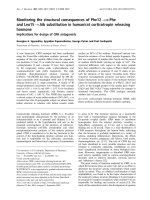
The Arabidopsis tiling arrays portray several interesting classes of circadian behavior in the genomeFigure 2
The Arabidopsis tiling arrays portray several interesting classes of circadian behavior in the genome. Each symbol is a feature on the tilling array showing
location in the genome (x-axis) and significance of the spectral analysis (y-axis) for (a) EARLY FLOWERING4, (b) TIMING OF CAB2 EXPRESSION1, (c)
PSEUDO RESPONSE REGULATOR5, and (d) PSEUDO RESPONSE REGULATOR3. The top half of each panel displays the Watson strand and the bottom half
the Crick strand. Individual features that exceed the false discovery rate 5% p-value threshold (-) are considered to have a circadian rhythm.
6
4
2
0
2
4
6
16739500 16740500 16741500 16742500 16743500
Chromosome 2 (bp)
FDR 5% p-value threshold
6
4
2
0
2
4
6
24691500 24692500 24693500 24694500 24695500
FDR
5%
p
-v
a
l
ue
t
hr
es
h
o
l
d
6
4
2
0
2
4
6
8355500 8356500 8357500 8358500 8359500
FDR 5% p-value threshold
6
4
2
0
2
4
6
24214750 24215750 24216750 24217750
FDR 5% p-value threshold
Chromosome 5 (bp)
Chromosome 5 (bp)
Chromosome 5 (bp)
EARLY FLOWERING4
TIMING OF CAB2 EXPRESSION1
PSEUDO RESPONSE REGULATOR5
PSEUDO RESPONSE REGULATOR3
log10 of cycling p-valuelog10 of cycling p-value
At2g40080
At5g61380
At5g60100
At5g24460
(a)
(b)
(c) (d)
Sense strand exon
Antisense strand exon
Sense strand intron
Antisense strand intron
Adjacent features
Genome Biology 2009, Volume 10, Issue 2, Article R17 Hazen et al. R17.5
Genome Biology 2009, 10:R17
[39]. In a number of instances, introns exhibited a phase dif-
fering from the coding region of the transcript by greater than
4 hours (Figure 5b).
Quite unexpected, 286 genes that showed no evidence of
rhythmic expression of coding regions contained an intron
exhibiting circadian rhythmcity (Table S5 in Additional data
file 4). This form of alternative splicing or 'gated intron inclu-
sion' could result in altered protein function that occurs at a
specific time of day. For example, the fifth intron of
AT2G20400 (Figure 6a) cycles with peak expression in the
late afternoon and this was confirmed by QRT-PCR using a
second experimental time course (Additional data file 5).
Under these circumstances, the complete message was con-
stitutively, or at least arrhythmically, expressed. Perhaps the
point of peak rhythmic expression of the intron is a circadian
clock regulated occurrence of intron inclusion where the tran-
scribed protein is truncated. This phenomenon is not difficult
to reconcile with what is known about the Arabidopsis
genome. Among the protein coding transcripts, nearly 15%
have an annotated splice variant [30], which is appreciably
smaller than the proportion in mammalian genomes [40,41].
In addition to the distinction in overall proportion of splice
variant genes, intron inclusion is a less frequent cause of var-
iation in mammals but the most prevalent in Arabidopsis,
with at least 8% of Arabidopsis protein coding genes exhibit-
ing intron inclusion [42,43]. Considering that the vast pro-
portion of the genome is diurnally and circadian regulated,
including many RNA binding proteins, the occurrence of cir-
cadian gated intron inclusion is not inexplicable [35,44].
However, the exact mechanism for any one of these events
and their biological relevance is not well understood. In a
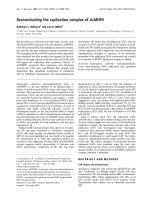
The Arabidopsis tiling arrays portray several interesting classes of circadian behavior in the genomeFigure 3
The Arabidopsis tiling arrays portray several interesting classes of circadian behavior in the genome. Each symbol is a feature on the tilling array showing
location in the genome (x-axis) and significance of the spectral analysis (y-axis) for (a) PSEUDO RESPONSE REGULATOR7, (b) PSEUDO RESPONSE
REGULATOR9, (c) LOV KELCH PROTEIN2, and (d) ZEITLUPE. The top half of each panel displays the Watson strand and the bottom half the Crick strand.
Individual features that exceed the false discovery rate 5% p-value threshold (-) are considered to have a circadian rhythm.
6
4
2
0
2
4
6
637000 638000 639000 640000 641000 642000
FDR 5% p-value threshold
6
4
2
0
2
4
6
19239100 19240100 19241100 19242100 19243100 19244100
FDR 5%
p
-value threshold
6
4
2
0
2
4
6
8201500 8202500 8203500 8204500
FDR 5% p-value threshold
6
4
2
0
2
4
6
23257500 23258500 23259500 23260500 23261500
FDR 5% p-value threshold
Chromosome 5 (bp) Chromosome 2 (bp)
Chromosome 2 (bp)
Chromosome 5 (bp)
log10 of cycling p-valuelog10 of cycling p-value
PSEUDO RESPONSE REGULATOR7
PSEUDO RESPONSE REGULATOR9
LOV KELCH PROTEIN 2
ZEITLUPE
At5g02810
At2g46790
At2g18915
At5g57360
(a) (b)
(c) (d)
Sense strand exon
Antisense strand exon
Sense strand intron
Antisense strand intron
Adjacent features
Genome Biology 2009, Volume 10, Issue 2, Article R17 Hazen et al. R17.6
Genome Biology 2009, 10:R17
number of instances, the peak phase of expression of introns
was observed to be 4-12 hours apart from that of the coding
region of a transcript (Figure 5b).
Circadian clock regulation of ncRNAs
Certain ncRNAs known as miRNAs fold back and form imper-
fect double-stranded RNAs that are processed by the Dicer
and RNaseIII-like families to create approximately 22 bp
fragments [45]. In plants, transcripts with exact homology to
mature miRNAs are targeted for post-transcriptional regula-
tion. Many miRNAs are responsible for silencing transcrip-
tion factors associated with growth and development and
their expression is often tightly regulated both developmen-
tally and spatially [46-48]. Although the AtTILE1 arrays are
capable of distinguishing only a fairly small proportion of the
114 annotated miRNAs in the Arabidopsis genome, several
were found to cycle in 1-week-old seedlings. Our protocol
amplified and is assumed to detect polyadenylated tran-
scripts only, and in the case of the miRNA loci, some relatively
large cycling premature transcripts were observed. Two
miRNA in particular, MIR160B and MIR167D (Additional
data file 5), target several members of the AUXIN RESPONSE
FACTOR (ARF) family, members of which bind to the auxin
response elements (TGTCTC) in promoters of early auxin
response genes [49]. MIR160B targets ARF10, ARF16, and
ARF17, which are all believed to be involved in germination
and post-germination stages of growth [50,51]. MIR167D tar-
gets ARF6 and ARF8, which are involved in male and female
reproductive development [51,52]. Two other clearly cycling
miRNA are MIR158A, with no known target, and MIR157A,
which targets several members of the SQUAMOSA BINDING
PROTEIN family, SPL3, SPL4, and SPL5. Interestingly, the
target SPLs and ARFs were not found to be circadian regu-
lated. We speculate that for such a pattern to occur, the target
must be expressed constitutively and only in cell types with
rhythmic target miRNA expression. Otherwise, the signal
from cells where miRNA are not expressed may obscure a
rhythmic signal caused by miRNA expression in other cells.
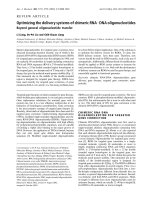
The Arabidopsis tiling arrays portray several interesting classes of circadian behavior in the genomeFigure 4
The Arabidopsis tiling arrays portray several interesting classes of circadian behavior in the genome. Each symbol is a feature on the tilling array showing
location in the genome (x-axis) and significance of the spectral analysis (y-axis) for (a) FLAVIN-BINDING KELCH DOMAIN F BOX PROTEIN1, (b) GIGANTEA,
(c) TIME FOR COFFEE, and (d) CONSTANS LIKE2. The top half of each panel displays the Watson strand and the bottom half the Crick strand. Individual
features that exceed the false discovery rate 5% p-value threshold (-) are considered to have a circadian rhythm.
-6
-4
-2
0
2
4
6
486500 487500 488500 489500
FDR 5%
p
-value threshold
-6
-4
-2
0
2
4
6
25511700 25512700 25513700 25514700 25515700
FDR 5% p-value threshold
-6
-4
-2
0
2
4
6
8061000 8063000 8065000 8067000
FDR 5%
p
-value threshold
-6
-4
-2
0
2
4
6
7912500 7914500 7916500 7918500
FDR 5% p-value threshold
Chromosome 1 (bp) Chromosome 1 (bp)
Chromosome 3 (bp) Chromosome 3 (bp)
FLAVIN-BINDING KELCH DOMAIN F BOX PROTEIN1
GIGANTEA
TIME FOR COFFEE
CONSTANS LIKE2
log10 of cycling p-value
log10 of cycling p-value
At1g68050
At1g22770
At3g02380
At3g22380
Sense strand exon
Antisense strand exon
Sense strand intron
Antisense strand intron
Adjacent features
Genome Biology 2009, Volume 10, Issue 2, Article R17 Hazen et al. R17.7
Genome Biology 2009, 10:R17
Additionally, the relationship between target degradation
and miRNA concentration would need to be somewhat linear,
whereas in practice it is more qualitative, requiring a certain
threshold of accumulation prior to detectable degradation
[53]. Therefore, the absence of a reciprocal expression pat-
tern of the target transcripts does not rule out a specific func-
tion behind the circadian behavior of the miRNA.
The well-described complexity of AFR transcript regulation is
also influenced by trans-acting siRNA (ta-siRNA), namely
TAS3 [54-57]. Dicer processing of the primary TAS tran-
scripts is triggered by miRNA-guided cleavage. In the case of
TAS3, MIR390 directed cleavage results in a 21 bp double-
stranded RNA with post-transcriptional properties similar to
miRNA [58]. While both MIR390A (At2g38325) and
MIR390B (At5g58465) were reliably detected by the AtTILE1
arrays, neither was found to exhibit a circadian rhythm (Addi-
tional data files 1 and 2). On the other hand, the abundance of
the primary TAS3 transcript is clearly circadian clock regu-
lated, a pattern confirmed in two independent time courses
(Additional data file 5). While transcript abundance of TAS3
and possibly TAS2 (Additional data files 1 and 2) is clearly
clock regulated, a functional ncRNA will only arise with the
coincidence of the initiating miRNA. This scenario explains a
Different types of transcripts and transcription units have variable phase distributions across the day as well as within a locusFigure 5
Different types of transcripts and transcription units have variable phase distributions across the day as well as within a locus. (a) Relative phase frequency
distribution of cycling sense and antisense transcript phase. (b) Scatter plot of the expression phases of loci with both sense and antisense strand cycling
transcripts. (c) Relative phase frequency distribution of cycling sense strand and antisense strand introns and intergenic transcript phase. (d) Scatter plot
of the expression phases of transcripts and their cycling introns. tu(s), transcript unit(s).
0
0.01
0.02
0.03
0.04
0 4 8 12 16 20 24
0
0.01
0.02
0.03
0.04
0
4
8
12
16
20
24
0 4 8 12 16 20 24
0
4
8
12
16
20
24
Sense strand tus
Antisense strand tus
Relative frequencyRelative frequency
Time (hrs)
Sense strand introns
Antisense introns
Intergenic
Sense strand intron phase
Time (hrs)
Antisense strand tu phase
Time (hrs)
Sense strand tu phase
Time (hrs)
(a) (b)
(c) (d)
Genome Biology 2009, Volume 10, Issue 2, Article R17 Hazen et al. R17.8
Genome Biology 2009, 10:R17
mechanism for very specific regulation of ARF transcript deg-
radation that is possibly dependent on both internal and
external cues [59].
While few snoRNAs were detected by the arrays, one such
ncRNA, snoRNA77 (At5g10572), cycled with a peak expres-
sion in the late evening (data not shown). This class of
snoRNA is believed to target certain transcripts for chemical
modification, namely 2'-O-methylation [60]. Circadian clock
regulation of these transcripts suggests that this form of tran-
scriptional modification could, in part, be circadian regulated
as well. However, behavior of this transcript was arrhythmic
when measured using QRT-PCR of two independent time
courses (data not shown). The irreproducibility could be due
to a false positive in the tiling array data and analysis or the
QRT-PCR data, or due to experimental differences between
time courses.
Circadian clock regulation of natural antisense
transcripts
Perhaps one of the more uniquely revealing aspects of a
genome tiling array is the ability to differentiate probe strand-
edness. Indeed, rhythmic NATs were detected for 7% (n =
1,712) of the protein coding genes detected by the arrays
(Table S4 in Additional data file 4). Among them were the
core clock associated MYB transcription factors LHY and
CCA1, and the PSEUDO RESPONSE REGULATORS (TOC1,
PRR3, 5, 7, and 9) (Figures 1, 2, 3, and 4). On the other hand,
no NATs were observed for GI, LUX, or ELF3. Among the
aforementioned rhythmic NATs, all exhibited a similar time
of peak expression as the sense transcript. Overall, the major-
ity of the rhythmic NATs overlapped with circadian regulated
sense transcripts with a similar phase of expression (Figure
5d). The expected outcome of NAT expression based on func-
tional characterization and expression pattern of the Neu-
The Arabidopsis tiling arrays portray several interesting classes of circadian behavior in the genomeFigure 6
The Arabidopsis tiling arrays portray several interesting classes of circadian behavior in the genome. Each symbol is a feature on the tilling array showing
location in the genome (x-axis) and significance of the spectral analysis (y-axis) for (a) AT2G20400, (b) MIR167, (c) TRANS-ACTING siRNA3, and (d)
transfrag-5-6839029. The top half of each panel displays the Watson strand and the bottom half the Crick strand. Individual features that exceed the false
discovery rate 5% p-value threshold (-) are considered to have a circadian rhythm.
6
4
2
0
2
4
6
5,860,600 5,861,600 5,862,600
FDR 5%
p
-value threshold
6
4
2
0
2
4
6
6837500 6838500 6839500 6840500
FDR 5% p-value threshold
6
4
2
0
2
4
6
8805500 8806500 8807500 8808500
FDR 5%
p
-value threshold
6
4
2
0
2
4
6
11135500 11137500 11139500
FDR 5%
p
-value threshold
Chromosome 2 (bp) Chromosome 1 (bp)
Chromosome 3 (bp) Chromosome 5 (bp)
log10 of cycling p-valuelog10 of cycling p-value
MIR167D
TRANS-ACTING siRNA3
At2g20400
At1g31173
At3g17185
transfrag-5-6839029
Watson strand
Crick strand
(a) (b)
(c)
(d)
Sense strand exon
Antisense strand exon
Sense strand intron
Antisense strand intron
Adjacent features
Genome Biology 2009, Volume 10, Issue 2, Article R17 Hazen et al. R17.9
Genome Biology 2009, 10:R17
rospora core clock gene FREQUENCY [61] is inverse
expression of the complementary transcript. This leaves in
question the potential role of the circadian regulated NATs we
detected with similar expression to their corresponding sense
transcripts. The use of reverse transcriptase to generate the
array probe has been shown to generate artifacts in the form
of fragments antisense to coding sequences presumably
derived from self priming or mispriming by other fragments
[62,63]. This bias, if real, would have to be sequence specific,
or it would be ubiquitous across genes, which we do not see.
Considering splice junctions are not palindromic, NATs
spliced in a similar fashion to sense transcripts, and exhibit-
ing nearly identical expression patterns, are generally arti-
facts. At the same time, extensive anti-correlated expression
of cis-NAT pairs resulting in subsequent siRNA has been
observed in Arabidopsis, but this is only a trend and many do
not adhere to this rule [27,64,65]. As with miRNA, observa-
tions at the whole genome level without genetic experimenta-
tion might not resolve a complex relationship between sense
and antisense pairs. However, consistent with the detection
of rhythmic introns in otherwise arrhythmic genes, we
detected 813 instances of rhythmic cis-NATs with an arrhyth-
mic corresponding sense strand transcript (Table S6 in Addi-
tional data file 4). In these examples, there was obviously no
anti-correlated sense strand pattern resolved, and the
absence of a circadian-regulated coding transcript argues
against the NATs as experimental artifacts, as do the nearly
8,000 NATs detected by Stolc et al[66] that exhibited greater
hybridization intensity on the antisense strand than the sense
strand in Arabidopsis cell cultures. The overall phase distri-
bution of the NATs, regardless of sense strand cycling, was
clearly distinct from the coding transcript phase distribution
mentioned earlier (Figure 5a). Rather than an overrepresen-
tation of rhythmic transcripts just prior to dawn and dusk,
NATs, as with rhythmic sense strand introns (Figure 5c), are
enriched towards the morning.
Circadian clock regulation of intergenic regions
Numerous regions (n = 1,052) not annotated as expressed
portions of the genome in TAIR7 exhibited circadian behavior
(Tables S7 in Additional data file 4). These areas consist of
several different classes. The first are simple annotation
errors, where the array hybridization implies a larger tran-
script than that found in the annotation. Criteria to identify
this type are that they are immediately adjacent features to
the annotated transcript with a similar phase of expression,
such as PRR3 and FKF1, which have three and two cycling
intergenic features that would extend the annotation of the 3'
end by at least 147 bp each (Figures 2d and 4a). A second class
of cycling intergenic regions has supportive expressed
sequence tag evidence that is not incorporated into the formal
annotation. These include protein coding transcripts as well
as ncRNAs [67]. Perhaps the most interesting regions are
those with scant or no support from expressed sequence tags
or previous tiling array efforts [14,66]. For example, a region
of at least 350 bp on chromosome 5 (6,839,029 bp to
6,839,383 bp) is rhythmic, and a coding or functional non-
coding transcript is not evident (Figure 6d).
Conclusions
Numerous forms of ncRNA are well known to be an integral
part of genomes, yet many of these transcripts, described here
and by others, detected by tiling arrays in several organisms
fail to qualify as a functionally characterized ncRNA type [8].
Genome-wide transcription studies have forced a new para-
digm of genome organization where most of the genome is
expressed, yet often with an unknown function (see, for
example, [68]). In addition to documenting the existence of
such transcripts, we have described a very specific rhythmic
expression behavior that is likely controlled by only a small
number of genes making up the Arabidopsis circadian clock
[31]. The patterns within this study alone strongly suggest
these are meaningful expression patterns. For example, anti-
sense transcripts often exhibited very different expression
patterns from sense strand transcripts. Also, genes classified
as pseudogenes/transposons are severely underrepresented
among circadian regulated transcripts, both on sense and
antisense strands. Thus, mechanisms of clock regulation were
either not maintained with loss of gene function or did not
spontaneously occur, suggesting that the novel rhythmic
transcription described within is functional.
Materials and methods
Plant materials and sample preparation
Seedlings of Arabidopsis thaliana accession Col-0 were
grown on MS media (supplemented with 2% D-glucose and
solidified with 1% agar) 7 days in 12 h light:12 h dark cycles
under white fluorescent bulbs at 100 mol m
-2
s
-1
before
release to constant light and temperature. Samples were col-
lected every 4 h beginning at the time of lights on, ZT0. RNA
was extracted by using the Qiagen (Valencia, CA, USA) RNe-
asy Plant Mini Kit. Labeled cRNA probes were synthesized
according to standard Affymetrix (Santa Clara, CA, USA) pro-
tocol.
Array design and annotation
We used high-density oligonucleotide GeneChip
®
Arabidop-
sis Tiling 1.0R and 1.0F arrays. Each array is composed of
more than 3.2 million 25-bp perfect match features along
with corresponding mismatch features of either the Watson
(1.0F) or Crick (1.0R) sequence strand. On average, each
probe was spaced every 35 bp of genome sequence. As previ-
ously described [69], perfect match probes from the Arabi-
dopsis Tiling 1.0F array were megablasted against the
Arabidopsis genome release version 7 (TAIR7) [30] including
mitochondria and chloroplast sequences with word size 8
and E-value 0.01. Single perfect matches, without a second
partial match of >18/25 bp, were selected, giving a total of
1,683,620 unique features. These were mapped to annotated
mRNAs as intron, exon, inter-genic region, or flanking probes
Genome Biology 2009, Volume 10, Issue 2, Article R17 Hazen et al. R17.10
Genome Biology 2009, 10:R17
that span an annotated boundary. Background correction and
quantile normalization were performed separately on the for-
ward and reverse strand arrays using the affy Bioconductor
package in R according to Bolstad et al[70]. The Affymetrix
AtTILE1 Genechip data (.CEL files) have been deposited at
the Gene Expression Omnibus [GEO:GSE13814].
Fourier/spectral analysis
Hybridization efficiencies of oligonucleotide probes on tiling
arrays vary considerably and some probes tend to be unre-
sponsive. Thus, to avoid spurious decreases of signal in the
spectral analysis from poorly responsive probes, we filtered
out probes that are lowly expressed (mean <3) and further-
more show very little variation (standard deviation < 0.25)
across the time series, leaving a total of 1,609,258 features
between both the forward and reverse strand arrays. The 12
measurements for each probe were standardized and Fourier
analysis was used to evaluate the RNA expression pattern
over the 2-day time course [71]. To exploit redundancy of fea-
tures, we grouped all probes for the same exon based on the
TAIR7 genome annotation [30], or applied 200-bp windows
centered on each intronic or intergenic probe position while
stopping at exon boundaries. We then computed the 24-hour
spectral power F24 from the average of the standardized
probes within a group, following Wijnen et al[71]. To assess
the significance of these F24 scores, we built empirical null
distributions that take into account the number of probes
(weight) that went into the calculation of the spectral power.
The family of null distributions was calibrated from the distri-
bution of scores of all probes annotated as intergenic. We par-
ametrized these distributions as exponential functions, which
gave excellent fits (Additional data file 6). The p-values for all
features were then computed from the fitted distributions.
The labeling method, which used oligo dT for first strand
amplification of the RNA, produces 3' biased probes; there-
fore, any annotation unit with at least two features satisfying
p < 0.005 was considered circadian regulated. For Figure 2,
the phases for genes were computed from the circular aver-
ages of the phase in individual exons using CIRCSTAT [72].
Abbreviations
NAT: natural antisense transcript; miRNA: microRNA;
ncRNA: noncoding RNA; QRT-PCR: quantitative reverse
transcriptase PCR; siRNA: short interfering RNA; snoRNA:
small nucleolar RNA; TAIR: The Arabidopsis Information
Resource.
Authors' contributions
SPH and SAK conceived the study. SPH and JMG carried out
the experiments. FN, TQ, JOB, and SPH analyzed the data.
SPH, FN, JOB, and SAK drafted the manuscript. JOB, HC,
and JRE and carried out the array annotation and web inter-
face support. All authors read and approved the final manu-
script.
Additional data files
The following additional data are available with the online
version of this paper. Additional data files 1 and 2 are tables
listing the spectral analysis of each microarray time course.
Additional data file 3 is a figure comparing the spectral anal-
ysis of a gene array time course with the tiling array time
course. Additional data file 4 is a series of tables extracted
from the spectral analysis. Additional data file 5 is a series of
figures demonstrating experimental verification of observa-
tions made with the tiling arrays. Additional data file 6 is a fig-
ure of the distributions of the exponential functions from the
spectral analysis.
Additional data file 1Spectral analysis of each microarray time courseSpectral analysis of each microarray time course.Click here for fileAdditional data file 2Spectral analysis of each microarray time courseSpectral analysis of each microarray time course.Click here for fileAdditional data file 3Spectral analysis of a gene array time course with the tiling array time courseSpectral analysis of a gene array time course with the tiling array time course.Click here for fileAdditional data file 4Supplementary tables on the spectral analysisSupplementary tables on the spectral analysis.Click here for fileAdditional data file 5Experimental verification of observations made with the tiling arraysExperimental verification of observations made with the tiling arrays.Click here for fileAdditional data file 6Distributions of the exponential functions from the spectral analy-sisDistributions of the exponential functions from the spectral analy-sis.Click here for file
Acknowledgements
We thank members of The Scripps Research Institute DNA Microarray
Core Facility and Steve Head for expert assistance. We thank Ghislain Bre-
ton, Takato Imaizumi, Jose Pruneda-Paz, and Brenda Chow for critical com-
ments on the manuscript.
References
1. Woelfle M, Ouyang Y, Phanvijhitsiri K, Johnson C: The adaptive
value of circadian clocks: an experimental assessment in
cyanobacteria. Curr Biol 2004, 14:1481-1486.
2. Dodd A, Salathia N, Hall A, Kevei E, Toth R, Nagy F, Hibberd J, Millar
A, Webb A: Plant circadian clocks increase photosynthesis,
growth, survival, and competitive advantage. Science 2005,
309:630-633.
3. Young MW, Kay SA: Time zones: a comparative genetics of cir-
cadian clocks. Nat Rev Genet 2001, 2:702-715.
4. Harmer S, Hogenesch J, Straume M, Chang H, Han B, Zhu T, Wang
X, Kreps J, Kay S: Orchestrated transcription of key pathways
in Arabidopsis by the circadian clock. Science 2000,
290:2110-2113.
5. Panda S, Antoch MP, Miller BH, Su AI, Schook AB, Straume M, Schultz
PG, Kay SA, Takahashi JS, Hogenesch JB: Coordinated transcrip-
tion of key pathways in the mouse by the circadian clock. Cell
2002, 109:307-320.
6. Wijnen H, Naef F, Boothroyd C, Claridge-Chang A, Young MW:
Control of daily transcript oscillations in Drosophila by light
and the circadian clock. PLoS Genet 2006, 2:e39.
7. Mockler TC, Chan S, Sundaresan A, Chen H, Jacobsen SE, Ecker JR:
Applications of DNA tiling arrays for whole-genome analy-
sis. Genomics 2005, 85:1-15.
8. Willingham AT, Gingeras TR: TUF love for "junk" DNA. Cell
2006, 125:1215-1220.
9. Johnson JM, Edwards S, Shoemaker D, Schadt EE: Dark matter in
the genome: evidence of widespread transcription detected
by microarray tiling experiments. Trends Genet 2005,
21:93-102.
10. Manak JR, Dike S, Sementchenko V, Kapranov P, Biemar F, Long J,
Cheng J, Bell I, Ghosh S, Piccolboni A, Gingeras TR: Biological func-
tion of unannotated transcription during the early develop-
ment of Drosophila melanogaster. Nat Genet 2006, 38:1151-1158.
11. He H, Wang J, Liu T, Liu XS, Li T, Wang Y, Qian Z, Zheng H, Zhu X,
Wu T, Shi B, Deng W, Zhou W, Skogerbo G, Chen R: Mapping the
C. elegans noncoding transcriptome with a whole-genome
tiling microarray. Genome Res 2007, 17:1471-1477.
12. Selinger DW, Cheung KJ, Mei R, Johansson EM, Richmond CS, Blat-
tner FR, Lockhart DJ, Church GM: RNA expression analysis using
a 30 base pair resolution Escherichia coli genome array. Nat
Biotechnol 2000, 18:1262-1268.
13. Shoemaker D, Schadt E, Armour C, He Y, Garrett-Engele P, McDon-
agh P, Loerch P, Leonardson A, Lum P, Cavet G: Experimental
annotation of the human genome using microarray technol-
ogy. Nature 2001, 409:922-927.
14. Yamada K, Lim J, Dale J, Chen H: Empirical analysis of transcrip-
tional activity in the Arabidopsis genome. Science 2003,
302:842.
15. Li L, Wang X, Stolc V, Li X, Zhang D, Su N, Tongprasit W, Li S, Cheng
Genome Biology 2009, Volume 10, Issue 2, Article R17 Hazen et al. R17.11
Genome Biology 2009, 10:R17
Z, Wang J, Deng XW: Genome-wide transcription analyses in
rice using tiling microarrays. Nat Genet 2006, 38:124-129.
16. Stolc V, Gauhar Z, Mason C, Halasz G, van Batenburg MF, Rifkin SA,
Hua S, Herreman T, Tongprasit W, Barbano PE, Bussemaker HJ,
White KP: A gene expression map for the euchromatic
genome of Drosophila melanogaster. Science 2004, 306:655-660.
17. Cawley S, Bekiranov S, Ng H, Kapranov P, Sekinger E, Kampa D, Pic-
colboni A, Sementchenko V, Cheng J, Williams A: Unbiased map-
ping of transcription factor binding sites along human
chromosomes 21 and 22 points to widespread regulation of
noncoding RNAs. Cell 2004, 116:499-509.
18. Tjaden B, Saxena R, Stolyar S, Haynor D, Kolker E, Rosenow C:
Transcriptome analysis of Escherichia coli using high-density
oligonucleotide probe arrays. Nucleic Acids Res 2002,
30:3732-3738.
19. David L, Huber W, Granovskaia M, Toedling J, Palm CJ, Bofkin L,
Jones T, Davis RW, Steinmetz LM: A high-resolution map of tran-
scription in the yeast genome. Proc Natl Acad Sci USA 2006,
103:5320-5325.
20. Stolc V, Samanta MP, Tongprasit W, Marshall WF: Genome-wide
transcriptional analysis of flagellar regeneration in
Chlamydomonas reinhardtii identifies orthologs of ciliary dis-
ease genes. Proc Natl Acad Sci USA 2005, 102:3703-3707.
21. Kampa D, Cheng J, Kapranov P, Yamanaka M, Brubaker S, Cawley S,
Drenkow J, Piccolboni A, Bekiranov S, Helt G: Novel RNAs identi-
fied from an in-depth analysis of the transcriptome of human
chromosomes 21 and 22. Genome Res 2004, 14:331-342.
22. Rinn J, Euskirchen G, Bertone P, Martone R, Luscombe N, Hartman
S, Harrison P, Nelson F, Miller P, Gerstein M: The transcriptional
activity of human chromosome 22. Genes Dev 2003,
17:529-540.
23. Schadt E, Edwards S, GuhaThakurta D, Holder D, Ying L, Svetnik V,
Leonardson A, Hart K, Russell A, Li G, Cavet G, Castle J, McDonagh
P, Kan Z, Chen R, Kasarskis A, Margarint M, Caceres R, Johnson J,
Armour C, Garrett-Engele P, Tsinoremas N, Shoemaker D:
A com-
prehensive transcript index of the human genome generated
using microarrays and computational approaches. Genome
Biol 2004, 5:R73.
24. Li L, Wang X, Sasidharan R, Stolc V, Deng W, He H, Korbel J, Chen
X, Tongprasit W, Ronald P, Chen R, Gerstein M, Wang Deng X: Glo-
bal identification and characterization of transcriptionally
active regions in the rice genome. PLoS ONE 2007, 2:e294.
25. Robinson SJ, Cram DJ, Lewis CT, Parkin IAP: Maximizing the effi-
cacy of SAGE analysis identifies novel transcripts in Arabi-
dopsis. Plant Physiol 2004, 136:3223-3233.
26. Meyers BC, Vu TH, Tej SS, Ghazal H, Matvienko M, Agrawal V, Ning
J, Haudenschild CD: Analysis of the transcriptional complexity
of Arabidopsis thaliana by massively parallel signature
sequencing. Nat Biotechnol 2004, 22:1006-1011.
27. Wang X, Gaasterland T, Chua N: Genome-wide prediction and
identification of cis-natural antisense transcripts in Arabidop-
sis thaliana. Genome Biol 2005, 6:R30.
28. Mattick J, Makunin I: Non-coding RNA. Hum Mol Genet 2006,
15:R17-R29.
29. Maxfield Boumil R, Lee JT: Forty years of decoding the silence in
X-chromosome inactivation. Hum Mol Genet 2001,
10:2225-2232.
30. Swarbreck D, Wilks C, Lamesch P, Berardini T, Garcia-Hernandez M,
Foerster H, Li D, Meyer T, Muller R, Ploetz L, Radenbaugh A, Singh S,
Swing V, Tissier C, Zhang P, Huala E: The Arabidopsis Information
Resource (TAIR): gene structure and function annotation.
Nucleic Acids Res 2008, 36:D1009-D1014.
31. Gardner MJ, Hubbard KE, Hotta CT, Dodd AN, Webb AA: How
plants tell the time. Biochem J 2006, 397:15-24.
32. Schultz TF, Kiyosue T, Yanovsky M, Wada M, Kay SA: A role for
LKP2 in the circadian clock of Arabidopsis. Plant Cell 2001,
13:2659-2670.
33. Ding Z, Millar AJ, Davis AM, Davis SJ: TIME FOR COFFEE encodes
a nuclear regulator in the Arabidopsis thaliana circadian
clock. Plant Cell 2007, 19:1522-1536.
34. Covington M, Harmer S: The circadian clock regulates auxin sig-
naling and responses in Arabidopsis. PLoS Biol 2007, 5:e222.
35. Michael TP, Mockler TC, Breton G, McEntee C, Byer A, Trout JD,
Hazen SP, Shen R, Priest HD, Sullivan CM, Givan SA, Yanovsky M,
Hong F, Kay SA, Chory J: Network discovery pipeline elucidates
conserved time-of-day-specific cis-regulatory modules. PLoS
Genet 2008, 4:e14.
36. Covington M, Maloof J, Straume M, Kay S, Harmer S: Global tran-
scriptome analysis reveals circadian regulation of key path-
ways in plant growth and development. Genome Biol 2008,
9:R130.
37. Arabidopsis Cyclome Expression Database [http://sig
nal.salk.edu/cgi-bin/cyclome]
38. Hicks KA, Millar AJ, Carre IA, Somers DE, Straume M, Meeks-Wag-
ner DR, Kay SA: Conditional circadian dysfunction of the Ara-
bidopsis early-flowering 3 mutant. Science 1996, 274:790-792.
39. Hicks KA, Albertson TM, Wagner DR: EARLY FLOWERING3
encodes a novel protein that regulates circadian clock func-
tion and flowering in Arabidopsis. Plant Cell 2001, 13:1281-1292.
40. The FANTOM Consortium, Carninci P, Kasukawa T, Katayama S,
Gough J, Frith MC, Maeda N, Oyama R, Ravasi T, Lenhard B, Wells C,
Kodzius R, Shimokawa K, Bajic VB, Brenner SE, Batalov S, Forrest
ARR, Zavolan M, Davis MJ, Wilming LG, Aidinis V, Allen JE, Ambesi-
Impiombato A, Apweiler R, Aturaliya RN, Bailey TL, Bansal M, Baxter
L, Beisel KW, Bersano T, et al.: The transcriptional landscape of
the mammalian genome. Science 2005, 309:1559-1563.
41. Nagasaki H, Arita M, Nishizawa T, Suwa M, Gotoh O: Species-spe-
cific variation of alternative splicing and transcriptional initi-
ation in six eukaryotes. Gene 2005, 364:53-62.
42. Ner-Gaon H, Fluhr R: Whole-genome microarray in Arabidop-
sis facilitates global analysis of retained introns. DNA Res 2006,
13:111-121.
43. Ner-Gaon H, Halachmi R, Savaldi-Goldstein S, Rubin E, Ophir R, Fluhr
R: Intron retention is a major phenomenon in alternative
splicing in Arabidopsis. Plant J 2004, 39:877-885.
44. Staiger D: RNA-binding proteins and circadian rhythms in Ara-
bidopsis thaliana. Phil Trans R Soc B 2001, 356:1755-1759.
45. Chapman EJ, Carrington JC: Specialization and evolution of
endogenous small RNA pathways. Nat Rev Genet 2007,
8:884-896.
46. Valoczi A, Varallyay E, Kauppinen S, Burgyan J, Havelda Z: Spatio-
temporal accumulation of microRNAs is highly coordinated
in developing plant tissues. Plant J 2006, 47:140-151.
47. Xie Z, Allen E, Fahlgren N, Calamar A, Givan SA, Carrington JC:
Expression of Arabidopsis MIRNA Genes. Plant Physiol 2005,
138:2145-2154.
48. Rhoades MW, Reinhart BJ, Lim LP, Burge CB, Bartel B, Bartel DP:
Prediction of plant microRNA targets. Cell 2002, 110:513-520.
49. Teale WD, Paponov IA, Palme K: Auxin in action: signalling,
transport and the control of plant growth and development.
Nat Rev Mol Cell Biol 2006, 7:847-859.
50. Liu P-P, Montgomery T, Fahlgren N, Kasschau K, Nonogaki H, Car-
rington J: Repression of AUXIN RESPONSE FACTOR10 by
microRNA160 is critical for seed germination and post-germi-
nation stages. Plant J 2007, 52:133-146.
51. Jones-Rhoades MW, Bartel DP: Computational identification of
plant microRNAs and their targets, including a stress-
induced miRNA. Mol Cell 2004, 14:787-799.
52. Wu M-F, Tian Q, Reed JW:
Arabidopsis microRNA167 controls
patterns of ARF6 and ARF8 expression, and regulates both
female and male reproduction. Development 2006,
133:4211-4218.
53. Levine E, Zhang Z, Kuhlman T, Hwa T: Quantitative characteris-
tics of gene regulation by small RNA. PLoS Biol 2007, 5:e229.
54. Williams L, Carles CC, Osmont KS, Fletcher JC: A database analy-
sis method identifies an endogenous trans-acting short-
interfering RNA that targets the Arabidopsis ARF2, ARF3, and
ARF4 genes. Proc Natl Acad Sci USA 2005, 102:9703-9708.
55. Garcia D, Collier SA, Byrne ME, Martienssen RA: Specification of
leaf polarity in Arabidopsis via the trans-acting siRNA path-
way. Curr Biol 2006, 16:933-938.
56. Adenot X, Elmayan T, Lauressergues D, Boutet S, BouchÈ N, Gasciolli
V, Vaucheret H: DRB4-dependent TAS3 trans-acting siRNAs
control leaf morphology through AGO7. Curr Biol 2006,
16:927-932.
57. Fahlgren N, Montgomery TA, Howell MD, Allen E, Dvorak SK, Alex-
ander AL, Carrington JC: Regulation of AUXIN RESPONSE
FACTOR3 by TAS3 ta-siRNA affects developmental timing
and patterning in Arabidopsis. Curr Biol 2006, 16:939-944.
58. Montgomery TA, Howell MD, Cuperus JT, Li D, Hansen JE, Alexander
AL, Chapman EJ, Fahlgren N, Allen E, Carrington JC: Specificity of
ARGONAUTE7-miR390 interaction and dual functionality in
TAS3 trans-acting siRNA formation. Cell 2008, 133:128-141.
59. Nozue K, Covington M, Duek P, Lorrain S, Fankhauser C, Harmer S,
Maloof J: Rhythmic growth explained by coincidence between
internal and external cues. Nature 2007, 448:358-361.
Genome Biology 2009, Volume 10, Issue 2, Article R17 Hazen et al. R17.12
Genome Biology 2009, 10:R17
60. Kiss TS: Small nucleolar RNAs: an abundant group of noncod-
ing RNAs with diverse cellular functions. Cell 2002,
109:145-148.
61. Kramer C, Loros JJ, Dunlap JC, Crosthwaite SK: Role for antisense
RNA in regulating circadian clock function in Neurospora
crassa. Nature 2003, 421:948-952.
62. Perocchi F, Xu Z, Clauder-Munster S, Steinmetz LM: Antisense arti-
facts in transcriptome microarray experiments are resolved
by actinomycin D. Nucl Acids Res 2007, 35:e128.
63. Wu J, Du J, Rozowsky J, Zhang Z, Urban A, Euskirchen G, Weissman
S, Gerstein M, Snyder M: Systematic analysis of transcribed loci
in ENCODE regions using RACE sequencing reveals exten-
sive transcription in the human genome. Genome Biol 2008,
9:R3.
64. Jin H, Vacic V, Girke T, Lonardi S, Zhu J-K: Small RNAs and the
regulation of cis-natural antisense transcripts in Arabidopsis.
BMC Mol Biol 2008, 9:6.
65. Henz S, Cumbie J, Kasschau K, Lohmann J, Carrington J, Weigel D,
Schmid M: Distinct expression patterns of natural antisense
transcripts in Arabidopsis. Plant Physiol 2007, 144:1247-1255.
66. Stolc V, Samanta MP, Tongprasit W, Sethi H, Liang S, Nelson DC,
Hegeman A, Nelson C, Rancour D, Bednarek S, Ulrich EL, Zhao Q,
Wrobel RL, Newman CS, Fox BG, Phillips GN, Markley JL, Sussman
MR: Identification of transcribed sequences in Arabidopsis
thaliana by using high-resolution genome tiling arrays. Proc
Natl Acad Sci USA 2005, 102:4453-4458.
67. Riano-Pachon D, Dreyer I, Mueller-Roeber B: Orphan transcripts
in Arabidopsis thaliana: identification of several hundred pre-
viously unrecognized genes. Plant J 2005, 43:
205-212.
68. Kapranov P, Willingham A, Gingeras T: Genome-wide transcrip-
tion and the implications for genomic organization. Nat Rev
Genet 2007, 8:413-423.
69. Zhang X, Shiu S, Cal A, Borevitz JO: Global analysis of genetic,
epigenetic and transcriptional polymorphisms in Arabidopsis
thaliana using whole genome tiling arrays. PLoS Genet 2008,
4:e1000032.
70. Bolstad BM, Irizarry RA, Astrand M, Speed TP: A comparison of
normalization methods for high density oligonucleotide
array data based on variance and bias. Bioinformatics 2003,
19:185-193.
71. Wijnen H, Naef F, Young MW, Michael WY: Molecular and statis-
tical tools for circadian transcript profiling. In Methods in Enzy-
mology Volume 393. Academic Press; 2005:341-365.
72. Cox NJ: CIRCSTAT: Stata modules to calculate circular sta-
tistics. [ />