Báo cáo y học: "Uncovering metabolic pathways relevant to phenotypic traits of microbial genomes" pptx
Bạn đang xem bản rút gọn của tài liệu. Xem và tải ngay bản đầy đủ của tài liệu tại đây (705.03 KB, 25 trang )
Genome Biology 2009, 10:R28
Open Access
2009Kastenmülleret al.Volume 10, Issue 3, Article R28
Method
Uncovering metabolic pathways relevant to phenotypic traits of
microbial genomes
Gabi Kastenmüller
*
, Maria Elisabeth Schenk
*
, Johann Gasteiger
†‡
and
Hans-Werner Mewes
*§
Addresses:
*
Institute of Bioinformatics and Systems Biology, Helmholtz Zentrum München - German Research Center for Environmental
Health, Ingolstädter Landstraße, D-85764 Neuherberg, Germany.
†
Computer-Chemie-Centrum, Universität Erlangen-Nürnberg,
Nägelsbachstraße, D-91052 Erlangen, Germany.
‡
Molecular Networks GmbH, Henkestraße 91, D-91052 Erlangen, Germany.
§
Chair for
Genome-oriented Bioinformatics, Technische Universität München, Life and Food Science Center Weihenstephan, Am Forum 1, D-85354
Freising-Weihenstephan, Germany.
Correspondence: Gabi Kastenmüller. Email:
© 2009 Kastenmüller et al.; licensee BioMed Central Ltd.
This is an open access article distributed under the terms of the Creative Commons Attribution License ( which
permits unrestricted use, distribution, and reproduction in any medium, provided the original work is properly cited.
Microbial metabolic pathways<p>A new machine learning-based method is presented here for the identification of metabolic pathways related to specific phenotypes in multiple microbial genomes.</p>
Abstract
Identifying the biochemical basis of microbial phenotypes is a main objective of comparative
genomics. Here we present a novel method using multivariate machine learning techniques for
comparing automatically derived metabolic reconstructions of sequenced genomes on a large scale.
Applying our method to 266 genomes directly led to testable hypotheses such as the link between
the potential of microorganisms to cause periodontal disease and their ability to degrade histidine,
a link also supported by clinical studies.
Background
Understanding complex phenotypic phenomena at the
molecular level is a major goal in the post-genomic era. In
particular, disease-related phenotypes of microorganisms are
of interest, as a clear understanding of the underlying molec-
ular processes can help to develop new drug/target combina-
tions. Besides the phenotypes that directly cause particular
diseases, another type of association, health-related pheno-
types - where microorganisms living in a particular habitat
(such as the human oral cavity or gut) affect human health -
attracts more and more interest in this context [1-6].
In previous studies it has been shown that comparative
genome analysis is well suited to assess interesting gene-phe-
notype associations for several phenotypic traits, such as
hyperthermophily [7,8], flagellar motility [8-11], Gram-nega-
tivity [10-12], oxygen respiration [10,11], endospore forma-
tion [10,11], intracellularity [10] and for a variety of
phenotypes extracted from the literature [13]. Except for the
methods described by Slonim et al. [10] and Tamura and
D'haeseleer [11], these methods do not provide any informa-
tion on the biochemical context of the identified genes. Slo-
nim et al. [10] clustered the genes associated with a
phenotype and demonstrated that many of these clusters
(gene modules) correspond to known metabolic or signaling
pathways. Tamura and D'haeseleer [11] formed association
networks of COGs (the National Center for Biotechnology
Information's Clusters of Orthologous Groups of proteins
[14]) based on multiple-to-one associations of COGs and phe-
notypes. These networks can be considered as functional
modules.
In analogy to the concept of phylogenetic profiles introduced
by Pellegrini et al. [15], the approaches mentioned above are
based on the assumption that genomes that share a pheno-
typic property also share a set of orthologous genes. This
Published: 10 March 2009
Genome Biology 2009, 10:R28 (doi:10.1186/gb-2009-10-3-r28)
Received: 25 August 2008
Revised: 12 February 2009
Accepted: 10 March 2009
The electronic version of this article is the complete one and can be
found online at /> Genome Biology 2009, Volume 10, Issue 3, Article R28 Kastenmüller et al. R28.2
Genome Biology 2009, 10:R28
implies that this method will miss associations with pathways
if genes that catalyze the same sort of processes are not
homologous, or if the loss of a relevant metabolic function
results from the loss of different parts of a pathway. In these
cases, no common aspects among phenotypically related spe-
cies can be identified at the level of genes.
Recently, three systems have been described that provide
both information on phenotypic properties of genomes and
information on their metabolic pathways [16-18]. However,
the Genome Properties system [16] and the PUMA2 system
[17] list all pathways shared by the phenotypically related spe-
cies rather than extracting only those pathways that are, in
fact, associated with the phenotype. Therefore, the list con-
tains many pathways that are not typical of the trait, but are,
for example, very common in all genomes. Liu et al. [18] inte-
grated clinical microbiological laboratory characterizations of
bacterial phenotypes with various genomic databases, includ-
ing the KEGG (Kyoto Encyclopedia of Genes and Genomes)
pathway database [19]. The authors investigated univariate,
pairwise associations of these phenotypes with KEGG path-
ways using the hypergeometric distribution. The approach
thereby relies on the correlation of COGs [14] to phenotypes
[20] and on the mapping of COGs to pathways. The COG
database includes only manually annotated proteins, restrict-
ing the approach by Liu et al. to 59 prokaryotic organisms for
which a time-consuming manual annotation has been
achieved.
Our method goes beyond listing all pathways that are present
in species showing a specific phenotype, as it uncovers path-
way-phenotype associations. Based on the prediction and sta-
tistical analysis of metabolic pathways for 266 sequenced
genomes, our method automatically finds pathways that are
supposed to be relevant for a special phenotypic trait. Here,
relevant means that the absence or presence or, more gener-
ally, the degree of completeness of these pathways in a
genome is an important indicator for the trait. Moreover, our
method shifts the univariate, pairwise association analysis to
a multivariate analysis involving dependencies among path-
ways. In contrast to univariate statistics, multivariate statisti-
cal methods are able to identify pathways that are not
individually associated with the phenotypic trait but become
relevant in the context of other pathways. This allows for the
identification of sets of pathways associated with a phenotype
rather than individual pathway-phenotype associations.
Finally, our method completely relies on annotation that has
been automatically derived from genomic sequence data.
Thus, it is not limited by the bottleneck of manual genome
and protein annotation.
In general, shifting the focus of the analysis of phenotypes
from genes to metabolic pathways (and thus assuming that
genomes that share a phenotypic trait also share specific met-
abolic capabilities) not only facilitates functional interpreta-
tion of the results, but is also expected to be especially
advantageous in cases of convergent evolution of taxonomi-
cally unrelated species towards a phenotype, since, for these
species, sharing metabolic capabilities does not necessarily
imply sharing orthologous genes.
We demonstrate here that our method is well suited to
uncover the metabolic processes relevant for such phenotypic
traits. Investigating periodontal disease [21] as a phenotype
of the causative bacteria (which are taxonomically diverse),
we also demonstrate that our method allows direct generation
of hypotheses about the mechanism of the disease. These
hypotheses are in good agreement with clinical studies and
can give hints to new targets for the antibacterial treatment of
periodontal disease. We also show that the identified relevant
pathways can be used to classify genomes into traits with high
selectivity. This classification goes beyond the assignment of
functions to individual genes and the analysis of their phylo-
genetic profiles. Considering the growing number of sequenc-
ing projects on microorganisms and microbial ecosystems,
the biochemical classification of genomes will become a valu-
able technique for the interpretation of genomic data.
Results
In order to reveal a set of metabolic features typical of a phe-
notypic trait, we compared the completeness of metabolic
pathways in genomes showing a particular phenotype and in
genomes lacking it. For the comparison of metabolic path-
ways in different genomes, we had to consider that most
known pathways (reference pathways) have been experimen-
tally investigated only for a few model organisms. Many
microbial organisms, pathogens in particular, are difficult to
cultivate in the laboratory. Thus, a comparative method has
to rely on metabolic reconstructions of completely sequenced
genomes. Here, metabolic reconstruction means prediction
of the metabolic complement of a genome in terms of refer-
ence pathways based exclusively on its genomic sequence
information.
Assessing the metabolic complements of completely
sequenced genomes, therefore, represents the first of the
three major steps of our approach. For each phenotype under
consideration, we then selected the subset of metabolic path-
ways that are most relevant in distinguishing the genomes
showing the phenotype and the genomes lacking it. For this
step we used (multivariate) statistical attribute selection
methods. In a third step, we cross-checked the resulting sets
of relevant pathways by classifying the genomes (into those
showing a specific phenotype and those lacking it) based only
on our predictions for the relevant pathways in the respective
genomes. Figure 1 shows an overview of the method deline-
ated in the following. A detailed description of each of its
three steps is given in Materials and methods.
Genome Biology 2009, Volume 10, Issue 3, Article R28 Kastenmüller et al. R28.3
Genome Biology 2009, 10:R28
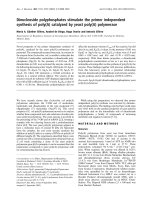
Overview of the approachFigure 1
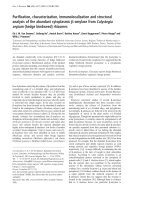
Overview of the approach. The three major steps of our approach are: metabolic reconstruction of completely sequenced genomes resulting in pathway
profiles; pathway selection resulting in lists of pathways ranked by relevance; and cross-checking of the resulting pathway rankings by classification in order
to estimate their significance (Figure S1 in Additional data file 2).
Step 1
Step 3
Step 2
5101520
0.0
0.2
0.4
0.6
0.8
1.0
random
reliefF
wrapper_naiveBayes
SVMAttributeEval
P1 P7P4 P6P5P3P2 P8
P. a
A.f
no
no
no
Ph.
1. Carbohydrate metabolism and citric acid cycle
2. Amino acids and derivatives
3. Tetrapyrroles
4. Lipids
1. Fatty acids
2. Triacylglycerols
3. Phospholipids
1. Biosynthesis of cardiolipin
2. Biosynthesis of phosphatidylinositol
3. Biosynthesis of phosphatidylserine
5. Steroids
reference pathway:
phospholipids3: R1,R2
score(p)
PSS_ECOLI
EC 2.7.8.8
PSS_ECOLI
D + E
organism
specific
reaction
enzymatic
reaction
template
(BioPath)
A
B + C
EC 4.1.1.55
R2
in 3 paths
B + C
A
EC 4.1.1.55
PSD_ECOLI
annotated
EC number
(PEDANT)
PSD_ECOLI
F + G
EC 2.7.8.8
R1
in 1 path
F + G D + E
M. mazei
M. kandleri
P. abyssi
Methanogenic
Path1 Path2 Path3 Path4 Path5 Path6 Path7 Path8
0.8
0.8 0.8
0.8
0.9
1.0
0.9
0.3
0.0
0.1
0.0
1.0
0.2
0.0
0.0
1.0
0.2
0.1
0.1
0.90.4
0.6
0.3
1.0
0.2
0.3
0.9
yes
yes
no
1. P2 (methane1)
2. P6 (phospholipids1)
3. P30 (fa2)
4. P179 (threonine2)
290. P8 (ppc2)
1. P2 (methane1)
2. P56 (lysine3)
3. P211 (coa1)
1. P2 (methane1)
2. P6 (phospholipids1)
3. P13 (aminosugars4)
4. P25 (pyrrole3)
290. P4 (bilepigments4)
P1 P7P4 P6P5P3P2 P8
M.m
M.k
M.l
yes
yes
yes
Ph.
5 101520
0.0
0.2
0.4
0.6
0.8
1.0
random
reliefF
wrapper_naiveBayes
SVMAttributeEval
1. P2 (methane1)
2.
3. P13 (aminosugars4)
4. P25 (pyrrole3)
5.
1. P2 (methane1)
2. P
3. P30 (fa2)
4. P179 (threonine2)
5.
1. P2 (methane1)
2. P56 (lysine3)
3. P211 (coa1)
pathway profiles
266 annotated,
completely sequenced
genomes (PEDANT)
reaction and
pathway data
(BioPath)
score based
metabolic reconstruction
phenotype
ReliefF
wrapper
SVMAttributeEval
pathway selection
literature/web
search (manual)
Χ
phenotype not or
weakly associated
with pathways
√
relevant pathways
for phenotype
list/subset of pathways ranked by relevance
cross-check
by classification
(see Fig. S1)
Genome Biology 2009, Volume 10, Issue 3, Article R28 Kastenmüller et al. R28.4
Genome Biology 2009, 10:R28
Automatic metabolic reconstruction
In order to demonstrate the robustness of our machine learn-
ing approach, we based our analyses on a comparatively sim-
ple metabolic reconstruction procedure using automatic
Enzyme Commission (EC) number [22] annotations. EC
numbers for proteins and reactions are provided by most
(automatic) annotation systems and most collections of refer-
ence pathways. Thus, the data basis used for our analyses can
be considered as the least common denominator of such sys-
tems and collections.
In our studies, we compared the metabolic reconstructions of
genomes on a large scale. In order to guarantee the compara-
bility of the genomes' reconstructions, the EC number anno-
tations on which the reconstructions are based had to be
standardized, that is, derived by the same means for all
genomes. (In cases of non-uniform annotations, we might
select pathways that, for example, are more relevant in distin-
guishing annotation systems or authors than they are in dis-
tinguishing phenotypes.) The PEDANT system [23] provides
standardized automatic genome and protein annotations for
a large number of genomic sequences (see Materials and
methods). For our analyses, we used all 266 completely
sequenced genomes (28 eukaryotes, 23 archaea, 215 bacteria)
that had been automatically annotated by PEDANT at the
time of our study.
Based on the EC number assignments provided in PEDANT,
we assessed the metabolic complement of each genome by
scoring the completeness of each reference pathway (out of a
set of reference pathways, which are defined by the EC num-
bers of the reactions involved) for the respective genomes.
This reconstruction method is similar to the PathoLogic algo-
rithm [24], which is used for the reconstructions in BioCyc
[25]. In analogy to PathoLogic, our prediction procedure con-
siders the ratio of enzymes in a pathway that are encoded in
the genome and the uniqueness of these enzymes with respect
to their occurrence in other pathways. (PathoLogic addition-
ally uses the following criterion for pathway prediction: deg-
radation and biosynthesis processes are considered as
present only if the last two reaction steps or the first two reac-
tion steps, respectively, are present.) In contrast to Patho-
Logic, our method results in a single score value for each
reference pathway estimating the probability of the pathway
to be present in a certain genome. Based on these pathway
scores, the metabolic reconstruction of a genome can be rep-
resented by a numeric vector of scores in the form of a 'path-
way profile'. On the one hand, this representation facilitates
the comparison of metabolic capabilities by statistical meth-
ods. On the other hand, using the pathway score instead of a
simple binary value (which can only indicate the presence or
absence of a pathway in a genome) is advantageous for the
analysis of parasitic genomes. Since these genomes often
cover only parts of known reference pathways, a decision
about presence or absence is often not appropriate. (Pathway
profiles containing binary values or the ratios of available
enzymes in pathways have been used in large scale analyses of
metabolic complements, such as the evolutionary analyses by
Liao et al. [26] and Hong et al. [27].)
Though our approach is not limited to a special pathway data-
base, the choice of the underlying database is a critical point
for any method that relies on pathway analysis. Green and
Karp [28] showed that the outcome of any pathway analysis
strongly depends on the conceptualization of the pathway
database applied. Based on their studies, the authors recom-
mended selecting the pathway database - and thus the con-
ceptualization - that fits to the idea of the analysis planned.
Our approach focuses on the comparative analysis of meta-
bolic capabilities of organisms. For this type of analysis, the
ability of an organism to degrade, for instance, L-histidine to
L-glutamate, is of more interest than the specific enzyme var-
iants used for this degradation. Thus, for our purposes, such
enzyme variants should be included in the same reference
pathway. In contrast, the degradation and the biosynthesis of
L-histidine correspond to different metabolic capabilities and
thus should be separated in distinct reference pathways.
(Degradation (biosynthesis) processes that result in (start
from) different products (educts) should also be separated in
this context.)
KEGG [19] and MetaCyc [29] presumably are the most com-
prehensive sources for reference pathways available to date.
KEGG provides a metabolite-centered, multi-organism view
of metabolic pathways. This implies that a single KEGG refer-
ence pathway typically comprises several organism-specific
enzyme variants in a single pathway. However, KEGG refer-
ence pathways as such are inapplicable for the kind of analy-
sis considered in our approach, since they combine too many
different biological processes, such as 'biosynthesis of L-histi-
dine' and 'degradation of L-histidine', in a single reference
pathway ('histidine metabolism'). MetaCyc pathways, on the
other hand, represent distinct biological processes, but each
pathway variant corresponds to a separate reference path-
way. As an example, the degradation of L-histidine to L-gluta-
mate is represented by three reference pathways in MetaCyc:
'histidine degradation I', 'histidine degradation II', and 'histi-
dine degradation III'. These pathways overlap in three of four
(or three of five in the case of histidine degradation II) reac-
tion steps. Thus, by using MetaCyc, the focus of our analysis
would slightly change to the identification of phenotype-
related pathway variants.
For our studies, we chose BioPath [30], a free, publicly avail-
able electronic representation of the well known Roche
Applied Science's Biochemical Pathways wall chart [31,32] as
the source for reference pathways. BioPath reference path-
ways include alternative enzyme variants. Different biological
processes, such as degradation and biosynthetic processes
related to the same metabolite, are separated into distinct ref-
erence pathways. Hence, BioPath matches the pathway con-
ceptualization required for our analysis. However, compared
Genome Biology 2009, Volume 10, Issue 3, Article R28 Kastenmüller et al. R28.5
Genome Biology 2009, 10:R28
to MetaCyc, BioPath is less comprehensive with respect to the
number of pathways and pathway variants.
Pathway selection using machine learning
Applying our metabolic reconstruction method, the compari-
son of the metabolic capabilities of genomes is reduced to the
comparison of their pathway profiles. However, due to the
high number of genomes (266 in PEDANT) and reference
pathways (290 in BioPath) it is almost impossible to sort out
the pathways that are most relevant just by visual inspection
of the profiles. Thus, we made use of machine learning meth-
ods in our approach. We applied statistical attribute selection
in order to automatically extract the pathways (attributes)
that are most relevant to a phenotype.
In general, attribute (here, pathway) selection results in a list
of attributes (here, pathways) ranked by their significance for
the distinction between instances (here, genomes repre-
sented by their pathway profiles) of class A (here, showing a
specific phenotype) and class B (here, lacking this pheno-
type). If the investigated phenotype is caused by or otherwise
related to special metabolic capabilities of genomes (and not
only to regulatory or other effects), the top-ranking pathways
are excellent indicators for functional peculiarities of the
trait. Thus, these pathways can be used for both the func-
tional classification of genomes and the interpretation of the
biochemical basis of the phenotype.
Different attribute selection methods focus on different
aspects of the data analyzed [33]. In order to get a reliable and
(biologically) comprehensive collection of phenotype-associ-
ated pathways, we applied three (multivariate) attribute
selection methods with different characteristics and joined
their results: the filter method ReliefF [34-36], the embedded
method SVMAttributeEval [37], and a wrapper method using
a naïve Bayes classifier [38]. In general, filters remove irrele-
vant attributes based on the intrinsic characteristics of the
data (that is, they remove attributes with low relevance
weights according to univariate (for example, gain ratio, chi
square) or multivariate (for example, ReliefF) criteria).
Wrappers, on the other hand, evaluate attributes by using
accuracy estimates provided by a certain classification algo-
rithm. Embedded methods are also specific to a given learn-
ing machine. But these methods select attribute subsets
during the training of the learning machine. ReliefF does not
remove statistically dependent attributes. As we are inter-
ested in all relevant pathways rather than in the smallest sub-
set of pathways providing the highest classification accuracy,
this makes ReliefF well suited for our purposes. In contrast
naïve Bayes is very sensitive to dependent attributes. There-
fore, a wrapper using naïve Bayes is expected to omit these
attributes. Thus, it should complement the results of ReliefF.
(For more details see Materials and methods.)
Cross-check of relevant pathways by classification
In order to estimate the significance of the pathway rankings
resulting from pathway selection for a phenotype, we cross-
checked the rankings by classifying the genomes (into those
showing the phenotype and those lacking it) based only on the
pathway scores for the selected pathways. In order to do so,
we represented the genomes by pathway profiles that have
been reduced to the best ranking 1, 2, 3, , 20 pathways.
These reduced pathway profiles (that is, vectors with 1, 2, 3,
, 20 dimensions) and the phenotypic information on the
genomes have been used as input for four different classifica-
tion algorithms (J48, IB1, naïve Bayes, and SMO). After
cross-validation, we compared the achieved classification
quality of the resulting classifiers to the quality reached by
classification based on all pathways (that is, complete path-
way profiles) and based on randomly chosen 1, 2, 3, , 20
pathways (average quality of 25 times). In order to assess the
quality of classification, we calculated the product of classifi-
cation selectivity and sensitivity. In addition, we determined
the receiver operating characteristic (ROC) area under the
curve (AUC) value; for details see Materials and methods.
Phenotypes that are not or only weakly associated with spe-
cific metabolic capabilities might, nonetheless, be developed
by species that are similar in their complete metabolism. In
this case any set of randomly picked pathways might have
nearly the same (high) predictive power as the selected ones.
Similarly, if a phenotype is due to any effect that is not cov-
ered by our method (for example, if there are many com-
pletely different metabolic patterns that lead to the same
phenotype or if the phenotype is related to regulatory effects),
we expect that the (in this case low) classification quality lies
within the same range for classification based on randomly
picked pathways, all pathways, and pathways highly ranked
in pathway selection. We are not able to associate (signifi-
cantly) relevant pathways with any of these types of pheno-
types. The results for the phenotype 'habitat: soil' using the
classifier IB1 are shown in Figure 2 (right) as an example of
such cases. As a consequence, we considered the high-rank-
ing pathways as relevant for the phenotype only if the follow-
ing applied to at least one of the four classifications: the
quality of classification based on the top-ranking pathways (i)
was considerably better than random, (ii) at least reached the
classification quality achieved for all pathways, and (iii) at
least reached a value of 0.6. As an example, Figure 2 (left)
shows the resulting classification quality values depending on
the number of considered pathways for the phenotype 'obli-
gate intracellular' using the nearest neighbor classifier (IB1).
Metabolic analysis of phenotypic traits
For our analyses, we used all 266 completely sequenced
genomes (28 eukaryotes, 23 archaea, 215 bacteria) that had
been automatically annotated by PEDANT at the time of our
study (see Materials and methods). For each genome, we col-
lected information about presence or absence of different
phenotypic traits related to Gram stain, oxygen usage, habitat
Genome Biology 2009, Volume 10, Issue 3, Article R28 Kastenmüller et al. R28.6
Genome Biology 2009, 10:R28
(soil, oral cavity), relation to diseases, and intracellularity.
(For the complete list of genomes and phenotypes see Addi-
tional data file 1.) To infer the metabolic complements of
these genomes, we applied our metabolic reconstruction
method to each genome using the automatic genome annota-
tion provided by PEDANT and the (organism unspecific)
metabolic reaction and pathway data given by BioPath (for
details see Materials and methods). The reconstruction
results in a 290-dimensional pathway profile for each
genome. Each dimension corresponds to the weighted com-
pleteness of a reference pathway described by a pathway
reconstruction score. This score is normalized to values rang-
ing from 0 (no reaction of the pathway is catalyzed) to 1 (path-
way is complete).
For each phenotype, we applied the attribute subset selection
methods ReliefF, SVMAttributeEval, and wrapper (naïve
Bayes) to the pathway profiles of the complete set of genomes.
After cross-validation we received a list of pathways
(attributes) ranked by the relevance of the pathway for each
selection method. Whereas ReliefF and SVMAttributeEval
provide a complete ranking of all pathways, the wrapper
yields partially ranked subsets of pathways. The results of
each attribute selection were cross-checked by classification
using IB1, J48, naïve Bayes, and SMO, respectively.
In the following, we first show the applicability of our method
for a relatively simple example, the phenotype 'methanogen-
esis'. This rare phenotype is mainly defined by the common
pathway of methanogenesis from H
2
and CO
2
. Thus, we
expected that our method would determine this pathway to be
the most relevant pathway. Then, we present our results for a
more sophisticated example, the phenotype 'periodontal dis-
ease causing'. The results for the phenotypes 'Gram-positive',
'obligate anaerobe', 'obligate intracellular', and 'habitat: soil'
are available in Additional data file 2.
Methanogenesis
Methanogens are strictly anaerobic archaea producing meth-
ane as a major product of their energy metabolism [39]. Apart
from methanogenesis, they are quite diverse in their meta-
bolic capabilities. Only six completely sequenced genomes
showing this phenotype are available within PEDANT (Meth-
anococcus jannaschii, Methanococcus maripaludis, Meth-
anopyrus kandleri AV19, Methanosarcina acetivorans C2A,
Methanosarcina mazei Goe1, Methanothermobacter ther-
moautotrophicus). Nonetheless, they cover all four phyloge-
netically different classes of methanogens: Methanobacteria,
Methanococci, Methanomicrobia, Methanopyri.
As expected, pathway selection and the following cross-check
for the complete dataset (266 genomes) of pathway profiles
confirmed that methanogenesis is reflected at the level of
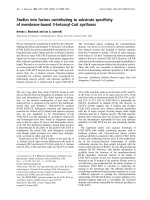
Estimating the significance of pathway rankings provided by pathway selectionFigure 2
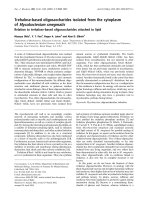
Estimating the significance of pathway rankings provided by pathway selection. For phenotypes that are weakly associated with the presence or absence of
specific metabolic pathways, the classification quality should be within the same range for classification based on randomly picked pathways (red), all
pathways (marked by a horizontal line), and pathways highly ranked in attribute subset selection (green, ReliefF; yellow, SVMAttributeEval; blue, wrapper
(naïve Bayes)). As an example, the right diagram shows the classification quality for the phenotype 'habitat: soil' (depending on the number of top-ranking
pathways used for classification). In this case, the top-ranking pathways provided by attribute subset selection are considered as not significant for the
phenotype. The left diagram shows the classification quality values for the phenotype 'obligate intracellular'. Using the most relevant pathways for
classification results in higher classification quality compared to using all pathways or randomly picked pathways. Furthermore, the quality values lie above
0.6. In this case, the most relevant pathways derived by attribute subset selection are considered as significant.
5 101520
0.0
0.2
0.4
0.6
0.8
1.0
obligate intracellular − IB1
#relevant pathways
sensitivity*selectivity
random
reliefF
wrapper_naiveBayes
SVMAttributeEval
5101520
0.0
0.2
0.4
0.6
0.8
1.0
soil − IB1
#relevant pathways
sensitivity*selectivity
random
reliefF
wrapper_naiveBayes
SVMAttributeEval
Genome Biology 2009, Volume 10, Issue 3, Article R28 Kastenmüller et al. R28.7
Genome Biology 2009, 10:R28
metabolism. Figure 3 shows the resulting classification qual-
ity values for the nearest neighbor classifier IB1 and the naïve
Bayes classifier depending on the number of (most relevant)
pathways (1-20) that have been considered for classification
(the corresponding classification quality diagrams for the
classifiers J48 and SMO are available in Additional data file
2). According to the cross-check, the phenotype 'methano-
genesis' is significantly associated with the identified relevant
pathways. As one can see from the classification quality dia-
grams, for any combination of attribute selection method
(ReliefF, SVMAttributeEval, wrapper (naïve Bayes)) and clas-
sifier except the combination ReliefF/IB1, the maximum clas-
sification quality is already reached using the (up to) five most
relevant pathways (for the respective pathways, see Table 1).
Therefore, we focus on these pathways in the following.
As expected, our method found the pathway of methane syn-
thesis from H
2
and CO
2
(methane1) to be the most relevant
pathway for the phenotype 'methanogenesis'. In addition, we
found the following pathways to be relevant by showing either
specifically higher or lower pathway scores for genomes
showing the phenotype (Table 1): biosynthesis of phosphati-
dylserine (phospholipids3) (higher); biosynthesis of cardioli-
pin (phospholipids1) (lower); biosynthesis of peptidoglycan
(part I) (aminosugars4) (lower); beta-oxidation of fatty acids
(fa2) (lower); pentose phosphate cycle (non-oxidative
branch) (ppc3) (lower); heme biosynthesis (pyrrole3)
(lower); degradation of L-lysine to crotonyl-CoA (lysine3)
(lower); degradation of L-threonine to L-2-aminoacetate
(threonine2) (lower); and biosynthesis of coenzyme A (coa1)
(lower).
Biosynthesis of phosphatidylserine and cardiolipin
Phosphatidylserine and cardiolipin are both components of
biological membranes. Differences in membrane lipids led to
the distinction of the domain of archaea from the domain of
bacteria [40]. Furthermore, composition and biosynthetic
pathways of polar lipids in methanogens differ from those of
other groups of archaea [41,42]. Among the archaea, phos-
pholipids with amino groups, such as phosphatidylserine,
only occur in methanogens and some related Euryarchaeota.
This is reflected by the pathway score. For all six methano-
gens in our dataset as well as for five other archaea (Haloar-
cula marismortui ATCC43049, Halobacterium salinarum
NRC1, Archaeoglobus fulgidus, Thermoplasma acido-
philum, Natronomonas pharaonis DSM 2160), the pathway
score is ≥ 0.75, whereas it is ≤ 0.25 for all other archaea in the
dataset. For phosphatidylserine, Morii and Koga [42] sug-
gested a pathway consisting of five steps (starting from glyc-
eraldehyde-3-P) analogous to the pathway in bacteria. The
phosphatidylserine synthase, which catalyzes the last step of
this pathway in methanogens and some related Euryarchae-
ota, is similar to the corresponding enzyme in Gram-positive
bacteria. Thus, the authors speculated that the ancestral
encoding gene was transferred from a Gram-positive bacte-
rium. This is in good agreement with our results, as our
method found the pathway of biosynthesis of phosphatidyl-
serine to be relevant also in distinguishing Gram-positive and
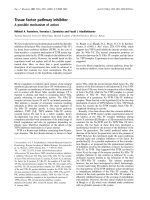
Cross-checking for the phenotype methanogenesisFigure 3
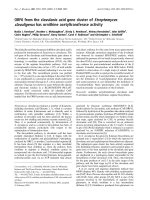
Cross-checking for the phenotype methanogenesis. The classification quality diagrams for nearest neighbor classifier (IB1) and the naïve Bayes classifier
show that the identified most relevant pathways are well suited to distinguish methanogens and non-methanogens (sensitivity × selectivity = 1.0).
According to the cross-check, the most relevant pathways identified by pathway selection are considered as significant. Apart from using ReliefF top-
ranking pathways (green) for the classification with IB1, the maximum classification quality is already reached for the (up to) five most relevant pathways
(these pathways are listed in Table 1).
5101520
0.0
0.2
0.4
0.6
0.8
1.0
methanogenic − IB1
#relevant pathways
sensitivity*selectivity
random
reliefF
wrapper_naiveBayes
SVMAttributeEval
5 101520
0.0
0.2
0.4
0.6
0.8
1.0
methanogenic − naive Bayes
#relevant pathways
sensitivity*selectivity
random
reliefF
wrapper_naiveBayes
SVMAttributeEval
Genome Biology 2009, Volume 10, Issue 3, Article R28 Kastenmüller et al. R28.8
Genome Biology 2009, 10:R28
Gram-negative bacteria (Additional data file 2). In contrast to
the biosynthesis of phosphatidylserine, the synthesis of cardi-
olipin is not operative in most archaea in the dataset (except
Halobacterium salinarum NRC1) according to our predic-
tions. Cardiolipin is related to oxidative processes and is
known to be synthesized by Halobacterium salinarum [43].
Biosynthesis of peptidoglycan (part I: biosynthesis of N-
acetylmuramic acid)
Peptidoglycan (murein) is a cell wall polymer common to
most eubacteria [31]. In the first phase of its biosynthesis N-
acetylmuramate is formed. Members of the domain archaea
lack peptidoglycan in their cell wall. Some archaea have
developed a polymer called pseudopeptidoglycan (pseu-
domurein), which is functionally and structurally similar, but
chemically different from eubacterial murein. Instead of N-
acetylmuramic acid, pseudomurein contains N-acetylta-
losaminuronic acid (the biosynthetic pathway of N-acetylta-
losaminuronic acid is not included in BioPath). The relevance
of the N-acetylmuramic acid pathway in distinguishing meth-
anogens from non-methanogens presumably represents the
differences in cell wall composition of archaea compared to
eubacteria and identifies methanogens as archaebacteria.
Biosynthesis of coenzyme A
Coenzyme A is an acyl group carrier and plays a central role
in cellular metabolism. In BioPath, the biosynthetic pathway
'biosynthesis of coenzyme A' (coa1) includes both the biosyn-
thesis of coenzyme A from pantothenate and the de novo syn-
thesis of pantothenate. In several non-methanogenic archaea,
the set of enzymes for the synthesis of pantothenate is con-
served with the corresponding bacterial or eukaryotic
Table 1
Relevant pathways for methanogenesis
Dataset ReliefF SVMAttributeEval Wrapper (naïve Bayes)
Complete (266) Reduction of CO
2
to CH
4
(methane1) ↑
Reduction of CO
2
to CH
4
(methane1) ↑
Reduction of CO
2
to CH
4
(methane1) ↑
Biosynthesis of cardiolipin
(phospholipids1) ↓
Biosynthesis of cardiolipin
(phospholipids1) ↓
Degradation of L-lysine to crotonyl-
CoA (lysine3) ↓
Biosynthesis of peptidoglycan I
(aminosugars4) ↓
beta-Oxidation of fatty acids (fa2) ↓ Biosynthesis of coenzyme A (coa1)
↓
Heme biosynthesis (pyrrole3) ↓ Degradation of L-threonine to L-2-
aminoacetate (threonine2) ↓
Pentose phosphate cycle (non-
oxidative branch) (ppc3) ↓
Biosynthesis of phosphatidylserine
(phospholipids3) ↑
Archaea (23) Biosynthesis of 2'-deoxythymidine-
5'-triphosphate (dtn1) ↑
Biosynthesis of 2'-deoxythymidine-
5'-triphosphate (dtn1) ↑
Reduction of CO
2
to CH
4
(methane1) ↓
Reduction of CO
2
to CH
4
(methane1) ↑
Biosynthesis of L-phenylalanine
from chorismate (aaa4) ↑
Biosynthesis of 2'-deoxythymidine-
5'-triphosphate (dtn1) ↑
Biosynthesis of phosphatidylserine
(phospholipids3) ↑
Reduction of CO
2
to CH
4
(methane1) ↑
Degradation of L-threonine to L-2-
aminoacetate (threonine2) ↓
Degradation of L-threonine to L-2-
aminoacetate (threonine2) ↓
Degradation of dGMP to
deoxyguanosine (dgn2) ↓
Degradation of L-lysine to crotonyl-
CoA (lysine3) ↓
Degradation of tryptophane to 6-
hydroxymelatonin (trp5) ↑
Biosynthesis of phosphatidylserine
(phospholipids3) ↑
Biosynthesis of coenzyme B12
(coba1) ↑
Archaea (23) (without methane1) Biosynthesis of 2'-deoxythymidine-
5'-triphosphate (dtn1) ↑
Biosynthesis of 2'-deoxythymidine-
5'-triphosphate (dtn1) ↑
Biosynthesis of 2'-deoxythymidine-
5'-triphosphate (dtn1) ↑
Biosynthesis of phosphatidylserine
(phospholipids3) ↑
Biosynthesis of L-phenylalanine
from chorismate (aaa4) ↑
Biosynthesis of coenzyme B12
(coba1) ↑
Degradation of L-threonine to L-2-
aminoacetate (threonine2) ↓
Degradation of L-threonine to L-2-
aminoacetate (threonine2) ↓
Degradation of L-valine (vas4) ↓
Degradation of tryptophane to 6-
hydroxymelatonin (trp5) ↑
Biosynthesis of phosphatidylserine
(phospholipids3) ↑
Degradation of L-threonine to L-2-
aminoacetate (threonine2) ↓
Biosynthesis of coenzyme B12
(coba1) ↑
Odd-numbered fatty acid
metabolism (glf2) ↓
Degradation of L-lysine to crotonyl-
CoA (lysine3) ↓
The relevant pathways for methanogenesis were determined by applying three different attribute selection methods (ReliefF, SVMAttributeEval, and
a wrapper for the naïve Bayes classifier) to three datasets. The (up to) five most relevant pathways received for the complete set of pathway profiles
(266 genomes), the archaeal pathway profiles (23 genomes), and the archaea profiles (23 genomes) without the attribute 'methane1' are shown. An
upwards pointing arrow denotes pathways that are relevant due to higher pathway scores (that is, pathways are more complete) in methanogens
compared to the other genomes in the investigated dataset. In analogy, a downwards pointing arrow denotes pathways that are relevant due to
lower pathway scores (that is, pathways are less complete) in methanogens.
Genome Biology 2009, Volume 10, Issue 3, Article R28 Kastenmüller et al. R28.9
Genome Biology 2009, 10:R28
enzymes. In methanogenic archaea, however, neither homol-
ogy nor non-homology based methods could identify
enzymes for the synthesis of pantothenate. Thus, autotrophic
methanogens follow a unique pathway for de novo biosynthe-
sis of coenzyme A [44].
Pentose phosphate cycle (non-oxidative branch)
In the non-oxidative branch of the pentose phosphate cycle,
various sugars with three, four, five, six, or seven carbon
atoms are interconverted to each other. But genes for this
pathway are missing in most archaeal genomes [45]. Analo-
gous to the peptidoglycan pathway, the occurrence of this
pentose phosphate cycle branch indicates that all methano-
gens show properties of archaea.
Heme biosynthesis (part II)
Heme is the prosthetic group of many important heme pro-
teins, which are involved in electron transfer or gas transport.
Heme proteins such as cytochromes a, b, and c and catalase
are also known for archaea. For the first part of heme synthe-
sis from delta-aminolevulinic acid to uroporphyrinogen III,
the homologs of the corresponding eukaryotic and bacterial
enzymes are present in many archaea. But for the conversion
of uroporphyrinogen III to protoheme, most archaea (except
Thermoplasma volcanium) lack homologs [46]. The rele-
vance of this pathway for the phenotype 'methanogenesis'
presumably arises from the fact that all methanogens known
so far are members of the archaea domain.
(Aerobic) beta-oxidation of fatty acids
This pathway depends on aerobic conditions and is missing in
the six methanogens contained in PEDANT. Thus, its occur-
rence in the list of relevant pathways may refer to the anaero-
bic lifestyle of methanogens. Our results for distinguishing
obligate anaerobes and obligate aerobes also support this
assumption, as the pathway of beta-oxidation of fatty acids is
one of the five most relevant pathways for this phenotype
(Additional data file 2).
Degradation of L-threonine to L-2-amino-acetoacetate and
degradation of L-lysine to crotonyl-CoA
In general, degradation of amino acids can be used either to
gain energy or to generate fatty acids [47]. Both degradation
pathways, which our method identified as relevant, are not
operative in methanogens according to our metabolic recon-
structions. In some anaerobic microorganisms, degradation
of several amino acids is coupled to methanogens by a syn-
trophic relationship: hydrogen, which is produced by the oxi-
dation of the amino acid in the degrading organism, is
consumed in methanogenesis by the methanogenic organism
[48]. Thus, looking at these degradation processes presuma-
bly helps to distinguish methanogens from other anaerobic
genomes.
Methanogens among archaea
In order to determine pathways that reflect methanogenic
rather than archaeal properties, we also applied our method
to the subset of archaeal genomes (23 pathway profiles). The
classification of archaea into methanogens and non-metha-
nogens based on the newly derived five most relevant path-
ways yielded a classification quality above 0.8 for all attribute
selection methods and all classifiers except J48 for the five
most relevant pathways determined by the wrapper (0.59;
Table 2 and Figure 4). The resulting rankings of relevant
pathways still contained methane1, phospholipids3,
threonine2, and lysine3 within the top five positions. Addi-
tionally, the pathway of 'biosynthesis of 2'-deoxythymidine-
5'-triphosphate' (dtn1) ranked among the five most relevant
pathways for each attribute selection method applied. (For
further pathways that rose in rank for only one of the attribute
selection methods, see Table 1.) In contrast to the results for
all genomes, pathways related only to archaeal or anaerobic
properties (ppc3, pyrrole3, aminosugars4) did not occur
among the five most relevant pathways any more.
For the synthesis of thymidylate (2'-deoxythymidine-5'-
monophosphate), which is the first step of dtn1, two alterna-
tive mechanisms are known so far. In these two mechanisms
the synthesis is catalyzed by ThyA (2.1.1.45) and ThyX
(2.1.1.148), respectively. Both, ThyA and ThyX show a broad
phylogenetic distribution, but usually only one or the other is
encoded by a genome [49,50]. In BioPath, the reference path-
way for 'biosynthesis of 2'-deoxythymidine-5'-triphosphate'
(dtn1) only contains the more classic route via ThyA. Using
our reconstruction method, we predicted that all methano-
gens contained in our data follow this classic route, whereas
most other archaea (except Archaeoglobus fulgidus and
Natronomonas pharaonis) lack this pathway. Thus, in this
case, the identified difference between methanogens and
Table 2
Classification quality for the classification of 23 archaeal genomes
into methanogens and non-methanogens using the 5 most rele-
vant pathways
Classifier ReliefF SVM Wrapper All pathways Random
J48 0.88 0.88 0.59 0.83 0.17
IB1 0.94 1.00 1.00 0.29 0.31
Naïve Bayes 0.94 1.00 0.83 0.83 0.38
SMO 1.00 1.00 1.00 1.00 0.01
The 23 archaeal genomes were classified into methanogens and non-
methanogens using only the five most relevant pathways from Table 1.
We applied four different classifiers (J48, IB1, naïve Bayes, and SMO)
with tenfold cross-validation. In addition, the genomes were classified
based on all pathways (290) in the pathway profile as well as on five
randomly chosen pathways. To estimate the quality of classification, we
calculated the product of classification selectivity and sensitivity, which
is shown in this table. In the case of randomly chosen pathways, the
value was derived by averaging the classification quality of 25 sets of 5
randomly chosen pathways.
Genome Biology 2009, Volume 10, Issue 3, Article R28 Kastenmüller et al. R28.10
Genome Biology 2009, 10:R28
archaea is presumably due to differences in pathway variants
rather than differences in the presence or absence of the
respective metabolic capability.
Methanogens among archaea disregarding methane1
In order to ensure that the good classification quality was not
mainly due to the high relevance of methane1, we deleted
methane1 from the pathway profiles and repeated our analy-
sis. Thereby, we received almost the same set of relevant
pathways (Table 1) and an almost as high classification qual-
ity as with methane1 (Table 3 and Figure 5).
Causing periodontal disease
Periodontal disease is a bacterial infection of the tissues sur-
rounding and supporting the teeth. Symptoms vary from
inflammation and bleeding of the gums to teeth loss due to
destruction of the bone around the teeth. In many studies,
periodontal disease was related to an increased amount of
Fusobacterium nucleatum, Porphyromonas gingivalis,
Treponema denticola, Tannerella forsythia, Prevotella
intermedia, and Aggregatibacter actinomycetemcomitans
in the oral flora of patients compared to healthy controls [51-
54].
The human oral flora consists of more than 700 species [55],
of which less than half can be grown in the laboratory. At the
time of our study, PEDANT contained 15 fully sequenced oral
genomes (as annotated by NCBI and Karyn's genomes)
including four (F. nucleatum ATCC25586, P. gingivalis W83,
T. denticola ATCC35405, and A. actinomycetemcomitans
(serotype b) HK1651) of the six periodontal pathogens.
Analogous to the previous example of methanogenesis, we
applied our method to the complete set of pathway profiles
(266 species) as well as to the reduced set of 15 oral genomes
to focus on periodontal-related rather than oral cavity-related
biochemical features. Figure 6 shows the resulting classifica-
tion qualities achieved with the nearest neighbor classifier.
According to the cross-check, the phenotype 'periodontal dis-
ease causing' is reflected by the identified relevant pathways.
In contrast to the phenotype 'methanogenesis', more highly
ranking pathways must be considered for classification to
reach the maximum classification quality. Therefore, we
focus on the ten most relevant pathways in the following.
Using these pathways, we obtained 0.75 as the maximum
classification quality value in both genome sets compared to
a maximum of 0.50 for all pathways and maximums of 0.08
Classification quality for the classification of archaea into methanogens and non-methanogens using the nearest neighbor classifierFigure 4
Classification quality for the classification of archaea into methanogens and
non-methanogens using the nearest neighbor classifier. The classification
based on the four most relevant pathways yields a perfect separation of
methanogenic archaea and non-methanogenic archaea for all attribute
subset selection methods used (green, ReliefF; yellow, SVMAttributeEval;
blue, wrapper (naïve Bayes)). Classification based on all pathways (marked
by a horizontal line) and based on randomly picked pathways (red) show
lower classification quality.
5 101520
0.0
0.2
0.4
0.6
0.8
1.0
methanogenic among archaea − IB1
#relevant pathways
sensitivity*selectivity
random
reliefF
wrapper_naiveBayes
SVMAttributeEval
Table 3
Classification quality for the classification of 23 archaeal genomes into methanogens and non-methanogens using the 5 most relevant
pathways derived from pathway profiles without methane1
Classifier ReliefF SVM Wrapper All pathways except methane1 Random
J48 0.59 0.88 0.59 0.67 0.01
IB1 0.94 1.00 1.00 0.29 0.40
Naïve Bayes 0.78 1.00 0.77 0.67 0.59
SMO 1.00 1.00 1.00 1.00 0.00
The 23 archaeal genomes were classified into methanogens and non-methanogens using only the five most relevant pathways from Table 1. These
relevant pathways were derived by attribute subset selection based on pathway profiles without the pathway methane1. We applied four different
classifiers (J48, IB1, naïve Bayes, and SMO) with tenfold cross-validation. In addition, the genomes were classified based on all pathways (290) in the
pathway profile as well as on five randomly chosen pathways. To estimate the quality of classification, we calculated the product of classification
selectivity and sensitivity, which is shown in this table. In the case of randomly chosen pathways, the value was derived by averaging the classification
quality of 25 sets of 5 randomly chosen pathways.
Genome Biology 2009, Volume 10, Issue 3, Article R28 Kastenmüller et al. R28.11
Genome Biology 2009, 10:R28
and 0.29, respectively, for randomly chosen pathways (Table
4).
The classification quality did not reach 1.00 for any combina-
tion of attribute selection method and classifier because A.
actinomycetemcomitans was always misclassified. Plotting
the pathway scores of the relevant pathways, the differences
of A. actinomycetemcomitans compared to F. nucleatum, P.
gingivalis, and T. denticola become apparent (Figure 7). In
contrast, the scores for F. nucleatum, P. gingivalis, and T.
denticola are very similar. This 'outlier' role of A. actinomyc-
etemcomitans agrees with studies of Socransky et al. [52].
They investigated the co-occurrence of bacterial species in a
large number of subgingival plaque samples (collected from
hundreds of patients) and identified five major clusters of
bacteria, which they designated by the colors red, orange,
green, yellow, and purple. A. actinomycetemcomitans (sero-
type b) did not fall in one of these clusters. The cluster holding
P. gingivalis, T. denticola, and T. forsythensis (called the 'red'
cluster in [52]) and the cluster consisting of F. nucleatum and
some Prevotella and not yet sequenced Centruroides species
(called the 'orange' cluster in [52]), were associated with clin-
ical measures of periodontal disease. A. actinomycetemcom-
itans, however, was not found to be significantly enhanced for
periodontal disease in Socransky et al. [52]. Nonetheless,
according to several studies, a high-toxic JP2 clone of A.
actinomycetemcomitans (serotype b) (strain HK1651 is a rep-
resentative of this clone) is strongly associated with localized
juvenile periodontitis in adolescents of African origin [53].
Based on the major differences of A. actinomycetemcomitans
compared to the other pathogens in our analyses, one could
speculate that the mechanisms causing the disease might also
differ.
In order to get more specific insights for the three species of
the 'red' and 'orange' clusters, we repeated the procedure
described above for the phenotype 'member of the red or
orange cluster'. (Since Socransky et al. [52] derived those
clusters based on clinical measures for the co-occurrence of
oral species, this phenotype can be considered as a clinical
phenotype.) As expected, we received enhanced classification
quality (Table 5 and Figure 8). The pathways that are among
the ten most relevant pathways for at least one attribute selec-
tion method and for at least three of the four investigated
datasets are listed in Table 6 and briefly described below (for
all pathways, see Additional data file 2). In Table 6, these
datasets are abbreviated by two characters. The first charac-
ter denotes the phenotypic information used: 3 ='members of
red or orange cluster' and 4 ='periodontal disease causing'.
The second character denotes the set of genomes in the data-
set: A = all genomes (266); O = oral cavity genomes (15). (This
results in the following abbreviations for the four combina-
Classification quality for the classification of archaea into methanogens and non-methanogens using the nearest neighbor classifier while omitting the pathway of methane synthesisFigure 5
Classification quality for the classification of archaea into methanogens and
non-methanogens using the nearest neighbor classifier while omitting the
pathway of methane synthesis. Omitting the pathway of methane synthesis
(methane1) in our analyses, the classification based on the most relevant
pathways still reaches perfect separation of methanogenic archaea and
non-methanogenic archaea for all attribute subset selection methods used
(green, ReliefF; yellow, SVMAttributeEval; blue, wrapper (naïve Bayes)).
Classification based on all pathways (marked by a horizontal line) and
based on randomly picked pathways (red) show lower classification
quality.
5101520
0.0
0.2
0.4
0.6
0.8
1.0
methanogenic (a. archaea; −methane1) − IB1
#relevant pathways
sensitivity*selectivity
random
reliefF
wrapper_naiveBayes
SVMAttributeEval
Table 4
Classification quality for the classification of genomes into
genomes related and unrelated to periodontal disease using the
corresponding 10 most relevant pathways
Classifier ReliefF SVM Wrapper All pathways Random
J48 0.50 0.00 0.00 0.00 0.01
(0.68) (0.68) (0.36) (0.25) (0.29)
IB1 0.75 0.75 0.74 0.50 0.08
(0.75) (0.50) (0.75) (0.18) (0.28)
Naïve Bayes 0.65 0.50 0.72 0.50 0.05
(0.61) (0.75) (0.75) (0.45) (0.29)
SMO 0.00 0.75 0.00 0.25 0.00
(0.75) (0.68) (0.36) (0.50) (0.11)
The 266 (15 oral cavity) genomes of the complete data set were
classified into genomes related and not related to periodontal disease
using only ten (eight in the case of wrapper) most relevant pathways
derived by the three attribute selection methods. We applied four
different classifiers (J48, IB1, naïve Bayes, and SMO) with tenfold cross-
validation. In addition, the genomes were classified based on all
pathways (290) in the pathway profile as well as on ten randomly
chosen pathways. To estimate the quality of classification, we
calculated the product of classification selectivity and sensitivity, which
is shown in this table. In the case of randomly chosen pathways, the
value was derived by averaging the classification quality of 25 sets of 10
randomly chosen pathways. The data in parentheses are for the dataset
containing the 15 oral cavity genomes.
Genome Biology 2009, Volume 10, Issue 3, Article R28 Kastenmüller et al. R28.12
Genome Biology 2009, 10:R28
tions of phenotypic information and genome sets that have
been investigated: 4A, 'periodontal disease causing' genomes
in the complete dataset (266 genomes); 4O, 'periodontal dis-
ease causing' genomes in the oral cavity dataset (15 genomes);
3A, 'members of red or orange cluster' in the complete data-
Classification quality for the phenotype periodontal disease causingFigure 6
Classification quality for the phenotype periodontal disease causing. Left: classification of all genomes (266) into genomes related and not related to
periodontal disease using the nearest neighbor classifier (IB1). Right: classification of oral genomes (15) into genomes related and not related to
periodontal disease using the nearest neighbor classifier (IB1). Compared to classification based on all pathways (marked by a horizontal line) and based on
randomly picked pathways (red), the classification based on the most relevant pathways yields better separation of periodontal species and other species
in both genome datasets.
5 101520
0.0
0.2
0.4
0.6
0.8
1.0
periodontal sp. − IB1
#relevant pathways
sensitivity*selectivity
random
reliefF
wrapper_naiveBayes
SVMAttributeEval
5101520
0.0
0.2
0.4
0.6
0.8
1.0
periodontal sp. among oral cavity sp. − IB1
#relevant pathways
sensitivity*selectivity
random
reliefF
wrapper_naiveBayes
SVMAttributeEval
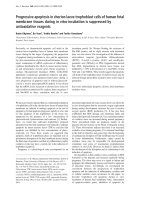
Pathway scores of the relevant pathways for the periodontal speciesFigure 7
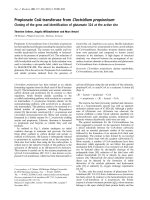
Pathway scores of the relevant pathways for the periodontal species. Plotting the pathway scores of the relevant pathways (from Table 6), the differences
of A. actinomycetemcomitans (black) compared to F. nucleatum (red), P. gingivalis (green), and T. denticola (blue) become apparent. In contrast, the scores for
F. nucleatum, P. gingivalis, and T. denticola are very similar.
0.0
0.2
0.4
0.6
0.8
1.0
relevant pathways
pathway score
histidine2 fnc1 c2 coba1 urea2 proline1 glutamate2 gg13
A.actinomycetemcomitans
F.nucleatum
P.gingivalis
T.denticola
Genome Biology 2009, Volume 10, Issue 3, Article R28 Kastenmüller et al. R28.13
Genome Biology 2009, 10:R28
set; 3O, 'members of red or orange cluster' in the oral cavity
dataset.)
Glutamate fermentation (fnc1), degradation of histidine to L-
glutamate (histidine2), and biosynthesis of 5-formimino-THF (c2)
The three pathways glutamate fermentation (fnc1), degrada-
tion of histidine to L-glutamate (histidine2), and biosynthesis
of 5-formimino-THF (c2) describe (amino acid) degradations
producing ammonia as an end product and are predicted to
be operative in the periodontal bacteria (except A. actino-
mycetemcomitans). Due to the reversibility of all its reac-
tions, this also includes the pathway of biosynthesis of 5-
formimino-THF, which - inversely followed - describes the
degradation of 5-formimino-THF to glutamate. All three
pathways are interconnected and can be interpreted as the
complete degradation of L-histidine to acetate and (three
moles) ammonia (NH
3
) (Figure 9). Studies by Niederman et
al. [56] and Takahashi et al. [57] on ammonia as a mediator
of periodontal infection support the biological relevance of
our result. The authors showed that NH
3
inhibits the poly-
morphonuclear leucocyte function of the host cells. It is
known that this inhibition increases the susceptibility of
humans to periodontal infection [58,59]. That ammonia plays
an important role in periodontal disease is further supported
by a study on the oral health of patients with chronic renal
failure [60]. These patients show a higher prevalence of peri-
odontal disease. Compared to healthy controls, a high con-
centration of urea is observed in the saliva of these patients.
It is assumed that the increased amount of urea leads to an
increased amount of ammonia due to the degradation of urea
by urealytic oral bacteria such as Actinomyces naeslundii.
Table 5
Classification quality for the classification of genomes into mem-
bers and non-members of the red or orange cluster by using the
corresponding 10 most relevant pathways
Classifier ReliefF SVM Wrapper All pathways Random
J48 0.67 0.00 0.67 0.00 0.00
(0.92) (0.92) (0.92) (0.00) (0.20)
IB1 1.00 1.00 1.00 0.67 0.08
(1.00) (1.00) (1.00) (0.61) (0.16)
Naïve Bayes 1.00 0.67 1.00 0.67 0.12
(1.00) (1.00) (0.67) (0.67) (0.14)
SMO 1.00 1.00 0.67 0.00 0.00
(1.00) (1.00) (0.92) (0.67) (0.08)
The 266 (15 oral cavity) genomes of the complete data set were
classified into members and non-members of the red or orange cluster
using only the ten (in the case of wrapper, 6 (266 genomes) or 4 (15
genomes)) most relevant pathways (Additional data file 2) derived by
the three attribute selection methods, respectively. We applied four
different classifiers (J48, IB1, naïve Bayes, and SMO) with tenfold cross-
validation. In addition, the genomes were classified based on all
pathways (290) in the pathway profile as well as on ten randomly
chosen pathways. To estimate the quality of classification, we
calculated the product of classification selectivity and sensitivity, which
is shown in this table. In the case of randomly chosen pathways, the
value was derived by averaging the classification quality of 25 sets of 10
randomly chosen pathways. The data in parentheses are for the dataset
containing the 15 oral cavity genomes.
Table 6
Relevant pathways for the phenotype 'periodontal disease causing'
Relevant pathway Dataset Attribute selection method
Biosynthesis of coenzyme B12 (coba1) ↑ 4A, 4O, 3A, 3O R, S, W
Biosynthesis of L-proline (proline1) ↓ 4A, 4O, 3A, 3O R, S, W
Glutamate fermentation (fnc1) ↑ 4A, 4O, 3A, 3O R, S, W
Biosynthesis of 5-formimino-THF (c2) ↑ 4A, 4O, 3A, 3O R, S
Urea cycle (part) (urea2) ↓ 4A, 4O, 3A, 3O R, S
Conversion of L-glutamate to L-proline (glutamate3) ↓ 4A, 4O, 3A, 3O R, S
Conversion of L-glutamate to L-ornithine (glutamate2) ↓ 4A, 4O, 3A, 3O R
Degradation of L-histidine to L-glutamate (histidine2) ↑ 4O, 3A, 3O R, S, W
Glycolysis and Gluconeogenesis (part) (gg13) ↑ 4A, 4O, 3O R, S
The pathways that are among the ten most relevant pathways for at least one attribute selection method (R, ReliefF; S, SVMAttributeEval; W,
wrapper(naïve Bayes)) and for at least three of the four investigated datasets (4A, 'periodontal disease causing' genomes in complete dataset (266
genomes); 4O, 'periodontal disease causing' genomes in oral cavity dataset (15 genomes); 3A, 'members of red or orange cluster' in the complete
dataset; 3O, 'members of red or orange cluster' in oral cavity dataset) are listed. An upwards pointing arrow denotes pathways that are relevant due
to higher pathway scores (that is, pathways are more complete) for the periodontal species compared to the other genomes in the investigated
dataset. In analogy, a downwards pointing arrow denotes pathways that are relevant due to lower pathway scores (that is, pathways are less
complete) for the periodontal species.
Genome Biology 2009, Volume 10, Issue 3, Article R28 Kastenmüller et al. R28.14
Genome Biology 2009, 10:R28
Urea cycle (part I)
The urea cycle is used by many organisms to convert toxic
ammonia to urea. Some organisms (for example, most
aquatic organisms), however, excrete ammonia directly [61].
According to our pathway prediction, the part of the urea
cycle described by urea2 is not operative in F. nucleatum, P.
gingivalis, and T. denticola, in contrast to other oral species.
Thus, ammonia produced by periodontal species is presuma-
bly excreted directly to the host, whereas other oral species
presumably metabolize the ammonia that they produce. This
further supports the hypothesis that cytotoxic ammonia, to
which the host's tissue is exposed, plays an important role in
the development of periodontal disease.
Biosynthesis of coenzyme B12
Coenzyme B12 (cobalamin) plays an important role in fer-
mentation processes of many microorganisms. In bacteria,
one of these processes is the glutamate fermentation
described above (fnc1). Glutamate mutase, which catalyzes
the first step of glutamate fermentation (fnc1), requires B12 as
a cofactor. Though B12-dependent enzymes are also known
for animals and protists, biosynthesis of B12 is restricted to
some bacteria and archaea. Our metabolic reconstruction
predicted higher pathway scores for periodontal species com-
pared to other oral species for this pathway. Thus, the rele-
vance of the coba1 pathway is in good agreement with the
relevance of the pathways described above [62].
Conversion of L-glutamate into L-proline/biosynthesis of L-proline
(glutamate3/proline1), and conversion of L-glutamate to L-ornithine
(glutamate2)
Both proline1 and glutamate3 describe the same universal
biosynthesis of L-proline from L-glutamate (the pathway is
duplicated in BioPath). glutamate2 and proline1 share the
first two reactions. According to our metabolic reconstruc-
tions, these pathways are not available for F. nucleatum, P.
gingivalis, and T. denticola. Regarding the similarity of the
core metabolism between F. nucleatum and Clostridia spp.,
proline biosynthesis via ornithine could be an alternative
route [63]. Like by the degradation of histidine, ammonia is
produced by this alternative L-proline pathway.
The last relevant pathway listed in Table 6 represents a part
of the glycolysis/gluconeogenesis (gg13) pathway. For this
pathway, we could not find any relation to periodontal disease
in the literature.
As stated above, the periodontal pathogens T. forsythia and
P. intermedia have not been included in the identification of
relevant pathways because they were not available in PED-
ANT at the time of our analysis. According to the lists of
genome projects provided by the NCBI [64], the T. forsythia
ATCC 43037 and P. intermedia 17 genome projects are still 'in
progress'. However, their genomic sequences are now availa-
ble [65]. In order to further test our results, we determined
the pathway profiles for both genomes (after their automatic
annotation in the new version of the PEDANT genome data-
Classification quality for the phenotype member of red or orange clusterFigure 8
Classification quality for the phenotype member of red or orange cluster. Left: classification of all genomes (266) into genomes that are members and non-
members of the 'red/orange' cluster using the nearest neighbor classifier (IB1). Right: classification of oral genomes (15) into genomes that are members
and non-members of the 'red/orange' cluster related using the nearest neighbor classifier (IB1). Compared to classification based on all pathways (marked
by a horizontal line) and based on randomly picked pathways (red), the classification based on the most relevant pathways yields better separation of the
cluster members and other species in both genome datasets.
5101520
0.0
0.2
0.4
0.6
0.8
1.0
members of red/orange cluster − IB1
#relevant pathways
sensitivity*selectivity
random
reliefF
wrapper_naiveBayes
SVMAttributeEval
5 101520
0.0
0.2
0.4
0.6
0.8
1.0
m. red/orange cl. among oral cavity sp. − IB1
#relevant pathways
sensitivity*selectivity
random
reliefF
wrapper_naiveBayes
SVMAttributeEval
Genome Biology 2009, Volume 10, Issue 3, Article R28 Kastenmüller et al. R28.15
Genome Biology 2009, 10:R28
base [66]). For these genomes, the pathway scores of the rel-
evant pathways (which are listed in Table 6) were largely
consistent with the respective scores of F. nucleatum, P. gin-
givalis, and T. denticola. Analogous to Figure 7, Figure S16 in
Additional data file 2 illustrates this metabolic similarity in
the selected relevant pathways of the five out of six periodon-
tal species.
Comparison to related methods
The method presented here has several advantages over exist-
ing systems for relating phenotypes to the underlying bio-
chemical processes. The current systems PUMA2 [17] and
Genome Properties [16] allow for the retrieval of pathways
(equivalent to genome properties in [16]) that are present in
every genome of a set of prokaryotic genomes. In both sys-
tems these genomes can be selected by filtering for pheno-
Degradation of histidineFigure 9
Degradation of histidine. The pathways glutamate fermentation (fnc1) (red) and degradation of histidine to L-glutamate (histidine2) (black) describe (amino
acid) degradations producing ammonia as an end product. Due to the reversibility of all its reactions, this also includes the pathway of biosynthesis of 5-
formimino-THF (blue), which - inversely followed - describes the degradation of 5-formimino-THF to glutamate (c2). All three pathways are
interconnected and can be interpreted as complete degradation of L-histidine to acetate and ammonia (NH
3
). Thereby, three moles of ammonia per mole
of histidine are produced (green or turquoise boxes, respectively). As histidine2 includes an alternative route from L-histidine to glutamate (dashed line),
one mole of ammonia is either produced by the conversion of N-carbamoyl-L-glutamate to L-glutamate or by the conversion of N-formimino-
tetrahydrofolate to 5,10-methenyl-tetrahydrofolate.
Degradation of L-histidine
to L-glutamate
(histidine2)
L-Histidine
4.3.1.3
Urocanate
4.2.1.49
4-Imidazolone-
5-propionate
N-Formimino-
L-glutamate
3.5.2.7
H2O
1.2.3.1
N-Carbamoyl-
L-glutamate
L-Glutamate
3.5.2.2
H2O
Hydantoin
propionate
H2O
2.1.2.5
N-Formimino-
tetrahydrofolate
3-Methylaspartate
5.4.99.1
Mesaconate
4.3.1.2
4.2.1.34
S-Citramalate
4.1.3.22
Acetate
1/2 O2
H2O CO2 +
NH3
H2O
Pyruvate
4.3.1.4
5,10- Methenyl-
tetrahydrofolate
N-Formimino-
glycine
Glycine
2.1.2.4
5,6,7,8-Tetra-
hydrofolate
NADPH
H+
NADP+
7,8- Dehydro-
folate
1.5.1.3
Biosynthesis of
5-formimino-THF
(c2)
Glutamate fermentation
(fnc1)
NH3
NH3
NH3
Genome Biology 2009, Volume 10, Issue 3, Article R28 Kastenmüller et al. R28.16
Genome Biology 2009, 10:R28
typic traits. However, all pathways found for these genomes
are listed without any information on their association with
the phenotype. As a consequence, the list includes many path-
ways that are not typical of the traits but are also common in
genomes showing other phenotypes. Without restricting the
list of pathways to those that are in fact distinctive for the phe-
notype, the direct generation of mechanistic hypotheses - as
possible using our method - is infeasible when using these
systems.
In contrast to the PUMA2 and Genome Properties systems,
Liu et al. [18] investigated pairwise associations of bacterial
phenotypes with KEGG pathways. Thereby, this study consid-
ered phenotypes of bacteria given by their clinical laboratory
characterizations; these characterizations are used to distin-
guish different microorganisms clinically (this includes mor-
phological characteristics (for example, Gram stain, motility),
metabolic functions (for example, urea hydrolysis, acetate
utilization), and adaption to extreme living conditions (for
example, growth at 6.5% sodium chloride)). The approach
relates phenotypes to KEGG pathways [19] by mining their
matching COGs [14] based on the correlation of COGs to phe-
notypes [20] and on the mapping of COGs to pathways. Rely-
ing on manual protein annotation as provided in the COG
database restricts the applicability of this approach to the lim-
ited number of genomes that underwent time-consuming
manual annotation.
Considering the rapidly growing number of completely
sequenced genomes, the gap between the number of
sequenced genomes and the number of manually annotated
genomes will further increase. In order to overcome limita-
tions in the number of genomes, we based our approach on
completely automated genome and protein annotations pro-
vided by the PEDANT system. In spite of annotation gaps and
errors, which always occur in automatic annotation proc-
esses, we achieved biologically reasonable phenotype-path-
way associations (as demonstrated above). Some of the
annotation errors might be compensated by the score-based
metabolic reconstruction step used in our approach (in con-
trast, the approach by Liu et al. does not imply pathway pre-
diction).
In the study by Liu et al., significant pairwise pathway-pheno-
type associations were estimated based on the (univariate)
hypergeometric distribution. Applying the method to all phe-
notypes considered in the study (92), resulted in only 17 sig-
nificant associations in total. In contrast, our approach goes
beyond pairwise associations of pathways and phenotypes. In
our approach, we apply machine learning methods that are
based on multivariate statistics. Thus, our method also allows
for the identification of pathways that are not associated with
a phenotype individually but in the context of other pathways.
Whereas univariate statistics assumes the pathways to be
independent of each other, multivariate methods take exist-
ing dependencies among pathways into account. Recently,
the advantages of considering multiple-to-one rather than
pairwise associations have also been shown for gene-pheno-
type associations by Tamura and D'haeseleer [11].
Discussion
While the number of completely sequenced genomes has
been growing fast in recent years, our understanding of these
genomes' biology has not kept up with the speed of sequenc-
ing. We already know the genomic sequences of several
organisms that show certain microbial phenotypes. Nonethe-
less, the biochemical mechanisms associated with these phe-
notypes are still unclear in many cases. In order to reveal
metabolic characteristics of phenotypic traits, exhaustive
manual investigation and comparison of all sequenced
genomes is infeasible considering the huge amount of data.
Here, we demonstrate that our method is able to identify met-
abolic pathways relevant to phenotypic traits, while com-
pletely based on data automatically derived from genomic
sequences.
As a case study, we show the applicability of our method to the
well studied phenotype 'methanogenesis'. This phenotype is
characterized by the production of methane as a major prod-
uct of energy metabolism. So far, methanogenesis has been
observed only for strictly anaerobe archaea. Apart from meth-
anogenesis, these species are quite diverse in their metabolic
capabilities.
Applying our method to the phenotype 'methanogenesis', we
identified the pathway for the synthesis of methane as well as
pathways typical of archaea and typical of an anaerobic life-
style. Furthermore, we found two amino acid degradation
pathways to be relevant in distinguishing methanogenic from
non-methanogenic archaea. According to our metabolic
reconstructions, methanogens typically lack these pathways.
This might be related to the syntrophism of methanogens
with amino acid degrading species. Finally, we identified the
biosynthesis of the membrane phospholipid phosphatidylser-
ine and the biosynthesis of 2'-deoxythymidine-5'-triphos-
phate (dTTP) as relevant pathways, which is also in good
agreement with biological knowledge on methanogens. Thus,
using our method, we were able to directly relate the pheno-
type 'methanogenesis' to known aspects of methanogenesis
without giving these biological facts to our method in any
form of prior knowledge. The application of our method to
other well studied phenotypes, namely 'Gram-positive', 'obli-
gate anaerobe', and 'obligate intracellular', also provided rel-
evant pathways that reflect known metabolic characteristics
of these phenotypes.
In general, one can divide phenotypic traits into two groups:
traits that developed from the same origin and, thus, are
mostly found in related species (for example, 'Gram-posi-
tive'); and traits that developed from different origins by
adaptation to the same (for example, environmental) condi-
Genome Biology 2009, Volume 10, Issue 3, Article R28 Kastenmüller et al. R28.17
Genome Biology 2009, 10:R28
tions (convergent evolution). These traits are typically found
in distinct species of very different taxonomic groups. Pheno-
type analysis with gene-based comparative methods have
mainly focused on traits that developed from the same origin.
As an example for traits that developed from different origins
by adaptation to the same conditions, we analyzed the pheno-
type 'periodontal disease causing'. Periodontal disease is a
bacterial infection of the tissues surrounding and supporting
the teeth. The disease affects 50% of US adults over the age of
30 years. Taxonomically, the species causing periodontal dis-
ease (that is, showing the phenotype 'periodontal disease
causing') are ordered into the phyla Fusobacteria, Bacterio-
detes, Spirochaetes, and Proteobacteria.
Applying our method to the phenotype 'periodontal disease
causing', we found the complete degradation of L-histidine to
ammonia, acetate, and pyruvate to be relevant for the pheno-
typic trait. According to our metabolic reconstructions, this
degradation is operative in periodontal species, while it is
missing in other oral species. On the one hand, one could
speculate that an increased amount of histidine in the saliva
of the human host might favor the growth of periodontal spe-
cies over other oral species (and finally lead to the shift in the
composition of the oral flora observed in periodontal dis-
ease). On the other hand, several clinical studies suggested
ammonia as a mediator of periodontal disease [56-59], as it
has toxic effects on the cells in the tissue surrounding the
teeth. However, many oral microorganisms - harmful and
harmless - produce ammonia by degrading various amino
acids. Nonetheless, considering the association of high
ammonia concentrations and periodontal disease, the degra-
dation of histidine is especially harmful (compared to the
degradation of other amino acids), as it generates three moles
of ammonia per mole of amino acid. Our analysis suggests
that periodontal disease causing species differ from other oral
species in their ability to degrade histidine. To the best of our
knowledge, this difference has not been noticed or investi-
gated before. Periodontal disease and the microorganisms
associated with it have been intensively studied for decades.
Throughout these studies several pathogenic factors (mainly
related to adherence) have been revealed. However, medical
treatment of periodontal disease still relies mostly on broad-
spectrum antibiotics, killing both useful and harmful oral
bacteria. The histidine degradation process could be a possi-
ble new 'target' for a more specific antibacterial treatment.
Three further hypotheses could be generated by our analysis
of the phenotype 'periodontal disease causing'. First, accord-
ing to our predictions, a part of the urea cycle is typically
missing in periodontal species (in contrast to other oral spe-
cies). Thus, periodontal species might secrete produced
ammonia directly to the host instead of metabolizing it. This
interpretation would further support that ammonia plays an
important role in periodontal disease. Second, our analysis
suggests that the metabolic processes associated with juvenile
periodontitis (caused by the species A. actinomycetemcomi-
tans) differ from other forms of periodontal disease. This is in
good agreement with clinical studies, as the amount of A.
actinomycetemcomitans does not correlate with most other
forms of periodontal disease [52]. Third, according to our
predictions, periodontal species lack the biosynthesis of pro-
line from glutamate. The most probable alternative - the syn-
thesis from ornithine - results in ammonia as a side product.
Moreover, one could speculate that a high concentration of
ornithine in saliva might increase the risk for periodontal dis-
ease. For diabetes patients, the activity of plasma arginase is
increased compared to the healthy control [67]. As arginase
catalyzes the hydrolysis of L-arginine to L-ornithine and urea,
its increased activity might lead to a higher concentration of
ornithine in blood. Assuming that the concentration of orni-
thine is also increased in human saliva, one could further
speculate that the prevalence of diabetes patients to perio-
dontal disease is connected to the alternative (bacterial) pro-
line synthesis. Several clinical studies that related increased
arginase activity in the salivary glands to periodontal disease
[68,69] further support this hypothesis.
The examples of methanogenesis and periodontal disease
demonstrate that our method - though completely based on
automatically predicted data - is able to map phenotypic traits
directly onto metabolic processes. In the case of the pheno-
type 'periodontal disease causing' we could generate several
meaningful hypotheses. Of course, these hypotheses can only
give hints as to further experimental or clinical investigations
(statistical relevance of metabolic processes for phenotypic
traits does not necessarily imply causality). Moreover, our
approach focuses on metabolic similarities of phenotypically
related species. Thus, it can only reveal pathogenic mecha-
nisms that are in common for the majority of the periodontal
species rather than specific for a single species, and that are
related to (qualitative) metabolic characteristics (covered by
the pathway database used) rather than regulatory effects. As
an example, pathogenic mechanisms such as the increased
production of a leukotoxin as result of a deletion in the ltx
operon of A. actinomycetemcomitans [70] could not be dis-
covered by our method.
In general, our automatic method for hypothesis generation
has several limitations that we have to bear in mind when
interpreting its results. First, we use automatically derived
protein annotations and data that have been automatically
derived from genomic sequences usually contain errors, gaps,
and inconsistencies. Thus, by using these data for pathway
predictions - as we did in our approach - we might miss or
overpredict pathways. However, compared to other methods
for finding phenotype-metabolism associations, our method
should compensate for parts of wrong or missing functional
protein annotation as it focuses on metabolic pathways rather
than individual genes. Nonetheless, using more reliable,
manual protein annotation would improve the reliability of
our pathway predictions. Second, we use EC numbers for
Genome Biology 2009, Volume 10, Issue 3, Article R28 Kastenmüller et al. R28.18
Genome Biology 2009, 10:R28
mapping proteins onto reactions: however, several enzymes
lack EC numbers though the reactions that they catalyze are
well known already. By using EC numbers for protein-reac-
tion mapping, we miss these reactions, restricting the utility
of our method to pathways that involve reactions and
enzymes with EC numbers assigned. Third, we use similarity-
based EC number predictions: although we received biologi-
cally reasonable results based on the comparatively simple,
similarity-based procedure for automatic EC number predic-
tions, using more sophisticated procedures might further
improve our results. Fourth are limitations with respect to the
pathways available: our method is limited to the current bio-
chemical knowledge or - more precisely - to the metabolic
knowledge represented in the pathway database that we use.
As an example, a phenotypic trait could be related to a specific
toxin, for which we do not know the synthetic pathway yet.
Since we based our analyses on a relatively small pathway col-
lection, the usage of a more comprehensive pathway database
such as MetaCyc could complement our results. Fifth are lim-
itations with respect to the genomic sequences available: the
type of species sequenced so far is highly biased towards cul-
tivable and disease-related species. This might influence our
results.
Our method is generic regarding both the type of phenotypic
traits to analyze and the set of genomes used for analysis.
Thus, in principle, our method can be applied to arbitrary
phenotypes using arbitrary sets of genomes (including newly
sequenced genomes). However, traits such as 'habitat: soil'
seem to be too unspecific to get relevant pathways by our
method. This might be due to the existence of many different
environmental conditions covered by this complex habitat
(for example, aerobe/anaerobe conditions, different nutri-
tion). Furthermore, syntrophic relationships (that is, meta-
bolic interconnection) of species in microbial communities
might complicate the analysis.
Conclusions
Here, we describe a novel method for identifying metabolic
pathways that are distinctive of a complex microbial pheno-
type and, thus, for revealing the representative biochemical
features of phenotypically related microorganisms. Relying
on functional (metabolic) entities rather than individual
genes, our approach allows for the direct generation of
hypotheses about the biochemical basis of phenotypic traits.
The potential of our method has been shown for experimen-
tally intensively studied phenotypes such as methanogenesis,
Gram-positivity, obligate anaerobicity, and obligate intracel-
lularity. For these phenotypes, our approach was able to iden-
tify biologically reasonable pathways whose association with
the phenotype is confirmed by experimental evidence. In con-
trast, periodontal disease is less well investigated as a micro-
bial phenotype, though it has been intensively studied with
respect to clinical aspects. Using the example of periodontal
disease, we demonstrate that our approach is well suited to
generate new, biologically relevant hypotheses. Our new find-
ing - that periodontal species share the ability to degrade his-
tidine - is supported by the results of several clinical studies
and can now be used to inspire new experiments.
Our method is based on the completely automated analysis of
genome data. It is generic and thus applicable to any pheno-
type and to thousands of genomes yet to be sequenced as a
result of high-throughput sequencing technologies. This also
includes species and phenotypes whose biochemistry is
largely unknown so far. The number of species that are not
accessible by experiments due to their lifestyle but for which
the genomic sequence is available will also grow enormously
in the next years. Thus, the automatic linking of phenotypes
to associated metabolic processes, as provided by our
method, will be highly valuable for the interpretation of
genome information.
Materials and methods
Genomic information
For our approach, access to a large number of automatically
annotated genomes is crucial. In principle, our method can
use annotations from a wide range of different annotation
systems and collections because it relies on EC number anno-
tations, which are provided by most of the systems available
to date. However, standardized automatic annotations (that
is, annotations that have been derived by the same means for
all genomes) are generally preferable as a basis for compara-
tive analyses. For our analyses, we chose the PEDANT
genome database. PEDANT provides exhaustive standard-
ized automatic analyses for a huge number of genomic
sequences by a large variety of established bioinformatics
tools [23,71]. In March 2006, PEDANT contained 266 com-
pletely sequenced genomes from all domains of life (mito-
chondria, chloroplasts, and genomes lacking some of their
plasmids were not considered).
After identifying the proteins of a newly sequenced genome,
PEDANT predicts EC numbers by BLAST similarity searches
[72] against the current public non-redundant set of protein
sequences. Thereby, BLAST hits up to an e-value of 0.01 are
stored within PEDANT. PEDANT assigns the EC numbers of
all BLAST hits with e-value < 0.00001. However, Rost [73]
showed that similarities in short regions and the transfer of
annotations for different domains often cause wrong EC
annotations. Rost demonstrated that a score relating
sequence identity to alignment length outperformed BLAST
e-values. Therefore, we used transferred EC annotations
based on all BLAST hits stored within PEDANT that we fur-
ther filtered for hits fulfilling:
%()
()
seqIdent length alignment
length aa sequence hit
twith t
∗
≥0≤≤1100
Genome Biology 2009, Volume 10, Issue 3, Article R28 Kastenmüller et al. R28.19
Genome Biology 2009, 10:R28
For our analyses, we used t = 12. To estimate the prediction
quality, we compared the EC numbers predicted by PEDANT
to manual EC assignments for Protochlamydia amoebophila
UWE25, Listeria monocytogenes EGD, Listeria innocua
Clip11262, and Saccharomyces cerevisiae (manual assign-
ments available within PEDANT). For these four genomes,
the sensitivity (that is, ratio of correctly predicted EC num-
bers to all manually assigned EC numbers) is 75%, 86%, 87%,
and 73%, respectively. The positive predictive value (that is,
the ratio of correctly predicted EC numbers to all predicted
EC numbers) is 84%, 79%, 79%, and 76%, respectively. The
quality of EC prediction was not sensitive for a wide range of
t (6 ≤ t ≤ 18).
Phenotypic information
Based on phenotypic descriptions provided by the NCBI
Genome Project [64], by the EBI Integr8 database [74], and
by Karyn's Genomes [75], we collected information about
presence or absence of different phenotypic traits to the 266
PEDANT genomes. In particular, the following phenotypic
features were considered: Gram stain (Gram-positive; Gram-
negative); oxygen usage ((obligate) aerobe; (obligate) anaer-
obe; facultative); special metabolism (methanogenic); patho-
genic (causing periodontal disease; causing caries); habitat
(soil; oral cavity); intracellularity (obligate; facultative)
(Additional data file 1). For our analyses we restricted our-
selves to simplified two-class phenotypes (for example, meth-
anogenic; non-methanogenic).
Reaction and pathway information
Information on biochemical reactions and known reference
pathways were taken from the free, publicly available Bio-
chemical Pathways database (BioPath) [30,76]. BioPath con-
tains data derived from the Roche Applied Science
Biochemical Pathways wall chart. About 2,000 reactions are
organized in 68 global pathways, providing a generic view of
the metabolism of different organisms. The global pathways
(for example, histidine metabolism) are divided into 306
smaller pathways according to different processes (for exam-
ple, degradation of histidine to glutamate) or phases of the
global pathways. We excluded 16 of the 306 pathways for our
study as they contain only reactions for which no EC number
is assigned. Similar to KEGG [19], BioPath provides a generic,
multi-organism view of pathways. This means that in BioPath
the reference pathways include different enzyme variants. In
contrast to KEGG, these pathways are defined in smaller sets
(5.4 reactions per reference pathway, on average, in BioPath
compared to 21 in KEGG) since different biological processes
such as degradation and biosynthetic processes correspond to
separate reference pathways in BioPath. For our purposes,
pathway maps in KEGG summarize too many different meta-
bolic functions in one unit (for example, 'arginine and proline
metabolism').
BioPath reference pathways describe metabolic capabilities
rather than specific pathway variants. Thus, using BioPath for
our analyses, our method identifies metabolic similarities of
phenotypically related species with respect to degrading or
biosynthetic capabilities. Thereby, differences related to
enzyme variants are neglected. In contrast, basing our analy-
ses on MetaCyc [29] reference pathways as such would
change the outcome of our method towards phenotype-
related pathway variants. In order to get the same type of out-
come, MetaCyc reference pathways describing variants of the
same metabolic conversion could be merged into a single ref-
erence pathway in a preprocessing step.
Metabolic reconstructions represented by pathway
profiles
We determined the metabolic complement of each genome by
a fully automated metabolic reconstruction algorithm. This
algorithm is divided into two steps. In the first step, we
selected all reactions that can be catalyzed by at least one of
the genomes' gene products. This selection was based on the
filtered EC hits for the gene products provided by PEDANT
and the EC numbers of biochemical reactions contained in
BioPath. The gene products were mapped onto the corre-
sponding biochemical reactions via matching EC numbers.
This implies that we could not map gene products onto enzy-
matic reactions without EC number assignments. For path-
ways containing such reactions the enzymes were treated as
missing in the genome.
In the second step, we determined a score for each reference
pathway p out of all 290 BioPath pathways considered in our
analyses. The higher the score, the more probable it is for the
pathway p (and thus the corresponding metabolic capability)
to be present in a genome. The score(p) depends on both the
completeness of p and the uniqueness of the involved reac-
tions among all defined pathways. The presence of an enzy-
matic reaction in p is weighted by the number of occurrences
of this reaction in all known pathways in the database. The
sum of these weighted values for all reactions in p is normal-
ized to scores ranging from 0 (no reaction of the pathway is
catalyzed) to 1 (pathway is complete). For the normalization,
this sum is divided by the maximum sum, representing the
case that all reactions in p are available in the genome.
The metabolic reconstruction of each genome was character-
ized by its pathway profile defined as the vector of pathway
scores for all considered reference pathways in BioPath
(290).
For pathways containing reactions without EC number
assignments, the maximal pathway score is always (that is, for
any genome) below 1.0 because the corresponding enzymes
are treated as missing. This does not allow for a reliable pre-
diction of the presence or absence of the respective pathway
score p
kr
occ r
rep
occ r
rep
with k r
if enzyme availa
()
()
()
()
()=
∑
∑
=
1
1 bble for reaction r
if enzyme not available for reaction r
and occ
0
⎧
⎨
⎩
(()r occurrences of reaction in all pathways
Genome Biology 2009, Volume 10, Issue 3, Article R28 Kastenmüller et al. R28.20
Genome Biology 2009, 10:R28
when a fixed score threshold is used for the prediction (see
below). Nonetheless, the relative differences of the scores
determined for the genomes (according to the remaining
enzymes) are taken into account when comparing score-
based pathway profiles as done in our approach for uncover-
ing phenotype-related pathways.
In order to evaluate the score-based metabolic reconstruc-
tions, we used the pathway reconstruction score to predict the
presence or absence of pathways in genomes. Thereby, we
predicted the presence of a pathway if the pathway received a
score of at least 0.5. It is important to note that we applied
this threshold only for evaluation purposes. In our approach
for uncovering phenotype-related pathways, we directly com-
pared the pathway profiles containing the score values
instead of binary values for the presence or absence of path-
ways.
For the evaluation, we determined the pathway reconstruc-
tion scores for the well studied pantothenate pathway in the
completely sequenced genomes provided by PEDANT. For 77
out of 78 genomes for which we found information on this
pathway in the literature, our predictions have been correct.
For two further well studied pathways - the mevalonate path-
way and the Embden-Meyerhof pathway - we manually com-
pared the EC number assignments of PEDANT to the
literature for nine model organisms. In order to study the
influence of automatic EC number prediction on the pathway
prediction for BioPath pathways, we also compared pathway
predictions based on automatically annotated EC numbers to
predictions that were based on manually annotated EC num-
bers. Additionally, we judged the quality of our metabolic
reconstructions for the genomes of M. jannaschii and
Escherichia coli K12 by comparing them to previous recon-
structions and the manually curated EcoCyc database [77],
respectively. Detailed descriptions of the complete evaluation
procedure and the results obtained are given in Additional
data file 3.
Pathway/attribute selection
In general, attribute selection denotes the identification of
attributes (here, pathways) that are most relevant (informa-
tive) in distinguishing instances (here, genomes) with differ-
ent class labels (here, phenotypic traits). Attribute selection
can rely on univariate and multivariate statistics. Univariate
methods (for example, chi square, pearson correlation) look
at the relevance of individual attributes for a specific class at
a time. Thereby, attributes are assumed to be independent.
However, attributes that are not individually relevant for the
class may become relevant in the context of other attributes.
Multivariate methods take this context into account, that is,
subsets of attributes are selected rather than individual
attributes. Thus, attributes are not assumed to be independ-
ent by multivariate methods. As we expected dependencies of
pathways for complex phenotypic traits, we used multivariate
methods for our approach.
Technically, three general strategies, namely filters and wrap-
pers and embedded methods exist to evaluate the worth of
attribute subsets [78]. Filters remove irrelevant attributes
based on general characteristics of the data. Wrappers, on the
other hand, evaluate attribute subsets by using accuracy esti-
mates provided by a certain classification algorithm. Thus,
individual needs of the classification method are taken into
account [79]. Embedded methods are also specific to a given
learning machine. But these methods select attribute subsets
during the training of the learning machine, whereas in wrap-
pers the classifier is only used as a black box to score the pre-
dictive power of attribute subsets.
For our studies, we used the implementations of attribute
subset selection methods found in the Waikato Environment
for Knowledge Analysis suite (Weka, Version 3.5.6) [80].
Weka is a free tool based on Java. It provides a large number
of machine learning algorithms and data pre-processing
methods presented in a graphical user interface for data
exploration and visualization. Weka has proven to be useful
in bioinformatics [81,82].
We used three different attribute subset selection methods:
the filter method ReliefF [34-36], a wrapper method [38]
relying on a naïve Bayes classifier [83], and the embedded
method SVMAttributeEval [37]. In order to avoid overfitting,
we applied tenfold cross-validation in the ReliefF and
SVMAttributeEval approaches, and fivefold cross-validation
in the wrapper approach.
ReliefF
ReliefF assigns a (relevance) weight to each attribute accord-
ing to how well their values distinguish among instances of
different classes and according to how well they cluster
instances of the same class. The algorithm repeatedly chooses
a random instance from the data. For this instance the near-
est instances of the same class and the nearest instances
belonging to other classes are determined. The attribute
weights are updated based on the differences between the
selected instance and its nearest neighbors. ReliefF does not
remove statistically dependent attributes. As stated above,
most multivariate methods rank subsets of attributes rather
than individual attributes. However, ReliefF relies on a mul-
tivariate relevance criterion that allows the ranking of indi-
vidual attributes according to their relevance in the context of
other attributes.
SVMAttributeEval
SVMAttributeEval combines a (linear) support vector
machine (SVM) [84] (for a brief description see below) and
the technique of recursive feature elimination (RFE) in order
to assess the relevance of attribute subsets [37]. RFE is an
iterative process of training a classifier (by optimizing the
attribute weights for the cost function), computing the
attribute ranking criterion for each attribute (by determining
the change in cost function when omitting the attribute), and
Genome Biology 2009, Volume 10, Issue 3, Article R28 Kastenmüller et al. R28.21
Genome Biology 2009, 10:R28
removing the attribute with the smallest ranking criterion. A
linear SVM represents the classifier in the case of SVMAttrib-
uteEval. SVMAttributeEval results in a complete ranking of
attributes; thereby, the ranking corresponds to nested sub-
sets of attributes.
Wrappers
Wrappers analyze the data in the context of a certain classi-
fier. For our studies, we used the naïve Bayes classifier (for a
brief description see below). Wrappers train a classifier based
on an attribute subset and score the predictive power of the
subset by cross-validation. An exhaustive search for the best
subset among all possible attribute subsets is very complex
due to the high number of possible subsets. Therefore, heuris-
tic methods are used instead. Here, we applied the best first
search as a heuristic search strategy. In contrast to ReliefF
and SVMAttributeEval, a complete ranking of all attributes is
unavailable for the wrapper approach. After fivefold cross-
validation, Weka prompts how often each of the attributes
was part of the most relevant subset throughout the five runs
(percentage). For a more thorough description of the utilized
attribute subset selection methods see [78,80,85].
If not stated otherwise, we applied the default parameters set
within Weka for each of the methods. We are aware that the
outcome of attribute selection and classification can be opti-
mized by adjusting the parameters. In particular, the out-
come of SVMs heavily depends on parameter settings. Thus,
parameter optimization might further improve our results.
Cross-check of relevant pathways by classification
In order to estimate the significance of the identified relevant
pathways for the phenotype, we cross-checked the results of
attribute subset selection by classification. For this purpose,
we classified the genomes represented by pathway profiles
that contained only the scores for the 1, 2, 3, , 20 pathways
with highest ranks. The resulting classification quality was
compared to the classification quality achieved using all path-
ways (290) and randomly selected sets of 1-20 pathways. For
estimating the random classification quality, we used 25 sets
containing 2 randomly selected pathways and calculated the
average quality, then used 25 sets containing 3 randomly
selected pathways and calculated the average quality and so
forth up to 25 sets containing 20 randomly selected pathways.
The implementation of four different classification algo-
rithms - J48, IB1, naïve Bayes, and SMO - in Weka were used
in order to avoid effects caused by biases of classifiers. J48 is
based on pruned or unpruned C4.5 [86] decision trees
learned by the algorithm. C4.5 splits the input data into
smaller subsets by iteratively choosing individual attributes
for the decision based on their information gain. IB1 [87] is a
nearest neighbor classifier based on normalized Euclidean
distance. The class of its nearest neighbor is assigned to an
instance. Naïve Bayes is a probabilistic classifier [83] that
applies a simplification of Bayes' law by (naïvely) assuming
the independence of attributes. The (posterior) probability of
a class for the given attributes of an instance is derived based
on the (prior) probability of the class and the likelihood of the
instance given the class. Prior probability and likelihood are
estimated by the corresponding frequencies in the training
data. SMO implements the sequential minimal optimization
algorithm for training a SVM [88]. A SVM is looking for a
hyperplane that is an optimal boundary between the classes
(that is, a boundary that maximizes the surrounding margin
containing no instance). The model is represented by so-
called support vectors, a small set of instances that are suffi-
cient to determine the boundary. If linear separation is not
possible, the data can be transformed to a higher dimensional
space by so-called kernel functions in order to allow linear
separation. Here, we used a linear SVM.
After tenfold cross-validation, we multiplied the resulting
selectivity and sensitivity for each classification performed.
Here, this product is referred to as classification quality. We
decided to use this measure because the product of selectivity
and sensitivity is very sensitive to either of selectivity or sen-
sitivity being low. Determining the ROC AUC is another pos-
sibility to assess classification quality, while considering both
selectivity and sensitivity. This measure has often been used
to compare the quality of different classifiers [89,90]. For-
mally, the ROC AUC is equivalent to the Mann-Whitney or
Wilcoxon non-parametric test [91]. For a two-class (positive/
negative) classification problem, the value indicates the prob-
ability that the classifier produces a higher score for a ran-
domly picked positive instance than for a randomly picked
negative instance. An ROC AUC value of 0.5 corresponds to
the value reached by random guess. Usually, values above 0.7
represent statistically reasonable classification quality. (For
an introduction to ROC analysis, see [92].) The ROC AUC val-
ues for all classifications performed are shown in Additional
data file 2.
We applied the default parameter settings given within Weka
for each classifier. We are aware that the optimization of the
parameters could improve the classification quality. How-
ever, our main aim of classification was to estimate the signif-
icance of the selected pathways rather than optimal
classification quality.
For each classification algorithm used, we plotted the classifi-
cation quality for each attribute subset selection method
depending on the number of pathways taken into account.
The corresponding random classification quality values are
given in the same diagram. A horizontal line marks the classi-
fication quality achieved when using all pathways for classifi-
cation. In order to estimate the significance of the relevant
pathways, the resulting four diagrams are checked manually.
If the following holds true for at least one of the four dia-
grams, we assume that the phenotype under consideration is
related to the selected relevant pathways: the classification
quality is considerably better than random; the classification
Genome Biology 2009, Volume 10, Issue 3, Article R28 Kastenmüller et al. R28.22
Genome Biology 2009, 10:R28
quality reaches at least the quality achieved when using all
pathways for classification; the classification quality
(assessed by the product of sensitivity and selectivity) reaches
at least 0.6. For plotting the classification quality diagrams,
we used the R statistical software package (version 2.5.1) [93].
Availability
All software developed in the scope of the work presented and
all data used in our study are freely available for non-com-
mercial, academic research purposes. The software consists
of a Java application (command line) for pathway scoring and
a Perl script for pathway selection and cross-checking (using
the free tools Weka and R). The software and the data can be
downloaded free of charge from our website [94].
Abbreviations
AUC: area under the curve; COG: Clusters of Orthologous
groups of proteins; EC: Enzyme Commission; KEGG: Kyoto
Encyclopedia of Genes and Genomes; ROC: receiver operat-
ing characteristic; SVM: support vector machine.
Authors' contributions
GK, JG, and HWM were involved in conceiving the study. GK
implemented the method, performed the data analysis and
contributed to the evaluation of the metabolic reconstruction
method. MES performed the evaluation of the metabolic
reconstruction method. GK drafted the main manuscript. All
authors read, contributed to, and approved the final manu-
script.
Additional data files
The following additional data are available with the online
version of this paper: a table listing the completely sequenced
genomes included in our analyses and the genomes' pheno-
typic traits considered (Additional data file 1); a PDF docu-
ment containing the classification quality diagrams for all
phenotypes mentioned in the manuscript and lists of the
resulting relevant pathways (Additional data file 2); a PDF
document containing detailed descriptions of the procedure
used for evaluating the automatic metabolic reconstruction
part of our method and the evaluation results obtained (Addi-
tional data file 3).
Additional data file 1Completely sequenced genomes included in our analyses and the genomes' phenotypic traitsCompletely sequenced genomes included in our analyses and the genomes' phenotypic traits.Click here for fileAdditional data file 2Classification quality diagrams for all phenotypes and the resulting relevant pathwaysClassification quality diagrams for all phenotypes and the resulting relevant pathways.Click here for fileAdditional data file 3The procedure used for evaluating the automatic metabolic recon-struction part of our method and the evaluation results obtainedThe procedure used for evaluating the automatic metabolic recon-struction part of our method and the evaluation results obtained.Click here for file
Acknowledgements
We thank Yu Wang, Thorsten Schmidt and Axel Facius for their advice
regarding statistical and machine learning issues, Mathias Walter, Martin
Münsterkötter and Thomas Rattei for their help with the PEDANT data-
base, and Oliver Sacher for advice regarding the BioPath data. We also
thank Yu Wang, Dmitrij Frishman, Karsten Suhre, and Werner Römisch-
Margl for critically reading the manuscript.
References
1. Weng L, Rubin EM, Bristow J: Application of sequence-based
methods in human microbial ecology. Genome Res 2006,
16:316-322.
2. Gill SR, Pop M, Deboy RT, Eckburg PB, Turnbaugh PJ, Samuel BS, Gor-
don JI, Relman DA, Fraser-Liggett CM, Nelson KE: Metagenomic
analysis of the human distal gut microbiome. Science 2006,
312:1355-1359.
3. Sonnenburg ED, Sonnenburg JL, Manchester JK, Hansen EE, Chiang
HC, Gordon JI: A hybrid two-component system protein of a
prominent human gut symbiont couples glycan sensing in
vivo to carbohydrate metabolism. Proc Natl Acad Sci USA 2006,
103:8834-8839.
4. von Mering C, Hugenholtz P, Raes J, Tringe SG, Doerks T, Jensen LJ,
Ward N, Bork P: Quantitative phylogenetic assessment of
microbial communities in diverse environments. Science
2007, 315:1126-1130.
5. Palmer C, Bik EM, DiGiulio DB, Relman DA, Brown PO: Develop-
ment of the human infant intestinal microbiota. PLoS Biol
2007, 5:e177.
6. Dethlefsen L, McFall-Ngai M, Relman DA: An ecological and evo-
lutionary perspective on human-microbe mutualism and dis-
ease. Nature 2007, 449:811-818.
7. Makarova KS, Wolf YI, Koonin EV: Potential genomic determi-
nants of hyperthermophily. Trends Genet 2003, 19:172-176.
8. Jim K, Parmar K, Singh M, Tavazoie S: A cross-genomic approach
for systematic mapping of phenotypic traits to genes. Genome
Res 2004, 14:109-115.
9. Levesque M, Shasha D, Kim W, Surette MG, Benfey PN: Trait-to-
Gene: a computational method for predicting the function of
uncharacterized genes. Curr Biol 2003, 13:129-133.
10. Slonim N, Elemento O, Tavazoie S: Ab initio genotype-phenotype
association reveals intrinsic modularity in genetic networks.
Mol Syst Biol 2006, 2:2006.0005.
11. Tamura M, D'haeseleer P: Microbial genotype-phenotype map-
ping by class association rule mining. Bioinformatics 2008,
24:1523-1529.
12. Martín MJ, Herrero J, Mateos A, Dopazo J: Comparing bacterial
genomes through conservation profiles. Genome Res 2003,
13:991-998.
13. Korbel JO, Doerks T, Jensen LJ, Perez-Iratxeta C, Kaczanowski S,
Hooper SD, Andrade MA, Bork P: Systematic association of
genes to phenotypes by genome and literature mining. PLoS
Biol 2005, 3:e134.
14. Tatusov RL, Fedorova ND, Jackson JD, Jacobs AR, Kiryutin B, Koonin
EV, Krylov DM, Mazumder R, Mekhedov SL, Nikolskaya AN, Rao BS,
Smirnov S, Sverdlov AV, Vasudevan S, Wolf YI, Yin JJ, Natale DA: The
COG database: an updated version includes eukaryotes.
BMC Bioinformatics 2003, 4:41.
15. Pellegrini M, Marcotte EM, Thompson MJ, Eisenberg D, Yeates TO:
Assigning protein functions by comparative genome analy-
sis: protein phylogenetic profiles. Proc Natl Acad Sci USA 1999,
96:4285-4288.
16. Haft DH, Selengut JD, Brinkac LM, Zafar N, White O: Genome
Properties: a system for the investigation of prokaryotic
genetic content for microbiology, genome annotation and
comparative genomics. Bioinformatics 2005, 21:293-306.
17. Maltsev N, Glass E, Sulakhe D, Rodriguez A, Syed MH, Bompada T,
Zhang Y, D'Souza M: PUMA2-grid-based high-throughput anal-
ysis of genomes and metabolic pathways. Nucleic Acids Res
2006, 34:D369-D372.
18. Liu Y, Li J, Sam L, Goh CS, Gerstein M, Lussier YA: An integrative
genomic approach to uncover molecular mechanisms of
prokaryotic traits. PLoS Comput Biol 2006, 2:e159.
19. Kanehisa M, Goto S, Kawashima S, Okuno Y, Hattori M: The KEGG
resource for deciphering the genome. Nucleic Acids Res 2004,
32:D277-D280.
20. Goh CS, Gianoulis TA, Liu Y, Li J, Paccanaro A, Lussier YA, Gerstein
M: Integration of curated databases to identify genotype-
phenotype associations. BMC Genomics 2006, 7:257.
21. Periodontitis Information Diseases Database [
easesdatabase.com/ddb29362.htm]
22. Fleischmann A, Darsow M, Degtyarenko K, Fleischmann W, Boyce S,
Axelsen KB, Bairoch A, Schomburg D, Tipton KF, Apweiler R:
IntEnz, the integrated relational enzyme database. Nucleic
Acids Res 2004, 32:D434-D437.
23. Frishman D, Mokrejs M, Kosykh D, Kastenmüller G, Kolesov G,
Zubrzycki I, Gruber C, Geier B, Kaps A, Albermann K, Volz A, Wag-
ner C, Fellenberg M, Heumann K, Mewes HW: The PEDANT
genome database. Nucleic Acids Res 2003, 31:207-211.
Genome Biology 2009, Volume 10, Issue 3, Article R28 Kastenmüller et al. R28.23
Genome Biology 2009, 10:R28
24. Paley SM, Karp PD: Evaluation of computational metabolic
pathway predictions for Helicobacter pylori. Bioinformatics 2002,
18:715-724.
25. Karp PD, Ouzounis CA, Moore-Kochlacs C, Goldovsky L, Kaipa P,
Ahrén D, Tsoka S, Darzentas N, Kunin V, López-Bigas N: Expansion
of the BioCyc collection of pathway/genome databases to
160 genomes. Nucleic Acids Res 2005, 33:6083-6089.
26. Liao L, Kim S, Tomb JF: Genome comparisons based on profiles
of metabolic pathways. In Proceedings of the Sixth International Con-
ference on Knowledge-Based Intelligent Information and Engineering Sys-
tems: 16-18 September 2002; Crema, Italy Edited by: Damiani E,
Howlett RJ, Jain LC, Ichalkaranje N. Amsterdam: IOS Press;
2002:469-476.
27. Hong SH, Kim TY, Lee SY: Phylogenetic analysis based on
genome-scale metabolic pathway reaction content. Appl
Microbiol Biotechnol 2004, 65:203-210.
28. Green ML, Karp PD: The outcomes of pathway database com-
putations depend on pathway ontology. Nucleic Acids Res 2006,
34:3687-3697.
29. Caspi R, Fulcher CA, Hopkinson R, Ingraham J, Kaipa P, Krummen-
acker M, Paley S, Pick J, Rhee SY, Tissier C, Zhang P, Karp PD: Met-
aCyc: a mulit-organism database of metabolic pathways and
enzymes. Nucleic Acids Res 2006, 34:D511-D516.
30. Reitz M, Sacher O, Tarkhov A, Trümbach D, Gasteiger J: Enabling
the exploration of biochemical pathways. Org Biomol Chem
2004, 2:3226-3237.
31. Michal G: Biochemical Pathways Heidelberg: Spektrum Akademischer
Verlag GmbH; 1999.
32. ExPASy - Biochemical Pathways [ />pathways/]
33. Hall MA, Holmes G: Benchmarking attribute selection tech-
niques for data mining. IEEE Trans Knowledge Data Eng 2003,
15:1-16.
34. Kira K, Rendell LA: The feature selection problem: Traditional
methods and a new algorithm.
In Proceedings of the Tenth National
Conference on Artificial Intelligence: July 12-16, 1992; San Jose, California
Cambridge: MIT Press; 1992:129-134.
35. Kira K, Rendell LA: A practical approach to feature selection.
In Proceedings of the Ninth International Conference on Machine Learning:
July 1-3, 1992. Aberdeen, Scotland, UK Edited by: Sleeman DH, Edwards
P. San Francisco, CA: Morgan Kaufmann Publishers Inc.;
1992:249-256.
36. Kononenko I: Estimating attributes: analysis and extensions of
RELIEF. In Machine Learning: ECML-94: European Conference on
Machine Learning, Catania, Italy, April 6-8, 1994. Proceedings Edited by:
Bergadano F, Raedt LD. Springer Verlag; 1994:171-182.
37. Guyon I, Weston J, Barnhill S: Gene selection for cancer classifi-
cation using support vector machines. Machine Learning 2002,
46:389-422.
38. Kohavi R, John GH: Wrappers for feature subset selection. Arti-
ficial Intelligence 1997, 97:273-324.
39. Whitman WB, Bowen TL, Boone DR: The methanogenic bacte-
ria. In The Prokaryotes Volume 3. Edited by: Dworkin M, Falko S,
Rosenberg E, Schleifer KH, Stackebrandt E. Springer Verlag;
2006:165-207.
40. Woese CR, Kandler O, Wheelis ML: Towards a natural system of
organisms: proposal for the domains Archaea, Bacteria, and
Eucarya. Proc Natl Acad Sci USA 1990, 87:4576-4579.
41. Koga Y, Nishihara M, Morii H, Akagawa-Matsushita M: Ether polar
lipids of methanogenic bacteria: structures, comparative
aspects, and biosyntheses. Microbiol Rev 1993, 57:164-182.
42. Morii H, Koga Y: CDP-2,3-Di-O-geranylgeranyl-sn-glycerol:L-
serine O-archaetidyltransferase (archaetidylserine synthase)
in the methanogenic archaeon Methanothermobacter ther-
mautotrophicus. J Bacteriol 2003, 185:1181-1189.
43. Lopalco P, Lobasso S, Babudri F, Corcelli A: Osmotic shock stim-
ulates de novo synthesis of two cardiolipins in an extreme
halophilic archaeon. J Lipid Res 2004, 45:194-201.
44. Genschel U: Coenzyme A biosynthesis: Reconstruction of the
pathway in Archaea and an evolutionary scenario based on
comparative genomics. Mol Biol Evol 2004, 21:
1242-1251.
45. Grochowski LL, Xu H, White RH: Ribose-5-phosphate biosyn-
thesis in Methanocaldococcus jannaschii occurs in the absence
of a pentose-phosphate pathway. J Bacteriol 2005,
187:7382-7389.
46. Buchenau B, Kahnt J, Heinemann IU, Jahn D, Thauer RK: Heme bio-
synthesis in Methanosarcina barkeri via a pathway involving
two methylation reactions. J Bacteriol 2006, 188:8666-8668.
47. Barker HA: Amino acid degradation by anaerobic bacteria.
Annu Rev Biochem 1981, 50:23-40.
48. Schink B, Stams AJM: Syntrophism among Prokaryotes. In The
Prokaryotes Edited by: Dworkin M, Falkow S, Rosenberg E, Schleifer
KH, Stackebrandt E. Springer Verlag; 2006:309-335.
49. Leduc D, Graziani S, Meslet-Cladiere L, Sodolescu A, Liebl U, Myllyka-
llio H: Two distinct pathways for thymidylate (dTMP) synthe-
sis in (hyper)thermophilic Bacteria and Archaea. Biochem Soc
Trans 2004, 32:231-235.
50. Myllykallio H, Lipowski G, Leduc D, Filee J, Forterre P, Liebl U: An
alternative flavin-dependent mechanism for thymidylate
synthesis. Science 2002, 297:105-107.
51. Kolenbrander PE: Oral microbial communities: biofilms, inter-
actions, and genetic systems. Annu Rev Microbiol 2000,
54:413-437.
52. Socransky SS, Haffajee AD, Smith C, Martin L, Haffajee JA, Uzel NG,
Goodson JM: Use of checkerboard DNA-DNA hybridization
to study complex microbial ecosystems. Oral Microbiol Immunol
2004, 19:352-362.
53. Haubek D, Poulsen K, Westergaard J, Dahlèn G, Kilian M: Highly
toxic clone of Actinobacillus actinomycetemcomitans in geo-
graphically widespread cases of juvenile periodontitis in ado-
lescents of African origin. J Clin Microbiol 1996, 34:1576-1578.
54. Haubek D, Dirienzo JM, Tinoco EM, Westergaard J, López NJ, Chung
CP, Poulsen K, Kilian M: Racial tropism of a highly toxic clone of
Actinobacillus actinomycetemcomitans associated with juve-
nile periodontitis.
J Clin Microbiol 1997, 35:3037-3042.
55. Pennisi E: A mouthful of microbes. Science 2005, 307:1899-1901.
56. Niederman R, Brunkhorst B, Smith S, Weinreb RN, Ryder MI:
Ammonia as a potential mediator of adult human periodon-
tal infection: Inhibition of neutrophil function. Arch Oral Biol
1990, 35(Suppl):205S-209S.
57. Takahashi N, Sato T, Yamada T: Metabolic pathways for cyto-
toxic end product formation from glutamate- and aspartate-
containing peptides by Porphyromonas gingivalis. J Bacteriol
2000, 182:4704-4710.
58. Genco RJ, Dyke TEV, Levine MJ, Nelson RD, Wilson ME: 1985 Kre-
shover lecture. Molecular factors influencing neutrophil
defects in periodontal disease. J Dent Res 1986, 65:1379-1391.
59. Suzuki JB: Diagnosis and classification of the periodontal dis-
eases. Dent Clin North Am 1988, 32:195-216.
60. Davidovich E, Schwarz Z, Davidovitch M, Eidelman E, Bimstein E:
Oral findings and periodontal status in children, adolescents
and young adults suffering from renal failure. J Clin Periodontol
2005, 32:1076-1082.
61. MetaCyc Urea Cycle [ />IMAGE?type=NIL&object=PWY-4984]
62. Martens JH, Barg H, Warren MJ, Jahn D: Microbial production of
vitamin B12. Appl Microbiol Biotechnol 2002, 58:275-285.
63. Kapatral V, Anderson I, Ivanova N, Reznik G, Los T, Lykidis A, Bhat-
tacharyya A, Bartman A, Gardner W, Grechkin G, Zhu L, Vasieva O,
Chu L, Kogan Y, Chaga O, Goltsman E, Bernal A, Larsen N, D'Souza
M, Walunas T, Pusch G, Haselkorn R, Fonstein M, Kyrpides N, Over-
beek R: Genome sequence and analysis of the oral bacterium
Fusobacterium nucleatum strain ATCC 25586. J Bacteriol 2002,
184:2005-2018.
64. Entrez Genome Project [ />rez?db=genomeprj]
65. Oralgen Databases [ />66. Riley ML, Schmidt T, Artamonova II, Wagner C, Volz A, Heumann K,
Mewes HW, Frishman D: PEDANT genome database: 10 years
online.
Nucleic Acids Res 2007, 35:D354-D357.
67. Kashyap SR, Lara A, Zhang R, Park YM, Defronzo RA: Insulin
reduces plasma arginase activity in type 2 diabetes patients.
Diabetes Care 2008, 31:134-139.
68. Özmeriç N, Elgün S, Uraz A: Salivary arginase in patients with
adult periodontitis. Clin Oral Investig 2000, 4:21-24.
69. Gheren L, Cortelli J, Rodrigues E, Holzhausen M, Saad W: Periodon-
tal therapy reduces arginase activity in saliva of patients with
chronic periodontitis. Clin Oral Investig 2008, 12:67-72.
70. Hritz M, Fisher E, Demuth DR: Differential regulation of the leu-
kotoxin operon in highly leukotoxic and minimally leuko-
toxic strains of Actinobacillus actinomycetemcomitans. Infect
Immun 1996, 64:2724-2729.
71. Pedant3 Databases [ />72. Altschul SF, Madden TL, Schäffer AA, Zhang J, Zhang Z, Miller W, Lip-
man DJ: Gapped BLAST and PSI-BLAST: a new generation of
protein database search programs. Nucleic Acids Res 1997,
Genome Biology 2009, Volume 10, Issue 3, Article R28 Kastenmüller et al. R28.24
Genome Biology 2009, 10:R28
25:3389-3402.
73. Rost B: Enzyme function less conserved than anticipated. J
Mol Biol 2002, 318:595-608.
74. Integr8 - Access to complete genomes and proteomes
[ />75. Karyn's Genomes [ />genomes.html]
76. The Biochemical Pathways Database (BioPath) [http://
www.mol-net.de/databases/biopath.html]
77. Keseler IM, Collado-Vides J, Gama-Castro S, Ingraham J, Paley S,
Paulsen IT, Peralta-Gil M, Karp PD: EcoCyc: a comprehensive
database resource for Escherichia coli. Nucleic Acids Res 2005,
33:D334-D337.
78. Guyon I, Elisseeff A: An introduction to variable and feature
selection. J Machine Learning Res 2003, 3:1157-1182.
79. Yang Y, Pedersen JO: A comparative study on feature selection
in text categorization. In Proceedings of the Fourteenth International
Conference on Machine Learning: 8-12 July 1997; Nashville, Tennessee,
USA Edited by: Fisher DH. San Francisco, CA: Morgan Kaufmann Pub-
lishers Inc.; 1997:412-420.
80. Witten IH, Frank E: Data Mining: Practical Machine Learning Tools and
Techniques 2nd edition. San Francisco, CA, USA: Morgan Kaufmann
Publishers Inc.; 2005.
81. Frank E, Hall MA, Trigg L, Holmes G, Witten IH: Data mining in
biorinformatics using Weka. Bioinformatics 2004, 20:2479-2481.
82. Wang Y, Tetko IV, Hall MA, Frank E, Facius A, Mayer KFX, Mewes
HW: Gene selection from microarray data for cancer classi-
fication-a machine learning approach. Comput Biol Chem 2005,
29:37-46.
83. John GH, Langley P: Estimating continuous distributions in
Bayesian classifiers. In Proceedings of the Eleventh Conference on
Uncertainty in Artificial Intelligence: 18-20 August 1995; Montreal, Canada
Edited by: Besnard P, Hanks S. San Francisco, CA: Morgan Kaufmann
Publishers Inc.; 1995:338-345.
84. Vapnik V, Chervonenkis A: Theory of Pattern Recognition [in Russian].
Nauka 1974.
85. Hall M, Holmes G: Benchmarking attribute selection tech-
niques for discrete class data mining. IEEE Trans Knowledge Data
Eng 2003, 15:1437-1447.
86. Quinlan JR: C4.5: Programs for Machine Learning San Francisco, Califor-
nia, USA: Morgan Kaufmann Publishers Inc.; 1993.
87. Aha D, Kibler D: Instance-based learning algorithms. Machine
Learning 1991, 6:37-66.
88. Platt J: Fast training of support vector machines using sequen-
tial minimal optimization. In Advances in Kernel Methods - Support
Vector Learning Edited by: Schoelkopf B, Burges C, Smola A. Cam-
bridge: MIT Press; 1999:185-208.
89. Zweig MH, Campbell G: Receiver-operating characteristic
(ROC) plots: a fundamental evaluation tool in clinical medi-
cine. Clin Chem 1993, 39:561-577.
90. Lasko TA, Bhagwat JG, Zou KH, Ohno-Machado L: The use of
receiver operating characteristic curves in biomedical infor-
matics. J Biomed Inform 2005, 38:404-415.
91. Hanley JA, McNeil BJ: The meaning and use of the area under a
receiver operating characteristic (ROC) curve. Radiology
1982, 143:29-36.
92. Fawcett T: An introduction to ROC analysis. Pattern Recognition
Lett 2006, 27:861-874.
93. The R Project for Statistical Computing [http://www.r-
project.org]
94. metaboloMIPS - relevant pathways (supplementary mate-
rial) [ />95. Tsoka S, Simon D, Ouzounis CA: Automated metabolic recon-
struction for Methanococcus jannaschii. Archaea 2004,
1:223-229.
96. Pinney JW, Shirley MW, McConkey GA, Westhead DR:
metaSHARK: software for automated metabolic network
prediction from DNA sequence and its application to the
genomes of Plasmodium falciparum and Eimeria tenella
.
Nucleic Acids Res 2005, 33:1399-1409.
97. Shi J, Romero PR, Schoolnik GK, Spormann AM, Karp PD: Evidence
supporting predicted metabolic pathways for Vibrio chol-
erae: gene expression data and clinical tests. Nucleic Acids Res
2006, 34:2438-2444.
98. Webb ME, Smith AG, Abell C: Biosynthesis of pantothenate. Nat
Prod Rep 2004, 21:695-721.
99. Gerdes SY, Scholle MD, D'Souza M, Bernal A, Baev MV, Farrell M,
Kurnasov OV, Daugherty MD, Mseeh F, Polanuyer BM, Campbell JW,
Anantha S, Shatalin KY, Chowdhury SAK, Fonstein MY, Osterman AL:
From genetic footprinting to antimicrobial drug targets:
examples in cofactor biosynthetic pathways. J Bacteriol 2002,
184:4555-4572.
100. Baigori M, Grau R, Morbidoni HR, de Mendoza D: Isolation and
characterization of Bacillus subtilis mutants blocked in the
synthesis of pantothenic acid. J Bacteriol 1991, 173:4240-4242.
101. Cronan JE, Littel KJ, Jackowski S: Genetic and biochemical analy-
ses of pantothenate biosynthesis in Escherichia coli and Sal-
monella typhimurium. J Bacteriol 1982, 149:916-922.
102. Premaratne RJ, Lin WJ, Johnson EA: Development of an
improved chemically defined minimal medium for Listeria
monocytogenes. Appl Environ Microbiol 1991, 57:3046-3048.
103. Sambandamurthy VK, Wang X, Chen B, Russell RG, Derrick S, Collins
FM, Morris SL, Jacobs WR: A pantothenate auxotroph of Myco-
bacterium tuberculosis is highly attenuated and protects mice
against tuberculosis. Nat Med 2002, 8:1171-1174.
104. Kaneshiro T, Arthur LO, Nickerson KW: Control of pantothen-
ate accumulation in Agrobacterium tumefaciens. J Bacteriol
1973, 113:619-626.
105. Sahm H, Eggeling L: D-Pantothenate synthesis in Corynebacte-
rium glutamicum and use of panBC and genes encoding L-
valine synthesis for D-pantothenate overproduction. Appl
Environ Microbiol 1999, 65:1973-1979.
106. Zientz E, Dandekar T, Gross R: Metabolic interdependence of
obligate intracellular bacteria and their insect hosts. Microbiol
Mol Biol Rev 2004, 68:745-770.
107. Schell MA, Karmirantzou M, Snel B, Vilanova D, Berger B, Pessi G,
Zwahlen MC, Desiere F, Bork P, Delley M, Pridmore RD, Arigoni F:
The genome sequence of Bifidobacterium longum reflects its
adaptation to the human gastrointestinal tract. Proc Natl Acad
Sci USA 2002, 99:14422-14427.
108. Kim TY, Kim HU, Park JM, Song H, Kim JS, Lee SY: Genome-scale
analysis of Mannheimia succiniciproducens metabolism. Bio-
technol Bioeng 2007, 97:657-671.
109. Delwiche EA: Vitamin requirements of the genus Propionibac-
terium. J Bacteriol 1949, 58:395-398.
110. Letort C, Juillard V: Development of a minimal chemically-
defined medium for exponential the growth of Streptococcus
thermophilus. J Appl Microbiol 2001, 91:1023-1029.
111. Eisenreich W, Bacher A, Arigoni D, Rohdich F: Biosynthesis of iso-
prenoids via the non-mevalonate pathway. Cell Mol Life Sci
2004, 61:1401-1426.
112. Lluch MA, Masferrer A, Arró M, Boronat A, Ferrer A: Molecular
cloning and expression analysis of the mevalonate kinase
gene from Arabidopsis thaliana. Plant Mol Biol 2000, 42:365-376.
113. Campbell M, Hahn FM, Poulter CD, Leustek T: Analysis of the iso-
pentenyl diphosphate isomerase gene family from Arabidop-
sis thaliana. Plant Mol Biol 1998, 36:323-328.
114. Wagner WP, Helmig D, Fall R: Isoprene biosynthesis in Bacillus
subtilis via the methylerythritol phosphate pathway.
J Nat Prod
2000, 63:37-40.
115. Takagi M, Kaneda K, Shimizu T, Hayakawa Y, Seto H, Kuzuyama T:
Bacillus subtilis ypgA gene is fni, a nonessential gene encoding
type 2 isopentenyl diphosphate isomerase. Biosci Biotechnol Bio-
chem 2004, 68:132-137.
116. Rohdich F, Bacher A, Eisenreich W: Isoprenoid biosynthetic path-
ways as anti-infective drug targets. Biochem Soc Trans 2005,
33:785-791.
117. Wilding EI, Brown JR, Bryant AP, Chalker AF, Holmes DJ, Ingraham
KA, Iordanescu S, So CY, Rosenberg M, Gwynn MN: Identification,
evolution, and essentiality of the mevalonate pathway for
isopentenyl diphosphate biosynthesis in gram-positive cocci.
J Bacteriol 2000, 182:4319-4327.
118. Barkley SJ, Cornish RM, Poulter CD: Identification of an Archaeal
type II isopentenyl diphosphate isomerase in Methano-
thermobacter thermautotrophicus. J Bacteriol 2004,
186:1811-1817.
119. Daum G, Lees ND, Bard M, Dickson R: Biochemistry, cell biology
and molecular biology of lipids of Saccharomyces cerevisiae.
Yeast 1998, 14:1471-1510.
120. Tsay YH, Robinson GW: Cloning and characterization of ERG8,
an essential gene of Saccharomyces cerevisiae that encodes
phosphomevalonate kinase. Mol Cell Biol 1991, 11:620-631.
121. Cordier H, Lacombe C, Karst F, Bergès T: The Saccharomyces cer-
evisiae mevalonate diphosphate decarboxylase (erg19p)
forms homodimers in vivo, and a single substitution in a
structurally conserved region impairs dimerization. Curr
Genome Biology 2009, Volume 10, Issue 3, Article R28 Kastenmüller et al. R28.25
Genome Biology 2009, 10:R28
Microbiol 1999, 38:290-294.
122. Anderson MS, Muehlbacher M, Street IP, Proffitt J, Poulter CD: Iso-
pentenyl diphosphate:dimethylallyl diphosphate isomerase.
An improved purification of the enzyme and isolation of the
gene from Saccharomyces cerevisiae. J Biol Chem 1989,
264:19169-19175.
123. Kuzuyama T: Mevalonate and nonmevalonate pathways for
the biosynthesis of isoprene units. Biosci Biotechnol Biochem 2002,
66:1619-1627.
124. Disch A, Rohmer M: On the absence of the glyceraldehyde 3-
phosphate/pyruvate pathway for isoprenoid biosynthesis in
fungi and yeasts. FEMS Microbiol Lett 1998, 168:201-208.
125. Lichtenthaler HK, Schwender J, Disch A, Rohmer M: Biosynthesis of
isoprenoids in higher plant chloroplasts proceeds via a
mevalonate-independent pathway. FEBS Lett 1997,
400:271-274.
126. Rodríguez-Concepción M, Boronat A: Elucidation of the meth-
ylerythritol phosphate pathway for isoprenoid biosynthesis
in bacteria and plastids. A metabolic milestone achieved
through genomics. Plant Physiol 2002, 130:1079-1089.
127. Giegé P, Heazlewood JL, Roessner-Tunali U, Millar AH, Fernie AR,
Leaver CJ, Sweetlove LJ: Enzymes of glycolysis are functionally
associated with the mitochondrion in Arabidopsis cells. Plant
Cell 2003, 15:2140-2151.
128. Wienkoop S, Glinski M, Tanaka N, Tolstikov V, Fiehn O, Weckwerth
W: Linking protein fractionation with multidimensional
monolithic reversed-phase peptide chromatography/mass
spectrometry enhances protein identification from complex
mixtures even in the presence of abundant proteins. Rapid
Commun Mass Spectrom 2004, 18:643-650.
129. Baud S, Graham IA: A spatiotemporal analysis of enzymatic
activities associated with carbon metabolism in wild-type
and mutant embryos of Arabidopsis using in situ histochemis-
try. Plant J 2006, 46:155-169.
130. Mesak LR, Mesak FM, Dahl MK: Bacillus subtilis GlcK activity
requires cysteines within a motif that discriminates micro-
bial glucokinases into two lineages. BMC Microbiol 2004, 4:6.
131. Prasad C, Diesterhaft M, Freese E: Initiation of spore germina-
tion in glycolytic mutants of Bacillus subtilis. J Bacteriol 1972,
110:321-328.
132. Chander M, Setlow B, Setlow P: The enzymatic activity of phos-
phoglycerate mutase from gram-positive endospore-form-
ing bacteria requires Mn2+ and is pH sensitive. Can J Microbiol
1998, 44:759-767.
133. Dandekar T, Schuster S, Snel B, Huynen M, Bork P: Pathway align-
ment: application to the comparative analysis of glycolytic
enzymes. Biochem J 1999, 343:115-124.
134. Iliffe-Lee ER, McClarty G: Glucose metabolism in Chlamydia tra-
chomatis : the'energy parasite' hypothesis revisited. Mol
Microbiol 1999, 33:177-187.
135. Froman BE, Tait RC, Gottlieb LD: Isolation and characterization
of the phosphoglucose isomerase gene from Escherichia coli.
Mol Gen Genet 1989, 217:126-131.
136. Neidhardt FC, Vaughn V, Phillips TA, Bloch PL: Gene-protein index
of Escherichia coli K-12. Microbiol Rev 1983, 47:231-284.
137. Thomson GJ, Howlett GJ, Ashcroft AE, Berry A: The dhnA gene of
Escherichia coli encodes a class I fructose bisphosphate aldo-
lase. Biochem J 1998, 331:437-445.
138. Hillman JD: Mutant analysis of glyceraldehyde 3-phosphate
dehydrogenase in Escherichia coli. Biochem J 1979, 179:99-107.
139. D'Alessio G, Josse J: Glyceraldehyde phosphate dehydroge-
nase, phosphoglycerate kinase, and phosphoglyceromutase
of Escherichia coli. Simultaneous purification and physical
properties. J Biol Chem 1971, 246:4319-4325.
140. Bond CS, White MF, Hunter WN: Mechanistic implications for
Escherichia coli cofactor-dependent phosphoglycerate
mutase based on the high-resolution crystal structure of a
vanadate complex. J Mol Biol 2002, 316:1071-1081.
141. Kühnel K, Luisi BF: Crystal structure of the Escherichia coli RNA
degradosome component enolase. J Mol Biol 2001, 313:583-592.
142. Saeki T, Hori M, Umezawa H: Pyruvate kinase of Escherichia coli.
Its role in supplying nucleoside triphosphates in cells under
anaerobic conditions. J Biochem 1974, 76:631-637.
143. Tatusov RL, Mushegian AR, Bork P, Brown NP, Hayes WS, Boro-
dovsky M, Rudd KE, Koonin EV: Metabolism and evolution of
Haemophilus influenzae deduced from a whole-genome com-
parison with Escherichia coli. Curr Biol 1996, 6:279-291.
144. Pollack JD: Mycoplasma genes: a case for reflective annota-
tion. Trends Microbiol 1997, 5:413-419.
145. Sasaki H, Uemura H: Influence of low glycolytic activities in gcr1
and gcr2 mutants on the expression of other metabolic path-
way genes in Saccharomyces cerevisiae. Yeast 2005, 22:111-127.
146. Stryer L: Die Glykolyse. In Biochemie [in German] Heidelberg:
Spektrum Akademischer Verlag; 1995:507-533.
147. Selkov E, Maltsev N, Olsen GJ, Overbeek R, Whitman WB: A recon-
struction of the metabolism of Methanococcus jannaschii
from sequence data. Gene 1997, 197:GC11-GC26.