Báo cáo y học: "A novel and universal method for microRNA RT-qPCR data normalization" ppsx
Bạn đang xem bản rút gọn của tài liệu. Xem và tải ngay bản đầy đủ của tài liệu tại đây (292.5 KB, 10 trang )
Genome Biology 2009, 10:R64
Open Access
2009Mestdaghet al.Volume 10, Issue 6, Article R64
Method
A novel and universal method for microRNA RT-qPCR data
normalization
Pieter Mestdagh
*
, Pieter Van Vlierberghe
*
, An De Weer
*
, Daniel Muth
†
,
Frank Westermann
†
, Frank Speleman
*
and Jo Vandesompele
*
Addresses:
*
Center for Medical Genetics, Ghent University Hospital, De Pintelaan 185, Ghent, Belgium.
†
Department of Tumour Genetics,
German Cancer Center, Im Neuenheimer Feld 280, Heidelberg, Germany.
Correspondence: Jo Vandesompele. Email:
© 2009 Mestdagh et al.; licensee BioMed Central Ltd.
This is an open access article distributed under the terms of the Creative Commons Attribution License ( which
permits unrestricted use, distribution, and reproduction in any medium, provided the original work is properly cited.
Normalization of microRNA RT-qPCR<p>The mean expression value: a new method for accurate and reliable normalization of microRNA expression data from RT-qPCR exper-iments.</p>
Abstract
Gene expression analysis of microRNA molecules is becoming increasingly important. In this study
we assess the use of the mean expression value of all expressed microRNAs in a given sample as a
normalization factor for microRNA real-time quantitative PCR data and compare its performance
to the currently adopted approach. We demonstrate that the mean expression value outperforms
the current normalization strategy in terms of better reduction of technical variation and more
accurate appreciation of biological changes.
Background
MicroRNAs (miRNAs) are an important class of gene regula-
tors, acting on several aspects of cellular function such as dif-
ferentiation, cell cycle control and stemness. Not
surprisingly, deregulated miRNA expression has been impli-
cated in a wide variety of diseases, including cancer [1]. More-
over, miRNA expression profiling of different tumor entities
resulted in the identification of miRNA signatures correlating
with patient diagnosis, prognosis and response to treatment
[2]. Despite the small size of miRNA molecules, several tech-
nologies have been developed that enable high-throughput
and sensitive miRNA profiling, such as microarrays [3-8],
real-time quantitative PCR (RT-qPCR) [9,10] and bead-based
flow cytometry [2]. In terms of accuracy and specificity, RT-
qPCR has become the method of choice for measuring gene
expression levels, both for coding and non-coding RNAs.
However, the accuracy of the results is largely dependent on
proper data normalization. As numerous variables inherent
to an RT-qPCR experiment need to be controlled for in order
to differentiate experimentally induced variation from true
biological changes, the use of multiple reference genes is gen-
erally accepted as the gold standard for RT-qPCR data nor-
malization [11]. Typically, a set of candidate reference genes is
evaluated in a pilot experiment with representative samples
from the experimental condition(s). Ideally these candidate
reference genes belong to different functional classes, signifi-
cantly reducing the possibility of confounding co-regulation.
In case of miRNA profiling, only few candidate reference
miRNAs have been reported [12]. Generally, other small non-
coding RNAs are used for normalization. These include both
small nuclear RNAs (for example, U6) and small nucleolar
RNAs (for example, U24, U26).
Strategies for normalization of high-dimensional expression
profiling experiments (using, for example, microarray tech-
nology, but recently also transcriptome sequencing) generally
take advantage of the huge amount of data generated and
often use (almost) all available data points. These strategies
range from a straightforward approach based on the mean or
median expression value to more complex algorithms such as
Published: 16 June 2009
Genome Biology 2009, 10:R64 (doi:10.1186/gb-2009-10-6-r64)
Received: 2 April 2009
Revised: 2 April 2009
Accepted: 16 June 2009
The electronic version of this article is the complete one and can be
found online at /> Genome Biology 2009, Volume 10, Issue 6, Article R64 Mestdagh et al. R64.2
Genome Biology 2009, 10:R64
lowess normalization, quantile normalization or rank invari-
ant normalization [13]. In this study we successfully intro-
duce the mean expression value in a given sample to
normalize high-throughput miRNA RT-qPCR data and com-
pare its performance to the currently adopted approach based
on small nuclear/nucleolar RNAs. In addition, we provide a
workflow for proper data normalization of both large scale
(whole miRNome) and small scale miRNA profiling experi-
ments.
Results
Stability of the mean miRNA expression
To evaluate the suitability of the mean miRNA expression
value as a normalization factor, we profiled 448 miRNAs and
controls in a subset of 61 neuroblastoma (NB) tumor samples
and 384 miRNAs and controls in 49 T-cell acute lymphoblas-
tic leukemia (T-ALL) samples, 18 leukemias with EVI1 over-
expression, 8 normal human tissues and 11 normal bone
marrow samples using a high throughput miRNA profiling
platform based on Megaplex stem-loop RT-qPCR technology
in combination with a limited cycle pre-amplification [9,10].
For each of the above mentioned sample sets all 18 available
small RNA controls were quantified. For each individual sam-
ple, the mean expression value was calculated based on those
miRNAs that were expressed according to a Cq detection cut-
off of 35 PCR cycles [10] (Cq, or quantification cycle, is the
standard name for the Ct or Cp value according to Real-time
PCR Data Markup Language (RDML) guidelines [14]).
Expression stability of the mean expression value, the small
RNA controls and a selection of three miRNAs (miR-17-5p,
miR-191 and miR-103) previously proposed as universal ref-
erence miRNAs was then assessed for each sample set using
the geNorm algorithm [11]. To reduce the risk of including
genes that are putatively co-regulated, a number of small
RNA controls residing within the same gene cluster were dis-
carded, retaining only one representative small RNA control
per cluster. This was the case for RNU44, U47 and U75 on
1q25, and RNU58A and RNU58B on 18q21, of which RNU44
and RNU58A were randomly retained for further analysis.
Naturally, only those small RNA controls that are expressed
in all samples within a sample set were evaluated for their
expression stability.
geNorm analysis clearly shows that the mean expression
value is a suitable normalization factor in the different tissue
groups under investigation. In terms of expression stability,
the mean expression value is top ranked in the T-ALL sam-
ples, the NB samples, the normal human tissues and the nor-
mal bone marrow samples when compared to 16, 17, 14 and 18
candidate small RNA controls/miRNAs, respectively (Figure
1 and Additional data file 1). For the leukemia samples with
EVI1 overexpression the mean expression value ranked sec-
ond (compared to 17 small RNA controls/miRNAs; Addi-
tional data file 1). Several of the high ranking small RNA
controls are the same ones proposed by the manufacturer as
most suitable for miRNA normalization. The expression sta-
bility of one of the so-called universal reference miRNAs
(miR-191) proposed by Peltier and Latham [12] equaled that
of the mean expression value in the NB sample set. In the
other sample sets, none of these three miRNAs performed as
well as the mean expression value. When we calculated an
alternative mean expression value (only including those miR-
NAs that are expressed in all samples within a given sample
set), it was never as good or better (in terms of suitability as
normalization factor) than the mean expression value of all
expressed miRNAs. This indicates that the mean expression
value more faithfully represents the input amount when all
expressed miRNAs per sample are considered. All results
obtained with geNorm were independently confirmed with
the Normfinder algorithm [15] (data not shown).
Mean expression value normalization reduces
technical variation
The variation in gene expression data is a combination of bio-
logical and technical variation. The purpose of normalization
is to reduce the technical variation within a dataset, enabling
a better appreciation of the biological variation. We calcu-
lated the coefficient of variation (CV) for each individual
miRNA across all samples within a given tissue group and
used it as a normalization performance measure. Lower CVs
hereby denote better removal of experimentally induced
noise [16,17]. Relative expression data were normalized using
either the mean expression value of all expressed miRNAs or
the mean of the most stable small RNA controls (as identified
by geNorm; arithmetic means were calculated in log space).
The optimal number of stable controls was determined on the
basis of a pairwise variation analysis between subsequent
normalization factors using a cut-off value of 0.15 as
described in Vandesompele et al. [11]. The cumulative distri-
bution of the individual CV values was plotted for both raw
(not normalized) and normalized data (Figure 2).
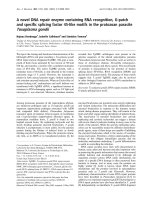
geNorm expression stability plotFigure 1
geNorm expression stability plot. Expression stability of 13 different small
RNA controls and the mean expression value in the T-cell acute
lymphoblastic leukaemia sample set. The mean expression value shows the
highest expression stability across all 49 samples analyzed.
0
0,2
0,4
0,6
0,8
1
1,2
1,4
1,6
1,8
1.8
1.6
1.4
1.2
1.0
0.8
0.6
0.4
0.2
0.0
Expression stability
Genome Biology 2009, Volume 10, Issue 6, Article R64 Mestdagh et al. R64.3
Genome Biology 2009, 10:R64
While normalization using stable small RNA controls clearly
results in a significant decrease of the CV value in the NB sam-
ple set, this shift is only apparent for the 50% least variable
miRNAs (paired sample t-test, P < 0.001; Figure 2 and Addi-
tional data file 2). For the 50% most variable miRNAs no sig-
nificant reduction in variation is observed (P = 0.253;
Additional data file 2), indicating that elimination of techni-
cal variation is restricted to only half of the miRNAs profiled.
In contrast, after normalization with the mean expression
value there is an overall decrease in variation that is signifi-
cant both for the 50% least variable (P < 0.001) and the 50%
most variable (P < 0.001) miRNAs (Additional data file 2).
Furthermore, a more pronounced reduction in variation is
observed compared to stable small RNA control normaliza-
tion (Figure 2). As true differentially expressed miRNAs pre-
dominantly reside in the most variable half of the dataset
(50% most variable), only mean expression value normaliza-
tion is capable of reducing the number of false negatives.
Reduction of false positives is possible with both normaliza-
tion strategies but to different extents as mean expression
value normalization results in a stronger decrease of technical
variation for the 50% least variable miRNAs. Similar results
were obtained for the other sample sets (Additional data file
3 and data not shown).
Mean expression value normalization identifies true
biological changes in patient samples
While the mean expression value is the best ranked normali-
zation factor and significantly reduces technical variation, the
question remains how different normalization strategies
affect biological changes. To address this issue, we evaluated
differential expression of the miRNAs belonging to the mir-
17-92 cluster in the NB sample set. The miR-17-92 cluster
contains a total of six different miRNAs (miR-17, miR-18a,
miR-19a, miR-20a, miR-19b and miR-92) and has recently
been shown to be a direct target of the MYC family of tran-
scription factors using chromatin immunoprecipitation
(ChIP) [18,19]. In NB cells, MYCN directly binds to the miR-
17-92 promoter, resulting in an activation of mir-17-92
expression [18]. Accordingly, NB cells with amplification and
activation of the MYCN oncogene display elevated mir-17-92
expression [18,20,21].
To confirm MYCN binding to the miR-17-92 promoter, we
performed ChIP-chip experiments using a MYCN-specific
antibody in three different NB cell lines, Kelly, IMR5 and
WAC2. To assess whether transcripts from this region are
actively transcribed and elongated, we additionally analyzed
histone marks for active transcription (H3K4me3), repres-
sion (H3K27me3), and elongation (H3K36me3) together
with MYCN binding. In all tested NB cell lines, binding of
MYCN was preferentially found to the miR-17-92 promoter
region encompassing the two canonical e-boxes upstream of
miR-17 (Additional data file 4). Furthermore, MYCN binding
to the miR-17-92 promoter was strongly associated with his-
tone marks for active transcription (H3K4me3) and elonga-
tion (H3K36me3) (Additional data file 4). To confirm the
MYCN ChIP-chip data, we performed ChIP-qPCR on ChIP
samples from WAC2 and IMR5 cells. Both promoter frag-
ments were enriched in the two cell lines under investigation,
with fold changes comparable to that of the MDM2 positive
control, confirming direct MYCN binding to the miR-17-92
promoter (Additional data file 5).
To assess the impact of different normalization strategies on
differential miR-17-92 expression, the NB sample set, con-
sisting of 22 MYCN amplified (MNA) and 39 MYCN single
copy (MNSC) tumor samples, was normalized using either
the mean expression value or the stable small RNA controls.
Differential miR-17-92 expression was then evaluated by
means of the average fold change in expression between the
MNA and MNSC tumor samples (Figure 3). When the data
are normalized using the stable small RNA controls, none of
the 8 miRNA transcripts that were analyzed reach a 2-fold
expression difference and only one miRNA, miR-92, exceeds
a 1.5-fold expression difference (fold change = 1.85). Moreo-
ver, miR-92 is the only miRNA from the miR-17-92 cluster
with a significant differential expression between MYCN
amplified and MYCN single copy tumor samples (Mann-
Whitney, Benjamini-Hochberg multiple testing correction, P
< 0.05).
These results are not in line with previous studies reporting
differential expression of multiple miRNAs from the miR-17-
92 cluster nor do they match our findings, and those of others,
regarding the direct interaction between MYCN and the miR-
17-92 promoter [18]. Furthermore, our analysis of histone
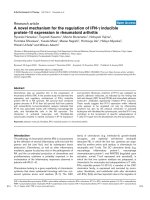
Cumulative distribution of miRNA coefficient of variation (CV) valuesFigure 2
Cumulative distribution of miRNA coefficient of variation (CV) values. The
cumulative distribution of miRNA CV values in the neuroblastoma sample
set when no normalization is applied (blue), stable RNA control (RNU24,
RNU44, RNU58A and RNU6B) normalization is applied (red), mean
expression value normalization is applied (green) or normalization with
miRNAs/small RNA controls resembling the mean expression value (Z30,
RNU24, miR-361, miR-331 and miR-423) is applied (purple).
0
10
20
30
40
50
60
70
80
90
100
0 50 100 150 200 250 300
not normalized
stable controls
mean
miRNAs
Cummulative distribution (%)
CV (%)
Genome Biology 2009, Volume 10, Issue 6, Article R64 Mestdagh et al. R64.4
Genome Biology 2009, 10:R64
markers bound to the region is more in line with an actively
transcribed entire miR-17-92 cluster in MYCN amplified cell
lines. When the same dataset is normalized with the mean
expression value, 7 miRNAs reach a 1.5-fold expression dif-
ference and half of the miRNAs exceed the 2-fold expression
difference. All but one miRNA, mir-17-3p, were found to be
significantly differentially expressed between MNA and
MNSC tumors (Mann-Whitney, Benjamini-Hochberg multi-
ple testing correction, P < 0.05). A recent study by Chen and
Stallings [20] reports on differential miRNA expression
between MNA and MNSC tumors, measured by stem-loop
RT-qPCR. Here, only one miRNA from the five miR-17-92
miRNAs that were evaluated was reported as significantly
upregulated in the MNA tumor samples. In that study,
miRNA expression data were normalized using two small
RNA controls, RNU19 and RNU66. We reanalyzed the same
dataset and applied the mean expression value normalization
strategy. As expected, all but one miRNA, miR-17-3p, were
significantly upregulated in the MNA tumors (Mann-Whit-
ney, Benjamini-Hochberg multiple testing correction, P <
0.05; data not shown).
To ascertain that these observations are not restricted to miR-
17-92, we identified an additional MYCN regulated miRNA
cluster using ChIP-chip. MiR-181a-1 and miR-181b-1 are
located within 500 bp of each other and show strong MYCN
binding in two MNA NB cell lines, Kelly and IMR5. MYCN
binding was strongly associated with histone marks for tran-
scription (H3K4me3) and elongation (H3K36me3) (Addi-
tional data file 6). Accordingly, mir-181a and mir-181b
expression should be upregulated in MNA NB tumor sam-
ples. Upon mean expression value normalization, both miR-
NAs exceed the 1.5-fold expression difference (FC
mir-181a
=
2.28, FC
mir-181b
= 1.67). Upon normalization with stable small
RNA controls, only miR-181a has a fold change above 1.5-fold
(FC
mir-181a
= 1.59). For miR-181b, no change in expression
could be detected (FC
mir-181b
= 1.14). These results confirm
that the ability of mean expression normalization to extract
true biological variation from a dataset is not limited to miR-
17-92.
Mean expression value normalization identifies true
biological changes in cell lines
While small RNA control normalization fails to identify dif-
ferential miR-17-92 expression in patient tumor samples, it
has been successfully applied by Fontana and colleagues [18]
to detect differential miR-17-92 expression in NB cell lines.
To evaluate our method in cell lines, we measured miRNA
expression in two NB cell lines also used by Fontana and col-
leagues, one MYCN single copy (SK-N-AS) and one MYCN
amplified (IMR-32). MiR-17-92 fold induction upon mean
expression value normalization was consistently higher com-
pared to fold inductions reported by Fontana and colleagues.
Further, fold changes for all 5 miRNAs exceed the 1.5-fold
expression difference whereas with small RNA control nor-
malization this is only true for 4 out of 5 miRNAs (Additional
data file 7).
Mean expression value normalization reduces false
positive MYCN downregulated miRNAs
We sought further support for our new normalization strategy
by investigating the overall differential miRNA expression in
the two subsets of NB tumor samples. miRNAs that were not
expressed in all samples were excluded from the analysis to
avoid over- or underestimation of fold changes. Upon nor-
malization with stable small RNA controls, we found an aver-
age miRNA expression fold change of 0.756, suggesting that
the majority of the miRNAs were downregulated in the MNA
tumor samples. Indeed, 89.1% of the miRNAs displaying a
minimum 1.5-fold expression difference are expressed at
lower levels in the MNA tumor samples (Additional data file
8) indicating a bias towards the identification of downregu-
lated miRNAs. When normalizing with the mean expression
value the average miRNA expression fold change levels out to
a value of 1.036, representing a more balanced situation.
Here, only 57.6% of the differentially expressed miRNAs are
downregulated in the MNA tumor samples. Moreover, the
fold change expression difference for the 10% most downreg-
ulated miRNAs, identified after stable small RNA control nor-
malization, remains largely unaffected upon normalization
with the mean expression value (Additional data file 9), sug-
gesting that this normalization strategy more adequately
reduces the number of false positive MYCN downregulated
miRNAs compared to stable small RNA control normaliza-
tion. This is in perfect agreement with the larger reduction of
variation obtained with mean expression value normalization
(see above).
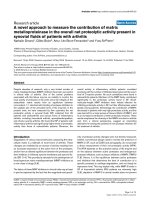
Differential miR-17-92 expression in neuroblastoma tumor samplesFigure 3
Differential miR-17-92 expression in neuroblastoma tumor samples.
Average fold change expression difference of eight different miRNAs
residing within the miR-17-92 cluster in MYCN amplified neuroblastoma
samples compared to MYCN single copy neuroblastoma samples. Fold
changes were calculated upon stable small RNA control (RNU24, RNU44,
RNU58A and RNU6B) normalization (dark grey), mean expression value
normalization (light grey) and normalization with miRNAs that resemble
the mean expression value (miR-425, miR-191 and miR-125a; medium
grey.
0
0,5
1
1,5
2
2,5
3
3,5
4
stable controls
mean
miRNAs
Fold change
4
3.5
3.0
2.5
2.0
1.5
1.0
0.5
0.0
Genome Biology 2009, Volume 10, Issue 6, Article R64 Mestdagh et al. R64.5
Genome Biology 2009, 10:R64
miRNAs resembling the mean
The use of the mean expression value for data normalization
implies that a large number of genes are profiled (450 or 384
in this study). Such screening experiments are often per-
formed in an initial phase but almost never in subsequent val-
idation studies that focus on a limited number of miRNAs.
We therefore assessed whether we could identify miRNAs or
small RNA controls that resemble the mean expression value
and whether their geometric mean could be successfully used
to mimic mean expression value normalization. After log
transformation, we calculated the geNorm pairwise variation
V value to determine robust similarity in expression of a given
gene with the mean expression value. For each tissue group
the optimal number of miRNAs/small RNA controls was
selected and the geometric mean of their relative expression
values was used for normalization (Table 1). In the NB sample
set, the reduction in technical variation is highly similar to
that obtained after mean expression value normalization, as
illustrated by the cumulative distribution plot of miRNA CV
values (Figure 2). Here also, the overall decrease in variation
is significant both for the 50% least variable (P < 0.001) and
the 50% most variable (P < 0.001) miRNAs (Additional data
file 2). Similar results were obtained for other sample sets
(Additional data file 3). These findings indicate that the geo-
metric mean of a limited number of carefully selected miR-
NAs/small RNA controls that resemble the mean can be
successfully used for normalization of gene expression profil-
ing experiments in follow-up studies where only a limited
number of miRNA molecules are studied.
We further investigated the use of these stable miRNAs/small
RNA controls for normalization by evaluating the impact on
differential miRNA expression. In the NB sample set, differ-
ential expression of the miR-17-92 cluster is significant for all
but one miRNA, with fold changes highly similar to those
obtained upon normalization with the mean expression value
(Figure 3). Moreover, miRNA expression profiles generated
with both normalization strategies are significantly corre-
lated as over 90% of all miRNAs display a correlation coeffi-
cient above 0.8 and 65% have a correlation coefficient above
0.9 (Spearman's Rank rho value; Figure 4). Similar results
were obtained with other sample sets (data not shown).
Normalization using miRNAs that resemble the mean
is platform independent
Finally, the correlation between both normalization strate-
gies was validated on an independent dataset of microarray
miRNA expression data from 12 NB cell lines. Probe intensi-
ties were log transformed and the mean expression value was
calculated for each array. Subsequently, miRNAs with expres-
sion levels correlating to the mean expression value were
identified as outlined above and the best miRNAs were
selected for further normalization. Log intensities were nor-
malized using either the mean expression value of all probes
or the mean expression of the selected miRNAs. Hierarchical
clustering of a compiled dataset consisting of mean and
miRNA normalized samples reveals a high correlation
between each sample pair as pairs consistently cluster
together (Additional data file 10). Over 95% of all miRNAs
show a correlation coefficient above 0.7 and 87% have a cor-
relation coefficient above 0.8 (Spearman's Rank rho value).
These results illustrate that normalization using miRNAs that
resemble the mean expression value is platform independent
and closely mimics normalization using the mean expression
value.
Discussion
In this study we present the use of the mean miRNA expres-
sion value as a new method for miRNA RT-qPCR data nor-
malization. This method was validated across different
independent datasets and clearly outperforms the current
normalization strategy that is based on the use of endogenous
small RNA controls. Our results demonstrate that the mean
expression value of all expressed miRNAs is characterized by
high expression stability, according to geNorm analysis,
resulting in an adequate removal of technical variability, as
measured by the CV of normalized expression values. While
mean normalization results in reduction of noise over all
expressed miRNA, stable small RNA control normalization
only achieves this for the 50% least variable miRNAs. Inter-
estingly, the mean expression value of all expressed miRNAs
performs better than one based on only those miRNAs that
are expressed in all samples. This suggests a more accurate
representation of input RNA fluctuations when all miRNAs
are considered. Furthermore, the mean expression value is
Table 1
Selection of miRNAs that resemble the mean expression value
Neuroblastoma T-ALL EVI1 leukemia Normal tissue Normal bone marrow
miR-425* Z30
†
miR-191* miR-572* miR-140*
miR-191* RNU24
†
miR-140* let-7f* miR-30c*
miR-125a* miR-361* miR-16* miR-632* miR-328*
miR-331* miR-339*
miR-423* RPL21
†
*Human mature miRNA.
†
Small RNA control. T-ALL, T-cell acute lymphoblastic leukaemia.
Genome Biology 2009, Volume 10, Issue 6, Article R64 Mestdagh et al. R64.6
Genome Biology 2009, 10:R64
more stable than a set of three miRNAs (miR-103, miR-191
and miR-17-5p) previously proposed as universal reference
miRNAs [12]. Only in the NB sample set could we confirm sta-
ble expression of miR-191 and miR-103. miR-17-5p is acti-
vated by MYC transcription factors, which results in mir-17-
5p overexpression in tumors with activated MYC signaling
[18,19]. Moreover, mir-17-5p is located on 13q31.3, a region
frequently amplified in B-cell lymphomas, resulting in ele-
vated mir-17-5p expression [22]. Accordingly, mir-17-5p does
not qualify as a proper candidate reference miRNA.
Several studies report on the use of synthetic RNA or miRNA
molecules as spike-in controls for mRNA/miRNA expression
data normalization [23-26]. While these kind of controls have
value in assay validation and quality control, they only correct
for extraction efficiency (when added to the cells prior to RNA
isolation) or reverse transcription efficiency (when added to
the RNA) differences when using them for normalization. As
such, they do not control for all experimental variability, and
are not assumption-free as it is assumed that the experi-
menter starts with the same quantity of equal quality tem-
plate. Normalization factors that are based on endogenous
small RNA molecules, such as the small RNA controls,
miRNA molecules, or the mean miRNA expression value, are
therefore preferred.
To assess the impact of small RNA control, miRNA or mean
expression value normalization on biological variation, we
studied the differential expression of the miR-17-92 cluster in
the NB dataset, consisting of samples with and without
MYCN amplification. Because differential expression of this
miRNA cluster has been repeatedly documented, both in the
context of MYC family transcription factors and in the context
of NB tumors [18,19], we reasoned that it could serve as an
excellent positive control. Strikingly, only 1 of the 8 miR-17-
92 miRNAs analyzed showed an expression fold change of at
least 1.5-fold after small RNA control normalization. A 1.5-
fold expression difference cut-off is based on several miRNA
profiling studies confirming that subtle changes in miRNA
expression, such as a 1.5-fold difference, can have a signifi-
cant impact on the biology of the cell [27-32]. As a conse-
quence, a proper normalization strategy that enables
detection of these small changes is of the utmost importance.
Upon mean expression value normalization, seven miRNAs
exceeded the 1.5-fold expression difference. For one miRNA,
mir-17-3p, no expression difference was detected; however,
the status of mir-17-3p as a functional miRNA is still contro-
versial [19,33,34].
We and others have shown that MYC transcription factors
actively bind to the miR-17-92 promoter [18,19]. In addition,
we here describe histone marks associated with active tran-
scription and elongation that are not restricted to a single
miRNA but encompass the entire set of miRNAs from the
miR-17-92 cluster. Taken together with the fact that the miR-
17-92 cluster is transcribed as a single transcript (pri-miR-17-
92) [22], most likely all miRNAs should be activated in the
MNA NB cells. The results obtained with mean expression
value normalization are best in line with this hypothesis.
While small RNA control normalization in the clinical tumor
samples appears not to be affective, in cultured cells this
strategy is capable of detecting differential expression for the
majority of the mir-17-92 miRNAs [18]. This could be
explained by the degree of heterogeneity of the sample set
under consideration. Tumor samples are typically more het-
erogeneous than cultured cells and, therefore, require a more
robust normalization strategy that is able to reduce this vari-
ability.
Apart from differential miR-17-92 expression, we also evalu-
ated global miRNA expression in the NB tumors with regard
to MYCN amplification status. Upon normalization with sta-
ble small RNA controls, differential miRNA expression was
highly unbalanced, with 89.1% of all differentially expressed
miRNAs being downregulated. In contrast, literature reports
on differential mRNA expression with regard to MYCN
amplification status suggest a more balanced situation. From
a total of 678 coding genes that have been described as differ-
entially expressed, 63% are upregulated and 37% are down-
regulated [35]. The unbalanced differential miRNA
expression that is observed upon stable small RNA control
normalization is most likely caused by an unbalanced nor-
malization factor that hypercorrects miRNA expression in
MYCN amplified tumors. Indeed, we calculated a signifi-
cantly higher normalization factor for amplified versus not-
amplified tumors (data not shown). Furthermore, small RNA
controls and miRNAs are transcribed by different RNA
polymerases [36], possibly making these small RNA controls
improper normalizers for miRNA expression. This has been
well established for mRNA expression normalization as
Cumulative distribution of Spearman's Rank rho valuesFigure 4
Cumulative distribution of Spearman's Rank rho values. The cumulative
distribution of the Spearman's Rank rho values for each individual miRNA
in the neuroblastoma sample set. The rho-values represent the degree of
correlation between the miRNA expression profile upon mean expression
value normalization or normalization with miRNAs resembling the mean
expression value.
0
10
20
30
40
50
60
70
80
90
100
0,6 0,65 0,7 0,75 0,8 0,85 0,9 0,95 1
Cummulative distribution (%)
Spearman’s Rank rho-value
0.6 0.65 0.7 0.75 0.8 0.85 0.9 0.95 1
Genome Biology 2009, Volume 10, Issue 6, Article R64 Mestdagh et al. R64.7
Genome Biology 2009, 10:R64
ribosomal RNAs, which are transcribed by RNA polymerase I,
are often poor and unstable normalizers for mRNAs [11],
which are transcribed by RNA polymerase II. Mean expres-
sion value normalization is based on the expression of miR-
NAs and results in a more balanced differential miRNA
expression with only 57.6% downregulated miRNAs.
Importantly, mean expression value normalization is only
valid if a large number of miRNAs are profiled. However, for
small scale experiments, typically focusing on a selection of
miRNAs, this is not the case. To overcome this problem, we
have shown that it is possible to identify miRNAs and small
RNA controls that resemble the mean expression value. Our
results indicate that a normalization factor based on the selec-
tion of miRNAs/small RNA controls resembling the mean
expression value performs equally well as the mean expres-
sion value itself. We therefore propose a workflow consisting
of a pilot experiment in which miRNAs/small RNA controls
can be identified that resemble the mean expression value.
Subsequently, these can be used for proper normalization of
miRNA expression in targeted small scale experiments,
focusing on only a limited number of genes. miRNA gene
expression studies in which no prior whole miRNome expres-
sion profiling can be performed should be preceded by a care-
ful selection of the most stable small RNA controls. In this
case, cautious interpretation of the data is warranted.
Conclusions
A proper normalization strategy is a crucial aspect of the RT-
qPCR data analysis workflow. For large scale miRNA expres-
sion profiling studies we have shown that mean expression
value normalization outperforms the current normalization
strategy that makes use of small RNA controls. For those
experiments focusing on a limited number of miRNAs we
propose a workflow that is based on the selection of miRNAs/
small RNA controls that resemble the mean expression value.
This strategy is innovative, straightforward and universally
applicable and enables a more accurate assessment of rele-
vant biological variation from a miRNA RT-qPCR experi-
ment.
Materials and methods
Samples
A total of 147 samples from 5 different tissue groups were
used in this study, including 61 NB tumors, 49 T-ALL sam-
ples, 18 leukemias with EVI1 overexpression, 8 normal
human tissue samples (brain, colon, heart, kidney, liver, lung,
breast, adrenal gland) and 11 normal bone marrow samples.
RNA samples from the normal human tissue group were
obtained from Stratagene (Cedar Creek, TX, USA). NB tumor
RNA was isolated using the miRNeasy mini kit (Qiagen,
Valencia, CA, USA) according to the manufacturer's instruc-
tions. RNA from leukemic and normal bone marrow samples
was isolated as described previously [37]. For each sample,
total RNA integrity was measured using the Experion (Bio-
Rad, Hercules, CA, USA) and evaluated through the RNA
quality index; for all samples this was higher than 5.
RDML data and MIQE guidelines
Compliance of qPCR experiments with the MIQE (Minimum
Information for Publication of Quantitative Real-Time PCR
Experiments) guidelines [38,39] is listed in the MIQE check-
list (Additional data file 11). Raw miRNA expression, experi-
mental annotation and sample annotation are available in the
RDML data format [14,40] (Additional data file 12).
Cell culture
Twelve NB cell lines (NGP, IMR-32, SMS-KAN, SK-N-
BE(2c), LAN-5, LAN-6, SK-MYC2, SK-N-AS, SK-N-SH, NBL-
S, SK-N-FI and CLB-GA) were cultured in RPMI 1640
medium (Invitrogen, Carlsbad, CA, USA) supplied with 15%
fetal calf serum, 1% penicillin/streptomycin, 1% kanamycin,
1% glutamine, 2% HEPES (1 M), 1% sodiumpyruvate (100
nM) and 0.1% beta-mercapto (50 nM). At 80% confluence,
cells were harvested by scraping for total RNA isolation
(miRNeasy, Qiagen).
MicroRNA profiling
miRNA expression was measured as described previously
[10]. Briefly, 20 ng of total RNA was reverse transcribed using
the Megaplex RT stem-loop primer pool (Applied Biosystems,
Foster City, CA, USA), enabling miRNA specific cDNA syn-
thesis for 430 different human miRNAs and 18 small RNA
controls. Subsequently, Megaplex RT product was pre-ampli-
fied by means of a 14-cycle PCR reaction with a miRNA spe-
cific forward primer and universal reverse primer to increase
detection sensitivity. Finally, a 1,600-fold dilution of pre-
amplified miRNA cDNA was used as input for a 40-cycle
qPCR reaction with miRNA specific hydrolysis probes and
primers (Applied Biosystems). All reactions were performed
on the 7900 HT (Applied Biosystems) using the gene maximi-
zation strategy [41]. Raw Cq values were calculated using the
SDS software version 2.1 applying automatic baseline settings
and a threshold of 0.05. For further data analysis, only those
miRNAs with a Cq value equal to or below 35 (representing
single molecule template detection [10]) were taken into
account. For NB tumor samples all 448 miRNAs and small
RNA controls were profiled. RT-qPCR assays were spread
across two 384-well plates. Inter-run variation was accounted
for by equalizing the mean Cq-value of the 18 small RNA con-
trols that were profiled in both plates. For the remaining sam-
ples 366 miRNAs and 18 small RNA controls were profiled in
a single 384-well plate.
Selection of stable normalizers
Assessing gene expression stability of putative normalizer
genes was done using two different algorithms, geNorm [11]
and Normfinder [15]. Raw Cq values were transformed to lin-
ear scale before analysis. Normalization factors were calcu-
lated as the geometric mean of the expression of the stable
Genome Biology 2009, Volume 10, Issue 6, Article R64 Mestdagh et al. R64.8
Genome Biology 2009, 10:R64
normalizers [41]. Selection of the optimal number of stable
normalizers was based on geNorm's pairwise variation analy-
sis between subsequent normalization factors using a cut-off
value of 0.15 for the inclusion of additional normalizers [11].
Selection of miRNAs/small RNA controls that
resemble the mean expression value
For robust and unbiased selection of genes whose expression
level best correlates with the mean expression level, we used
the geNorm V value [11]. In brief, for each miRNA and small
RNA control we calculated the difference between its Cq value
and the average Cq value of all expressed genes, per sample,
within a given sample set. Next, the standard deviation of
these differences was determined for every miRNA and small
RNA control. The miRNAs or small RNA controls with the
lowest standard deviation most closely resemble the mean
expression value. The optimal number of miRNAs/small
RNA controls for normalization was determined upon
geNorm analysis of the ten best ranked normalizers. To avoid
including miRNAs that are putatively co-regulated, we deter-
mined their genomic location and excluded those miRNAs
that are located within 2 kb of each other using miRGen [42].
Co-regulated miRNAs were replaced by the next best ranked
miRNA.
Chromatin immunoprecipitation
Immunoprecipitation was performed as described previously
using 10 μg of MYCN (Santa Cruz, sc-53993, Santa Cruz, CA,
USA) antibodies [43]. Histone marks for active transcription
(H3K4me3; Abcam, ab8580, Cambridge, MA, USA), repres-
sion (H3K27me3; Upstate, 07-449, Lake Placid, NY, USA),
and elongation (H3K36me3; Abcam, ab9050) were assessed
together with MYCN binding. ChIP-DNA templates from
Kelly, IMR5, WAC2 cells using MYCN, H3K4me3,
H3K27me3 and H3K36me3 were amplified for DNA microar-
ray analysis (Agilent Human Promoter ChIP-chip Set 244 K,
Santa Clara, CA, USA) using the WGA (whole genome ampli-
fication) (Sigma, St. Louis, MO, USA) method as previously
described [43]. DNA labeling, array hybridization and meas-
urement were performed according to Agilent mammalian
ChIP-chip protocols. For the visualization of ChIP-chip
results, the cureos package version 0.2 for R was used (avail-
able upon request).
Real-time ChIP-qPCR was performed using SYBR Green I
detection chemistry (Eurogentec, Seraing, Belgium) on a
LightCycler480 (Roche, Basel, Switzerland). Primer
sequences for MYCN binding sites in the mir-17-92 and
MDM2 promoter regions were described previously [19,44].
Signals were normalized based on the average abundance of
three non-specific genomic regions in the ChIP samples using
qBasePlus version 1.1 software [45]. Fold enrichment in the
MYCN precipitated samples was calculated relative to the
input sample and compared to that of a fourth non-specific
region. All primer sequences are available in the public
RTprimerDB database [46] (gene (RTPrimerDB-ID): miR-
17-92 promoter A (7796), miR-17-92 promoter B (7797),
MDM2 promoter (7798), non-specific region 1 (7799), non-
specific region 2 (7800), non-specific region 3 (7801), non-
specific region 4 (7802)) [47].
Locked nucleic acid microarrays
In total, 5 μg of total RNA was hybridized to immobilized
locked nucleic acid-modified capture probes according to
Castoldi et al. [48]. Background- and flag-corrected median
intensities were log transformed and normalized according to
the mean signal of each array.
Hierarchical clustering
Hierarchical clustering of the miRNA expression data was
performed using Spearman's rank correlation as the sample
and gene distance measure and pairwise complete linkage as
implemented in the Genepattern 2.0 software [49].
Abbreviations
ChIP: chromatin immunoprecipitation; CV: coefficient of
variation; miRNA: microRNA; MNA: MYCN amplified;
MNSC: MYCN single copy; NB: neuroblastoma; RDML: Real-
time PCR Data Markup Language; RT-qPCR: real-time quan-
titative PCR; T-ALL: T-cell acute lymphoblastic leukaemia.
Authors' contributions
PM carried out the miRNA profiling experiments and data
analysis and drafted the manuscript. PVV and ADW per-
formed miRNA profiling experiments. DM and FW are
responsible for MYCN ChIP-on-chip data. FS and JV con-
ceived the study and participated in its design and coordina-
tion. All authors read and approved the final manuscript.
Additional data files
The following additional data are available with the online
version of this paper: a figure showing geNorm expression
stability plots (Additional data file 1); a figure showing the
mean miRNA CV value in the neuroblastoma sample set
(Additional data file 2); a figure showing the cumulative dis-
tribution of miRNA CV values (Additional data file 3); a figure
showing ChIP-chip results for the miR-17-92 cluster (Addi-
tional data file 4); a figure showing ChIP-qPCR results for the
miR-17-92 cluster (Additional data file 5); a figure showing
ChIP-chip results for the miR-181a-1/miR-181b-1 cluster
(Additional data file 6); a figure showing miR-17-92 expres-
sion in neuroblastoma cell lines (Additional data file 7); a fig-
ure showing overall differential miRNA expression in the
neuroblastoma sample set (Additional data file 8); a figure
showing fold change expression difference correlation for
MYCN downregulated miRNAs (Additional data file 9); a fig-
ure showing hierarchical clustering of neuroblastoma cell
lines based on miRNA expression (Additional data file 10); a
table listing the MIQE checklist (Additional data file 11); a col-
Genome Biology 2009, Volume 10, Issue 6, Article R64 Mestdagh et al. R64.9
Genome Biology 2009, 10:R64
lection of RDML files containing miRNA expression for all
data sets (Additional data file 12).
Additional data file 1geNorm expression stability plotsExpression stability of small RNA controls and the mean expres-sion value in (a) the neuroblastoma sample set, (b) the leukemias with EVI1 overexpression, (c) the normal bone marrow samples and (d) the normal human tissues.Click here for fileAdditional data file 2Mean miRNA CV value in the neuroblastoma sample setMean miRNA CV value for (a) the 50% least variable and (b) 50% most variable miRNAs when no normalization is applied, stable small RNA control normalization is applied, mean expression value normalization is applied or normalization with miRNAs/small RNA controls resembling the mean is applied. (a) All three nor-malization strategies result in a significant decrease of the mean CV value. (b) Only mean expression value normalization and normal-ization with miRNAs/small RNA controls resembling the mean result in a significant decrease of the mean CV value. Stable small RNA controls for the T-ALL samples: RNU24, RNU44, RNU48, RNU58A, U18 and Z30; for the leukemias with EVI1 overexpres-sion: RNU6B, RNU24 and RNU58A; for the normal bone marrow samples: RNU44, RNU24 and RNU48; and for the normal human tissues: RPL21, RNU38B and RNU24. MiRNAs/small RNA con-trols that resemble the mean expression value are listed in Table 1.Click here for fileAdditional data file 3Cumulative distribution of miRNA CV valuesThe cumulative distribution of miRNA CV-values in (a) the T-ALL sample set, (b) the leukemias with EVI1 overexpression, (c) the normal bone marrow samples and (d) the normal human tissues when no normalization is applied (blue), stable RNA control nor-malization is applied (red), mean expression value normalization is applied (green) or normalization with miRNAs resembling the mean expression value is applied (purple). Stable small RNA con-trols for the T-ALL samples: RNU24, RNU44, RNU48, RNU58A, U18 and Z30; for the leukemias with EVI1 overexpression: RNU6B, RNU24 and RNU58A; for the normal bone marrow samples: RNU44, RNU24 and RNU48; for the normal human tissues: RPL21, RNU38B and RNU24. MiRNAs/small RNA controls that resemble the mean expression value are listed in Table 1.Click here for fileAdditional data file 4ChIP-chip of the miR-17-92 clusterChIP-chip results of the miR-17-92 cluster are given for Kelly, IMR5, and WAC2. Oligonucleotide position is given as bars accord-ing to the chromosomal localization. Color coding of the bars rep-resents the log2 ratios MYCN versus input from ChIP-chip experiments, were red means positive and green negative values. Histone marks for active transcription (H3K4me3), repression (H3K27me3) and enlongation (H3K36me3) as measured by ChIP-chip are given together with MYCN binding using the same color coding. miRNA transcript information (miRBase version 11.0), CpG islands, and conservation among 28 species were imple-mented for the region as given by the respective annotation tracks deposited in the UCSC database (Hg 18, release March 2006). Posi-tion of canonical (CACGTG) and non-canonical E-boxes from in sil-ico scanning of the respective sequence is given. Grey coding for results of the positional weight matrix (PWM) scan represents the P-values of the 12 bp MYCN binding motif from the TRANSFAC database. Red line = median log2 ratio MYCN versus input as cal-culated for each chromosome individually.Click here for fileAdditional data file 5ChIP-qPCR for the miR-17-92 clusterFold enrichment of specific and non-specific genomic regions in the MYCN precipitated samples compared to the input sample as determined by qPCR. MiR-17-92 promoter A and miR-17-92 pro-moter B are two MYCN specific e-box containing regions in the miR-17-92 promoter. MDM2 promoter is a MYCN specific e-box containing region in the MDM2 promoter and serves as a positive control. The negative control is a non-specific, non e-box contain-ing genomic region.Click here for fileAdditional data file 6ChIP-chip of the miR-181a-1/miR-181b-1 clusterChIP-chip results of the miR-181a-1/miR-181b-1 cluster are given for Kelly, IMR5, and WAC2. Oligonucleotide position is given as bars according to the chromosomal localization. Color coding of the bars represents the log2 ratios MYCN versus input from ChIP-chip experiments, were red means positive and green negative values. Histone marks for active transcription (H3K4me3), repression (H3K27me3) and enlongation (H3K36me3) as measured by ChIP-chip are given together with MYCN binding using the same color coding. miRNA transcript information (miRBase version 11.0), CpG islands, and conservation among 28 species were imple-mented for the region as given by the respective annotation tracks deposited in the UCSC database (Hg 18, release March 2006). Posi-tion of canonical (CACGTG) and non-canonical E-boxes from in sil-ico scanning of the respective sequence is given. Grey coding for results of the positional weight matrix (PWM) scan represents the P-values of the 12 bp MYCN binding motif from the TRANSFAC database. Red line = median log2 ratio MYCN versus input as cal-culated for each chromosome individually.Click here for fileAdditional data file 7MiR-17-92 expression in neuroblastoma cell linesRelative expression of miR-17-5p, miR-18a, miR-19a, miR-20a and miR-92a in one MYCN single copy cell line (SK-N-AS) and one MYCN amplified cell line (IMR-32) upon mean expression value normalization. Relative expression values were rescaled to those in SK-N-AS.Click here for fileAdditional data file 8Overall differential miRNA expression in the neuroblastoma sam-ple setAverage fold change expression difference of all miRNAs with an expression below the Cq cutoff of 35 PCR cycles in MYCN amplified neuroblastoma samples compared to MYCN single copy neuroblas-toma samples. Fold changes were calculated upon stable small RNA control normalization (black) and mean expression value nor-malization (orange). Plotted fold changes are log
2
-based and sorted from positive (upregulated in MYCN amplified tumor samples) to negative (downregulated in MYCN amplified tumor samples). Dashed lines represent a two-fold expression difference. Arrows indicate the threshold between up- and downregulated miRNAs for both normalization strategies (the number of up- and downregu-lated miRNAs is indicated left and right of each arrow, respec-tively).Click here for fileAdditional data file 9Fold change expression difference correlationCorrelation plot showing the average fold change expression differ-ence for the 10% most downregulated miRNAs in MYCN amplified tumors compared to MYCN single copy tumors upon stable small RNA control normalization (x-axis) and mean expression value normalization (y-axis). Both axes are log
2
-based. The correspond-ing trend line has a coefficient of determination of 0.973 (R
2
), a slope approaching 1 and a Y-intercept of 0.449.Click here for fileAdditional data file 10Hierarchical clusteringHeatmap representing a hierarchical clustering analysis of 24 paired samples based on their miRNA expression profiles. Each sample pair consists of a different neuroblastoma cell line for which the miRNA expression was normalized with the mean expression value or with miRNAs resembling the mean expression value. Cell lines are numbered from 1 to 12. The tag represents the applied nor-malization strategy (M stands for mean expression value normali-zation, m for normalization with miRNAs resembling the mean expression value).Click here for fileAdditional data file 11MIQE checklistCompliance of qPCR experiments with the MIQE guidelines.Click here for fileAdditional data file 12RDML filesRDML files containing miRNA expression and a sample annotation for each sample set.Click here for file
Acknowledgements
The authors gratefully acknowledge Applied Biosystems for providing pre-
release access to the Megaplex and PreAmp based miRNA profiling tech-
nology, Dr Y Chen and Dr R Stallings for providing their miRNA RT-qPCR
dataset. This work was supported by Kinderkankerfonds (a nonprofit child-
hood cancer foundation under Belgian law) and the Ghent University
Research Fund (BOF) [01D31406 to PM].
References
1. Esquela-Kerscher A, Slack FJ: Oncomirs - microRNAs with a role
in cancer. Nat Rev Cancer 2006, 6:259-269.
2. Lu J, Getz G, Miska EA, Alvarez-Saavedra E, Lamb J, Peck D, Sweet-
Cordero A, Ebert BL, Mak RH, Ferrando AA, Downing JR, Jacks T,
Horvitz HR, Golub TR: MicroRNA expression profiles classify
human cancers. Nature 2005, 435:834-838.
3. Barad O, Meiri E, Avniel A, Aharonov R, Barzilai A, Bentwich I, Einav
U, Gilad S, Hurban P, Karov Y, Lobenhofer EK, Sharon E, Shiboleth
YM, Shtutman M, Bentwich Z, Einat P: MicroRNA expression
detected by oligonucleotide microarrays: system establish-
ment and expression profiling in human tissues. Genome Res
2004, 14:2486-2494.
4. Castoldi M, Schmidt S, Benes V, Noerholm M, Kulozik AE, Hentze
MW, Muckenthaler MU: A sensitive array for microRNA
expression profiling (miChip) based on locked nucleic acids
(LNA). Rna 2006, 12:913-920.
5. Liu CG, Calin GA, Meloon B, Gamliel N, Sevignani C, Ferracin M,
Dumitru CD, Shimizu M, Zupo S, Dono M, Alder H, Bullrich F,
Negrini M, Croce CM: An oligonucleotide microchip for
genome-wide microRNA profiling in human and mouse tis-
sues. Proc Natl Acad Sci USA 2004, 101:9740-9744.
6. Nelson PT, Baldwin DA, Scearce LM, Oberholtzer JC, Tobias JW,
Mourelatos Z: Microarray-based, high-throughput gene
expression profiling of microRNAs. Nat Methods 2004,
1:155-161.
7. Sioud M, Rosok O: Profiling microRNA expression using sensi-
tive cDNA probes and filter arrays. Biotechniques 2004,
37:574-576. 578-580.
8. Thomson JM, Parker J, Perou CM, Hammond SM: A custom micro-
array platform for analysis of microRNA gene expression.
Nat Methods 2004, 1:47-53.
9. Chen C, Ridzon DA, Broomer AJ, Zhou Z, Lee DH, Nguyen JT, Bar-
bisin M, Xu NL, Mahuvakar VR, Andersen MR, Lao KQ, Livak KJ, Gue-
gler KJ: Real-time quantification of microRNAs by stem-loop
RT-PCR. Nucleic Acids Res 2005, 33:e179.
10. Mestdagh P, Feys T, Bernard N, Guenther S, Chen C, Speleman F,
Vandesompele J: High-throughput stem-loop RT-qPCR
miRNA expression profiling using minute amounts of input
RNA. Nucleic Acids Res
2008, 36:e143.
11. Vandesompele J, De Preter K, Pattyn F, Poppe B, Van Roy N, De
Paepe A, Speleman F: Accurate normalization of real-time
quantitative RT-PCR data by geometric averaging of multi-
ple internal control genes. Genome Biol 2002, 3:RESEARCH0034.
12. Peltier HJ, Latham GJ: Normalization of microRNA expression
levels in quantitative RT-PCR assays: identification of suita-
ble reference RNA targets in normal and cancerous human
solid tissues. Rna 2008, 14:844-852.
13. Workman C, Jensen LJ, Jarmer H, Berka R, Gautier L, Nielser HB,
Saxild HH, Nielsen C, Brunak S, Knudsen S: A new non-linear nor-
malization method for reducing variability in DNA microar-
ray experiments. Genome Biol 2002, 3:RESEARCH0048.
14. Lefever S, Hellemans J, Pattyn F, Przybylski DR, Taylor C, Geurts R,
Untergasser A, Vandesompele J, RDML consortium: RDML: struc-
tured language and reporting guidelines for real-time quan-
titative PCR data. Nucleic Acids Res 2009, 37:2065-2069.
15. Andersen CL, Jensen JL, Orntoft TF: Normalization of real-time
quantitative reverse transcription-PCR data: a model-based
variance estimation approach to identify genes suited for
normalization, applied to bladder and colon cancer data
sets. Cancer Res 2004, 64:5245-5250.
16. Sysi-Aho M, Katajamaa M, Yetukuri L, Oresic M: Normalization
method for metabolomics data using optimal selection of
multiple internal standards. BMC Bioinformatics 2007, 8:93.
17. Wu W, Dave N, Tseng GC, Richards T, Xing EP, Kaminski N: Com-
parison of normalization methods for CodeLink Bioarray
data. BMC Bioinformatics 2005, 6:309.
18. Fontana L, Fiori ME, Albini S, Cifaldi L, Giovinazzi S, Forloni M, Bold-
rini R, Donfrancesco A, Federici V, Giacomini P, Peschle C, Fruci D:
Antagomir-17-5p abolishes the growth of therapy-resistant
neuroblastoma through p21 and BIM. PLoS ONE 2008, 3:e2236.
19. O'Donnell KA, Wentzel EA, Zeller KI, Dang CV, Mendell JT: c-Myc-
regulated microRNAs modulate E2F1 expression. Nature
2005, 435:839-843.
20. Chen Y, Stallings RL: Differential patterns of microRNA expres-
sion in neuroblastoma are correlated with prognosis, differ-
entiation, and apoptosis.
Cancer Res 2007, 67:976-983.
21. Schulte JH, Horn S, Otto T, Samans B, Heukamp LC, Eilers UC,
Krause M, Astrahantseff K, Klein-Hitpass L, Buettner R, Schramm A,
Christiansen H, Eilers M, Eggert A, Berwanger B: MYCN regulates
oncogenic microRNAs in neuroblastoma. Int J Cancer 2008,
122:699-704.
22. He L, Thomson JM, Hemann MT, Hernando-Monge E, Mu D, Good-
son S, Powers S, Cordon-Cardo C, Lowe SW, Hannon GJ, Hammond
SM: A microRNA polycistron as a potential human oncogene.
Nature 2005, 435:828-833.
23. Gilsbach R, Kouta M, Bonisch H, Bruss M: Comparison of in vitro
and in vivo reference genes for internal standardization of
real-time PCR data. Biotechniques 2006, 40:173-177.
24. Huggett J, Dheda K, Bustin S, Zumla A: Real-time RT-PCR nor-
malisation; strategies and considerations. Genes Immun 2005,
6:279-284.
25. Sarkar D, Parkin R, Wyman S, Bendoraite A, Sather C, Delrow J, God-
win AK, Drescher C, Huber W, Gentleman R, Tewari M: Quality
assessment and data analysis for microRNA expression
arrays. Nucleic Acids Res 2009, 37:e17.
26. Smith RD, Brown B, Ikonomi P, Schechter AN: Exogenous refer-
ence RNA for normalization of real-time quantitative PCR.
Biotechniques 2003, 34:88-91.
27. Hu SJ, Ren G, Liu JL, Zhao ZA, Yu YS, Su RW, Ma XH, Ni H, Lei W,
Yang ZM: MicroRNA expression and regulation in mouse
uterus during embryo implantation. J Biol Chem 2008,
283:23473-23484.
28. Ohlsson Teague EM, Hoek KH Van der, Hoek MB Van der, Perry N,
Wagaarachchi P, Robertson SA, Print CG, Hull LM: MicroRNA-reg-
ulated pathways associated with endometriosis. Mol Endocrinol
2009, 23:265-275.
29. Pradervand S, Weber J, Thomas J, Bueno M, Wirapati P, Lefort K,
Dotto GP, Harshman K: Impact of normalization on miRNA
microarray expression profiling. Rna 2009, 15:493-501.
30. Tzur G, Levy A, Meiri E, Barad O, Spector Y, Bentwich Z, Mizrahi L,
Katzenellenbogen M, Ben-Shushan E, Reubinoff BE, Galun E: Micro-
RNA expression patterns and function in endodermal differ-
entiation of human embryonic stem cells. PLoS ONE
2008,
3:e3726.
31. Wang LL, Zhang Z, Li Q, Yang R, Pei X, Xu Y, Wang J, Zhou SF, Li Y:
Ethanol exposure induces differential microRNA and target
gene expression and teratogenic effects which can be sup-
pressed by folic acid supplementation. Hum Reprod 2009,
24:562-579.
32. Chang TC, Yu D, Lee YS, Wentzel EA, Arking DE, West KM, Dang
CV, Thomas-Tikhonenko A, Mendell JT: Widespread microRNA
repression by Myc contributes to tumorigenesis. Nat Genet
2008, 40:43-50.
33. Lee EJ, Baek M, Gusev Y, Brackett DJ, Nuovo GJ, Schmittgen TD: Sys-
tematic evaluation of microRNA processing patterns in tis-
sues, cell lines, and tumors. Rna 2008, 14:35-42.
34. Venturini L, Battmer K, Castoldi M, Schultheis B, Hochhaus A, Muck-
enthaler MU, Ganser A, Eder M, Scherr M: Expression of the miR-
17-92 polycistron in chronic myeloid leukemia (CML) CD34+
cells. Blood 2007, 109:4399-4405.
35. MYCNot Database [ />36. Hernandez N: Small nuclear RNA genes: a model system to
study fundamental mechanisms of transcription. J Biol Chem
2001, 276:26733-26736.
37. Van Vlierberghe P, van Grotel M, Beverloo HB, Lee C, Helgason T,
Buijs-Gladdines J, Passier M, van Wering ER, Veerman AJ, Kamps WA,
Meijerink JP, Pieters R: The cryptic chromosomal deletion
del(11)(p12p13) as a new activation mechanism of LMO2 in
pediatric T-cell acute lymphoblastic leukemia. Blood 2006,
Genome Biology 2009, Volume 10, Issue 6, Article R64 Mestdagh et al. R64.10
Genome Biology 2009, 10:R64
108:3520-3529.
38. Bustin SA, Benes V, Garson JA, Hellemans J, Huggett J, Kubista M,
Mueller R, Nolan T, Pfaffl MW, Shipley GL, Vandesompele J, Wittwer
CT: The MIQE guidelines: minimum information for publica-
tion of quantitative real-time PCR experiments. Clin Chem
2009, 55:611-622.
39. MIQE Guidelines [ />40. Real-time PCR Data Markup Language (RDML) [http://
www.rdml.org]
41. Hellemans J, Mortier G, De Paepe A, Speleman F, Vandesompele J:
qBase relative quantification framework and software for
management and automated analysis of real-time quantita-
tive PCR data. Genome Biol 2007, 8:R19.
42. Megraw M, Sethupathy P, Corda B, Hatzigeorgiou AG: miRGen: a
database for the study of animal microRNA genomic organ-
ization and function. Nucleic Acids Res 2007, 35:D149-155.
43. Westermann F, Muth D, Benner A, Bauer T, Henrich KO, Oberthuer
A, Brors B, Beissbarth T, Vandesompele J, Pattyn F, Hero B, Konig R,
Fischer M, Schwab M: Distinct transcriptional MYCN/c-MYC
activities are associated with spontaneous regression or
malignant progression in neuroblastomas. Genome Biol 2008,
9:R150.
44. Slack A, Chen Z, Tonelli R, Pule M, Hunt L, Pession A, Shohet JM: The
p53 regulatory gene MDM2 is a direct transcriptional target
of MYCN in neuroblastoma. Proc Natl Acad Sci USA 2005,
102:731-736.
45. qBasePlus []
46. RTPrimerDB []
47. Lefever S, Vandesompele J, Speleman F, Pattyn F: RTPrimerDB: the
portal for real-time PCR primers and probes. Nucleic Acids Res
2009, 37:D942-D945.
48. Castoldi M, Schmidt S, Benes V, Hentze MW, Muckenthaler MU:
miChip: an array-based method for microRNA expression
profiling using locked nucleic acid capture probes. Nat Protoc
2008, 3:321-329.
49. Reich M, Liefeld T, Gould J, Lerner J, Tamayo P, Mesirov JP: GenePa-
ttern 2.0. Nat Genet 2006, 38:500-501.