Báo cáo y học: "A hidden reservoir of integrative elements is the major source of recently acquired foreign genes and ORFans in archaeal and bacterial genomes" pdf
Bạn đang xem bản rút gọn của tài liệu. Xem và tải ngay bản đầy đủ của tài liệu tại đây (374.91 KB, 13 trang )
Genome Biology 2009, 10:R65
Open Access
2009Cortezet al.Volume 10, Issue 6, Article R65
Research
A hidden reservoir of integrative elements is the major source of
recently acquired foreign genes and ORFans in archaeal and
bacterial genomes
Diego Cortez, Patrick Forterre and Simonetta Gribaldo
Address: Institut Pasteur, Département de Microbiologie, Unité de Biologie Moléculaire du Gène chez les Extrêmophiles, Rue du Dr Roux, 75
724 PARIS cedex 15, France.
Correspondence: Patrick Forterre. Email: Simonetta Gribaldo. Email:
© 2009 Cortez et al.; licensee BioMed Central Ltd.
This is an open access article distributed under the terms of the Creative Commons Attribution License ( which
permits unrestricted use, distribution, and reproduction in any medium, provided the original work is properly cited.
Integrative elements and new genes<p>A large-scale survey of potential recently acquired integrative elements in 119 archaeal and bacterial genomes reveals that many recently acquired genes have originated from integrative elements</p>
Abstract
Background: Archaeal and bacterial genomes contain a number of genes of foreign origin that
arose from recent horizontal gene transfer, but the role of integrative elements (IEs), such as
viruses, plasmids, and transposable elements, in this process has not been extensively quantified.
Moreover, it is not known whether IEs play an important role in the origin of ORFans (open reading
frames without matches in current sequence databases), whose proportion remains stable despite
the growing number of complete sequenced genomes.
Results: We have performed a large-scale survey of potential recently acquired IEs in 119 archaeal
and bacterial genomes. We developed an accurate in silico Markov model-based strategy to identify
clusters of genes that show atypical sequence composition (clusters of atypical genes or CAGs) and
are thus likely to be recently integrated foreign elements, including IEs. Our method identified a
high number of new CAGs. Probabilistic analysis of gene content indicates that 56% of these new
CAGs are likely IEs, whereas only 7% likely originated via horizontal gene transfer from distant
cellular sources. Thirty-four percent of CAGs remain unassigned, what may reflect a still poor
sampling of IEs associated with bacterial and archaeal diversity. Moreover, our study contributes to
the issue of the origin of ORFans, because 39% of these are found inside CAGs, many of which
likely represent recently acquired IEs.
Conclusions: Our results strongly indicate that archaeal and bacterial genomes contain an
impressive proportion of recently acquired foreign genes (including ORFans) coming from a still
largely unexplored reservoir of IEs.
Background
Integrative elements (IEs) such as viruses and plasmids and
their associated hitchhiking elements, transposons, inte-
grons, and so on, mediate the movement of DNA within
genomes and between genomes, and play a key role in the
emergence of infectious diseases, antibiotic resistance,
biotransformation of xenobiotics, and so on [1-3]. Traces of
IE activity have been highlighted in many prokaryotic
genomes, which carry different repertoires of inserted
prophages, plasmids, transposons and/or genomic islands
Published: 16 June 2009
Genome Biology 2009, 10:R65 (doi:10.1186/gb-2009-10-6-r65)
Received: 25 March 2009
Revised: 4 June 2009
Accepted: 16 June 2009
The electronic version of this article is the complete one and can be
found online at /> Genome Biology 2009, Volume 10, Issue 6, Article R65 Cortez et al. R65.2
Genome Biology 2009, 10:R65
[4-7]. These few characterized IEs are most likely only a
reflection of a more diverse and still unknown IE universe
that shapes bacterial and archaeal genomes [8].
The importance of IEs in the origin of ORFans (open reading
frames (ORFs) without matches in current sequence data-
bases) [9] is still controversial. Indeed, the source of ORFans
remains a major mystery of the post-genomic era since, con-
trary to previous expectations, their proportion remains sta-
ble despite the increasing number of complete genome
sequences available [10]. It has been suggested that ORFans
are either misannotated genes, rapidly evolving sequences,
newly formed genes, or genes recently transferred from not
yet sequenced cellular or viral genomes [10,11]. The possibil-
ity that ORFans originate from the integration of elements of
viral origin is appealing since viral genomes themselves
always contain a high proportion of ORFans [12,13]. Consist-
ent with this hypothesis, Daubin and Ochman [14] noticed
that ORFans from γ-Proteobacteria share several features
with viral ORFans (for example, small size, AT-rich) and sug-
gested that 'ORFans in the genomes of free-living microor-
ganisms apparently derive from bacteriophages and
occasionally become established by assuming roles in key cel-
lular functions.' However, Yin and Fisher [10] recently
reported that, on average, only 2.8% of all cellular ORFans
have homologues in current viral sequence databases, raising
doubts about the hypothesis of a viral origin of ORFans, and
proposed that 'lateral transfer from viruses alone is unlikely
to explain the origin of the majority of ORFans in the majority
of prokaryotes and consequently, other, not necessarily exclu-
sive, mechanisms are likely to better explain the origin of the
increasing number of ORFans.' More recently, the same
authors found that only 18% of viral ORFans (ORFs present
in only one viral genome) have homologues in archaeal or
bacterial genomes, and concluded that 'phage ORFans play a
lesser role in horizontal gene transfer to prokaryotes' [12].
Several in silico methods based on composition have been
conceived in the past few years to identify foreign genes that
were recently acquired by cellular genomes, such as atypical
G+C content, atypical codon usage, Markov model (MM)-
based approaches, and Bayesian model (BM)-based
approaches [5,6,15-22]. MM approaches are based on one-
order Markov chains to identify those ORFs that have a com-
position different from genes that are likely native [15],
whereas BM approaches identify those ORFs with under-rep-
resented compositions with respect to the composition of the
whole genome (see [16] for details). Composition-based
methods are based on the idea that foreign DNA fragments
acquired either from distant cellular sources or from IEs can
be identified by the fact that they harbor atypical sequence
signatures with respect to the host genome. Indeed, genomic
signatures differ between distantly related organisms [23]
and it has been shown that viruses and plasmids might keep
a distinct dinucleotide signature with respect to that of their
hosts [24-26]. The accuracy of most of the compositional
methods designed to detect horizontally transferred genes
has not been validated statistically. Here, we have sought to
quantify more precisely the role of IEs in the introduction of
foreign genes in bacterial and archaeal genomes and in the
origin of ORFans. We have developed an accurate and statis-
tically validated MM-based strategy to search 119 archaeal
and bacterial genomes for 'clusters of atypical genes' (CAGs),
since these likely represent recently integrated foreign ele-
ments, including IEs.
Results and discussion
Identification of atypical ORFs
Recently, using in silico horizontal gene transfer (HGT) sim-
ulations in the Escherichia coli K12 genome, we tested the
performances of different composition-based methods: atyp-
ical G+C composition, atypical codon usage, MM approaches,
and BM approaches [15]. Whereas the first two methods dis-
played rather low performance, the MM and BM approaches
were able to detect artificially introduced foreign genes quite
accurately [15]. Here, we have extended the MM approach by
taking advantage of the availability of a large number of
genomes from closely related organisms. The general strategy
is the following (Figure 1): for different groups of closely
related genomes, a dataset of conserved orthologues (hereaf-
ter referred to as 'core genes') is extracted (Figure 1a); this is
used to build for each genome a refined Markov probability
matrix that represents its genomic composition signature
(Figure 1b); then, for a given genome, the MM model analyzes
each ORF by taking into account the Markov probability
matrix of the core genes dataset and the composition of the
ORF under study (Figure 1c); the MM model calculates for
each ORF an index that represents the likelihood of that ORF
to have a composition similar to the core genes dataset (Fig-
ure 1d); for each ORF, one million random sequences are gen-
erated based on the Markov probability matrix of the core
gene dataset, and their Markov indexes are calculated (Figure
1e); finally, ORFs having a Markov index above a defined cut-
off are considered as atypical (Figure 1f).
We selected 19 groups of closely related archaeal and bacte-
rial genomes (for example, same genus or order, 119 genomes
in total) representing a good sampling of prokaryotic diver-
sity. To define 'core genes' datasets, best bi-directional
BLASTP searches were performed with the ORFs of each
genome against those of the other members of the group. All
hits having a bit score higher than 30% of the bit score of the
seed against itself were considered as orthologues [27]. The
core genes datasets are essential for the MM to work properly.
In fact, its ability to detect atypical ORFs depends entirely on
the probability matrix of the model. For instance, if very few
genes are included in the core genes dataset, the matrix will
be small and this will increase the number of detected atypical
genes artificially. On the other hand, a larger probability
matrix (an extreme case being a matrix built with all the genes
of a genome) would reduce dramatically the model's detec-
Genome Biology 2009, Volume 10, Issue 6, Article R65 Cortez et al. R65.3
Genome Biology 2009, 10:R65
tion ability for atypical ORFs. Thus, it is essential to define for
each genome an optimal dataset of core genes to obtain the
best performance of the MM model. For each analyzed
genome, we created 11 datasets of core genes: all the genes in
the genome, orthologues present in 10% of the group's
genomes, orthologues present in 20% of the group's genomes,
and so on, up to orthologues present in 100% of the group's
genomes. Then, for each genome, we built 11 MMs based on
these different core genes datasets (Figure 2a). We tested the
efficiency of our MM approach, the BM approach, and a GC%
approach to detect atypical ORFs by performing in silico HGT
simulations in all 119 archaeal and bacterial genomes (Figure
2b; Materials and methods). We performed two types of HGT
simulations using all 11 different core genes datasets. In the
first simulation we chose 100 ORFs from the other 118
genomes (Figure 2c) and these were introduced in silico in the
genome under analysis. We then determined the number of
simulated HGTs that were detected as atypical (true positives,
expected to be high). In the second simulation, we chose 100
random ORFs from a strict core genes dataset (that is, genes
conserved in all genomes of the group, thus assumed to be
native; Figure 2c) and we determined the average number of
these that were detected as atypical (false positives, expected
to be low; Figure 2d; see Materials and methods). For both
simulations, the results were analyzed by a one-tailed test
with different distribution cut-offs (0.l% to 5%). Then, we
identified the core genes dataset and the cut-off for which the
average detection of simulated HGT (true positives) was the
highest but the average detection of native core genes (false
positives) was the lowest (Figure 2e). These parameters
allowed the definition of an optimal core genes dataset and
cut-off for each genome analyzed (Table S1 in Additional data
file 1), which is thus independent of the evolutionary scale of
each group of genomes analyzed. The HGT simulations were
carried out with the same random ORFs for the three models
(MM, BM and GC% approaches). Although there were no sig-
nificant differences between the MM and BM methods in the
number of false positives, the MM method had a statistically
significantly higher rate of detection of true positives than the
BM and the GC models (Figure 2f-h).
Identification of CAGs
We thus applied the MM method to detect ORFs with atypical
composition in the 19 groups of closely related archaeal and
bacterial genomes, using the optimal genome-specific core
genes datasets and cut-offs. This led to the identification of
58,487 ORFs of atypical composition in the 119 genomes
(Table 1; Table S1 in Additional data file 1). As a control, a
high fraction (85%) of the ORFs that localized within 275
already annotated integrated elements were detected as atyp-
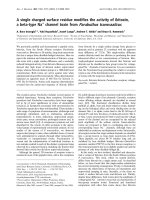
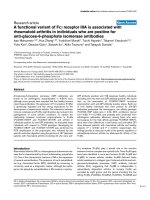
Markov model-based strategyFigure 1
Markov model-based strategy. (a) An optimal core genes dataset is determined, and (b) a Markov probability matrix is built. (c) For a given genome, each
ORF is analyzed using a Markov model that takes into account the Markov probability matrix of the core gene dataset and the composition of the ORF
under study. (d) Fore each ORF the model calculates an index that represents the likelihood of that ORF having a composition similar to the core genes
dataset. (e) One million random sequences are generated based on the Markov probability matrix of the core genes dataset, and their Markov indexes are
calculated. (f) ORFs having a Markov index below a defined threshold of the distribution of random sequence indexes are considered as atypical.
0
1
0
1
0
1
Genome
1
Genome
2
Genome
3
Genome
4
Genome
1
ORF1
ORF2
ORFn
a
Optimal core
genes dataset for
genome 1
Pi1j1 … … … Pi1jn
… … … … …
… … … … …
Pinj1 … … … Pinjn
b
Markov probability matrix
e
Generation of one million
random sequences
Distribution of
Markov indexes from
random sequences
P
i
1
j
1
… … …
P
i
1
j
n
… … … … …
… … … … …
P
i
n
j
1
… … …
P
i
n
j
n
=
=
=
c
ORF’s
Markov index
0.46
0.95
0.24
d
FrequencyFrequency
Frequency
defined cut off
for genome 1
defined cut off
for genome 1
defined cut off
for genome 1
0 MM index 1
0 MM index 1
0 MM index 1
Non-
atypical
Non-
atypical
Atypical
P
i
1
j
1
… … …
P
i
1
j
n
… … … … …
… … … … …
P
i
n
j
1
… … …
P
i
n
j
n
P
i
1
j
1
… … …
P
i
1
j
n
… … … … …
… … … … …
P
i
n
j
1
… … …
P
i
n
j
n
=
=
=
Genome Biology 2009, Volume 10, Issue 6, Article R65 Cortez et al. R65.4
Genome Biology 2009, 10:R65
ical by our method, while only 56% of them were detected as
atypical by the BM approach and 36% by the GC% approach
(data not shown). This confirms that recently integrated for-
eign elements harbor a sequence signature distinct from that
of their hosts that can be detected with appropriate method-
ologies.
We then searched for atypical genes that cluster together,
since these may be recently integrated foreign elements. We
used a sliding window of ten ORFs that moved along the
genome sequence [16,18], and every time seven or more ORFs
in that window showed an atypical composition we defined a
cluster (that may thus also include non-atypical genes). This
threshold of seven genes was based on the distribution of
atypical versus non-atypical genes observed in annotated IEs.
We applied this protocol to each of the 119 genomes and iden-
tified a total of 2,377 CAGs (Table 1; Table S1 in Additional
data file 1). The CAGs include as high as 13% of all ORFs ana-
lyzed (Table 1; Table S1 in Additional data file 1), indicating
that the integration of foreign elements into archaeal and bac-
terial genomes is very frequent. We verified whether our
method has a tendency to identify clusters of small atypical
ORFs; however, ORFs included in CAGs have statistically the
same size distribution as core genes (Figure S1 in Additional
data file 2).
The number of CAGs varied greatly among and within groups
of genomes (Figure 3a), being, on average, between 10 and
30, with a minimal number for Rickettsia and Chlamydia
(that is, zero in Rickettsia typhi, Rickettsia prowazekii,
Chlamydia abortus and Chlamydia felis) (Table S1 in Addi-
tional data file 1). The size of CAGs (expressed as the number
of ORFs included) varied from seven (by definition) to several
hundreds (up to a 152 ORF CAG in the γ-proteobacterium Sal-
monella typhi ty2; Figure 3b). Interestingly, archaeal
genomes harbor, on average, half as many CAGs as Bacteria
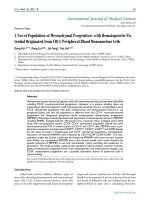
HGT simulationsFigure 2
HGT simulations. (a) Eleven core gene datasets for each analyzed genome were determined and, for each genome, 11 Markov models were built based on
these different gene datasets. (b) The efficiency of our MM approach, the BM approach, and a GC% approach to detect foreign ORFs was tested by
performing in silico HGT simulations using a variety of core gene datasets. (c) For the HTG simulations, 100 genes were chosen from the other 118
genomes and 100 random core ORFs were in silico introduced in the genome under analysis. (d) The average number of these ORFs that were detected
as atypical (false positives, expected to be low) was determined. (e) After 100 simulations we searched for the core genes dataset and the cut-off where
the average detection of simulated HGT was the highest but the average detection of native core genes was the lowest. (f-h) Average result after 100
HGT simulations for the 119 analyzed genomes using the MM, BM and GC% methods with species-specific core gene datasets and cut-offs. Blue dots
represent the average number of true positives detected. Green dots represent the average number of false positives detected. The MM method had a
significantly higher rate of detection of true positives than the BM method (Wilcoxon test W = 11,849, P-value < 2.2 e-16, means = 86.8 and 74.8 for the
MM and BM methods, respectively; and Wilcoxon-test W = 13,824, P-value < 2.2 e-16, means = 86.8 and 52.6 for MM and GC%, methods, respectively).
No significant differences were found between the MM and BM methods in the detection of false positives (Wilcoxon-test W = 8,359, P-value = 0.0311,
means = 12.4 and 11.0 for the MM and BM methods, respectively).
0
1
Genome
1
Genome
2
Genome
3
Genome
4
Genome
1
Markov model
Bayesian model
GC% model
Frequency
Cut-offs: from
0.1% to 5%
a
b
c
11 core gene datasets
d
1
MM index of
native gene xi
MM index of
foreign gene yi
0
Random genes from
118 genomes
and random core genes
100 simulations
Selection of
species-specific
core gene dataset
and cut-off
Bacteria
Bacteria
Bacteria
0
20
40
60
80
100
0
20
40
60
80
100
0
20
40
60
80
100
Archaea
Archaea
Archaea
Average number of genes detected as atypical
0
100
0
100
Average number of genes detected as atypical
0
100
Average number of genes detected as atypical
f
Markov model test results
Bayesian model test results
GC% model test results
g
h
e
Genome Biology 2009, Volume 10, Issue 6, Article R65 Cortez et al. R65.5
Genome Biology 2009, 10:R65
(Additional data file 1), suggesting that Archaea are somehow
less prone than Bacteria to the integration of foreign ele-
ments. Nevertheless, some archaeal genomes exhibit a high
number of CAGs, such as Haloquadratum walsbyi (32 CAGs)
and Sulfolobus solfataricus (28 CAGs). In these two cases,
the great majority of CAGs are concentrated within specific
regions of the chromosome, near potential replication termi-
nation areas, at 150° from OriC in H. walsbyi and between the
second and the third origin of replication in S. solfataricus
(two regions in H. walsbyi and one in S. solfataricus; Addi-
tional data file 3). Moreover, small clusters of native genes
(from 5 to 30 ORFs) separate these CAGs, suggesting that
chromosomal rearrangements may have fragmented a larger
integrated original element (Additional data file 3). Some
bacterial groups also exhibited a very high number of CAGs.
Mycobacterium, Lactobacillus, Bacillus and enterobacteria
genomes are good examples, because they all contain between
30 and 100 CAGs (Additional data file 1).
As mentioned for H. walsby, we noticed an enrichment of
CAGs in particular chromosomal regions, which are sepa-
rated by small clusters of native genes (Additional data file 3).
Furthermore, the frequency of CAGs in archaeal and bacterial
genomes is inversely proportional to their size, indicating that
larger CAGs are less frequent than smaller ones (Figure 3a).
This suggests again that CAGs are quickly fragmented and/or
eroded following integration. Moreover, CAGs are enriched in
pseudogenes, since they include 32% of all pseudogenes (of
those annotated in bacterial genomes together with those
recently identified in a large number of archaeal genomes
[28]) (data not shown).
Origin of CAGs
The number of CAGs corresponding to already annotated IEs
is larger in well-annotated genomes such as those from
enterobacteria and Streptococcus (Figure 3a, red), while for
the majority of other genomes the number of newly identified
CAGs is high (Figure 3a, blue).
tRNA and tmRNA genes are well known integration points for
IEs [29,30]. In archaeal and bacterial genomes, around 40%
of already annotated IEs are found next to tRNA and tmRNA
genes (Additional data file 3). Moreover, a significant propor-
tion of all newly identified CAGs (33.27%) also lies next to a
tRNA or tmRNA gene (Table S1 in Additional data file 1),
strongly indicating that many of these may be recently
acquired IEs. In some groups, the number of newly identified
CAGs representing potential recently acquired IEs appears
particularly important. For instance, in enterobacteria,
Streptococcus, Prochlorococcus and Thermoplasmatales,
between 40% and 50% of their CAGs lie next to tRNA genes.
On the contrary, all groups of closely related Firmicutes
Table 1
General information of analyzed genomes, newly identified CAGs and ORFans
Analyzed genomes
Number of genomes 119
Number of ORFs 351,111
Number of atypical ORFs 58,487 (16% of all genes)
Number of CAGs 2,377
Number of ORFs in CAGs 47,441 (13% of all genes)
Newly identified CAGs
Number of CAGs 2,104
CAGs of likely plasmid origin 674 (32%)
CAGs of likely virus origin 164 (8%)
CAGs of likely viruse and plasmid origin 341 (16%)
CAGs likely from cellular sources 145 (7%)
CAGs unclassified 780 (37%)
ORFans
Number of ORFans 8,987
Number of ORFans in CAGs 3,475 (39%)
ORFans in annotated proviruses and CAGs of likely virus origin 875 (25.1% of all ORFans inside CAGs)
Number of ORFans in CAGs of likely plasmid origin 680 (19.5% of all ORFans inside CAGs)
Number of ORFans in CAGs of likely virus and plasmid origin 224 (6.4% of all ORFans inside CAGs)
Number of ORFans in CAGs likely from cellular sources 54 (1.5% of all ORFans inside CAGs)
Number of ORFans in unclassified CAGs 1,642 (47.5% of all ORFans inside CAGs)
Genome Biology 2009, Volume 10, Issue 6, Article R65 Cortez et al. R65.6
Genome Biology 2009, 10:R65
genomes show a lower number of newly identified CAGs lying
next to tRNA genes (less than 5%; Additional data file 1).
Interestingly, in the genomes from Firmicutes, tRNA genes
are grouped in a reduced number of large clusters (Additional
data file 3), suggesting that such clustering may somehow
make the integration of IEs more difficult. Lactobacillus
genomes are an exception within Firmicutes, because CAGs
often lie next to a tRNA gene (which are also less clustered;
Additional data file 3) - for example, in Lactobacillus gasseri
15 of 16 CAGs are found next to tRNA genes (Additional data
file 1).
In summary, around 30% of newly identified CAGs lie next to
tRNA genes and are thus likely to have been derived from IEs.
However, the remaining CAGs may also be IEs because not all
IEs integrate next to a tRNA or a tmRNA gene, or because
they may have been displaced or fragmented following
genomic rearrangements. We thus sought to obtain more
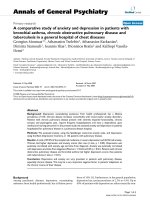
Number of identified CAGs, CAG size distribution and proportion of already annotated IEsFigure 3
Number of identified CAGs, CAG size distribution and proportion of already annotated IEs. (a) Average number and standard deviations of CAGs in the
different analyzed groups of Archaea and Bacteria. In red are represented, for each group, the average numbers of annotated IEs. (b) CAGs size
distribution.
Number of CAGs
0
50
100
150
200
250
300
350
400
0 20 40 60 80 100 120 140 160
Size of CAGs
Mean = 14 ORFs
CAG in S. typhi ty2 CAG #30
(152 ORFs)
(b)
Bacteria
Archaea
(a)
Average number of CAGs
0 10203040506070
Enterobacteria
Helicobacter
Rickettsia
Staphylococcus
Bacillus
Streptococcus
Lactobacillus
Mycobacterium
Chlamydiales
Leptospira
Synechococcus
Prochlorococcus
Pyrobaculum
Sulfolobales
Methanosarcinales
Halobacteriales
Methanococcales
Thermoplasmatales
Thermococcales
0 10 20 30 40 50 60 70
Genome Biology 2009, Volume 10, Issue 6, Article R65 Cortez et al. R65.7
Genome Biology 2009, 10:R65
information on the source of our newly identified CAGs by
analyzing their gene content. For this, we developed a proba-
bilistic approach that would help us determine if a given CAG
is of IE origin by looking at its gene content. This approach is
based on the calculation of the probability to have a certain
number of homologues in a database of known IE sequences.
Briefly, it calculates, using Monte Carlo simulations, the most
probable source at 95% confidence intervals. Nevertheless,
for this approach to work, IE sequences must represent a sep-
arate gene pool from cellular sequences. Therefore, we first
compared a local database containing all ORFs from anno-
tated IEs (annotated IE database) with a local database con-
taining all our species-specific core genes from all genomes
analyzed (core database), with the complete viral genome
database available at NCBI (as for January 2009; viral data-
base) (Figure 4a, b), and with the complete plasmid genome
database at NCBI (as for January 2009; plasmid database)
(see Materials and methods). As expected, annotated IEs
share a large number of homologues with the NCBI viral data-
base (36.9%; Figure 4) and with other annotated IEs (55.2%;
Figure 4), generally from closely related genomes (data not
shown), indicating the existence of evolutionarily related IEs.
Interestingly, the annotated IE database has in common only
a minor fraction of homologues with the core database (3.2%;
Figure 4) and with the plasmid database (6.9%; Figure 4).
Consistently, core genes share a rather low number of homo-
logues with the viral database (1.2%; Figure 4) and with the
plasmid database (11.1%; Figure 4). These results clearly indi-
cate that the pools of viral genes and plasmid genes are sepa-
rated from the pool of core genes.
Given this clear distinction, we could apply our probabilistic
approach to distinguish the newly identified CAGs that are
related to known viruses and plasmids (see Materials and
methods). Since annotated IEs are clearly related to viruses,
we incorporated them into the viral database. We calculated
95% confidence intervals able to assign a CAG as related to
viral or plasmid sources. To do so, we artificially constructed
1,000 clusters containing different numbers of ORFs (7 > n <
152) and analyzed the presence of homologues in the viral and
plasmid databases. Next, for each n we built a distribution of
probabilities and defined 95% confidence intervals. CAGs
were then assigned a given origin (viral or plasmid) if the
number of homologues was above the 95% confidence inter-
val corresponding to their size (see Materials and methods for
details). As expected, 95% of annotated IEs were correctly
assigned as of viral origin (data not shown). For the newly
identified CAGs, 21% were assigned as of plasmid origin (Fig-
ure 5a, green), 8% as of viral origin (Figure 5a, red) and 4% as
of plasmid/viral origin (CAGs with equal probabilities of
being of plasmid and viral origin; Figure 5a, yellow). Never-
theless, the origin of an important proportion of newly iden-
tified CAGs (67%) could not be assigned to either viral or
plasmid sources by this approach. This may be due to the fact
that these CAGs are related to viral or plasmid sources that
are not yet sequenced and thus not included in the viral and
plasmid databases. In order to reduce this bias, we added to
their corresponding databases the ORFs from all newly iden-
tified CAGs that were assigned to viral or plasmid origin, and
we performed a second round of analysis. All CAGs assigned
to viral or plasmid origins were then added to their corre-
sponding databases, and the analysis was repeated. At the
fifth iteration, no more CAGs could be assigned. After this
new analysis, aimed at correcting a bias in the original data-
bases, the percentage of newly identified CAGs assigned to
plasmid origin was raised to an average of 32% (Figure 5b,
green; Table 1), while the percentage of CAGs assigned to viral
origin remained almost unchanged (8% on average; Figure
5b, red and blue; Table 1). Interestingly, the number of CAGs
of plasmid/viral origin increased to an average of 16% (Figure
5b, yellow; Table 1; see, for example, enterobacteria and Sul-
folobales). These results indicate that the majority of new
CAGs correspond to large IE families of both plasmid and
viral origin.
After this database correction, not only just a few specific
groups, but many archaeal and bacterial genome groups were
shown to harbor high proportions of newly identified CAGs
assigned to either plasmid, viral, or plasmid/viral origins
(Figure 5b, grey arrows). For instance, we were able to deter-
mine that H. walsbyi harbors a large fragmented plasmid in
a particular genomic region (Additional data file 3) since the
majority of CAGs in this region are statistically related to plas-
mids (Additional data file 3). S. solfataricus also contains a
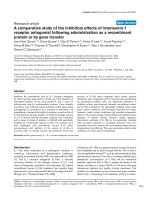
Proportion of homologues from annotated IEs, newly identified CAGs, and core genes in various databasesFigure 4
Proportion of homologues from annotated IEs, newly identified CAGs, and
core genes in various databases. Proportion of homologues of ORFs from
annotated IEs in the core genes database, the viral database, the plasmid
database and the annotated IE database, as well as the proportion of
homologues of core genes in the viral database and the plasmid database.
55.2%
6.9%
3.2%
36.9%
1.2%
11.1%
Annotated IE
database
Plasmid
database
Viral
database
Core
database
Genome Biology 2009, Volume 10, Issue 6, Article R65 Cortez et al. R65.8
Genome Biology 2009, 10:R65
CAGs of likely IE origin based on probabilistic analysisFigure 5
CAGs of likely IE origin based on probabilistic analysis. (a) Proportion of newly identified CAGs of plasmid origin (green) for each analyzed group;
proportion of identified CAGs of viral origin (red); proportion of newly identified CAGs of viral/plasmid origin (yellow); proportion of newly identified
CAGs of cellular origin (blue); proportion of newly identified CAGs that are unassigned (violet). (b) Same as in (a) but after database correction. Each
group's average number of CAGs is indicated in parentheses. Grey arrows indicate the groups with the highest proportions of newly identified CAGs
classified as IEs.
0% 10% 20% 30% 40% 50% 60% 70% 80% 90% 100%
0% 10% 20% 30% 40% 50% 60% 70% 80% 90% 100%
Bacteria
ArchaeaBacteria
Archaea
Enterobacteria (32)
Helicobacter (7.2)
Rickettsia (5)
Staphylococcus (9.5)
Bacillus (52)
Streptococcus (7.1)
Lactobacillus (25.4)
Mycobacterium (38)
Chlamydiales (3)
Leptospira (30.3)
Synechococcus (20.2)
Prochlorococcus (9.2)
Pyrobaculum (10.5)
Sulfolobales (16)
Methanosarcinales (10.6)
Halobacteriales (18)
Methanococcales (5.7)
Thermoplasmatales (4)
Thermococcales (8.2)
Prior to database correction
After database correction
0 10 20 30 40 50 60 70 80 90 100
0 10 20 30 40 50 60 70 80 90 100
Average number of CAGs (%)
Average number of CAGs (%)
(a)
(b)
Genome Biology 2009, Volume 10, Issue 6, Article R65 Cortez et al. R65.9
Genome Biology 2009, 10:R65
large fragmented element, which is equally related to viruses
and plasmids (Additional data file 3). In fact, many other
CAGs in the genomes of Sulfolobales are also related to both
viral and plasmid sequences (Figure 5b; Additional data file
3). A similar case is observed in the genomes of enterobacte-
ria (Figure 5b; Additional data file 3).
It is interesting to note that the major source of recently
acquired IEs can change from group to group. For instance, in
all genomes of Firmicutes and Halobacteriales, the great
majority of CAGs are related to plasmids, whereas in
Procholococcus, Streptococcus and Methanococcales, they
are rather related to viruses (Figure 5b; Additional data file
3). The analyses of Leptospira interrogans and Mycobacte-
rium leprae genomes nicely reflect the different histories that
can lead to a high number of CAGs in a given genome. L.
interrogans harbors 80 CAGs including more than 1,400
genes (Additional data file 1). On the contrary, M. leprae har-
bors 58 CAGs including 1,500 genes, but over 40% of its ORFs
are annotated as pseudogenes. Here, CAGs do not represent
IEs being erased but rather reflect the important genomic
reduction that is ongoing in this species (Figure 5b; Addi-
tional data files 1 and 3). To summarize, 56% are likely
recently acquired IEs.
To test the origin of the remaining CAGs, we repeated the
same probabilistic analysis against the cellular database. Only
4% (7% after database correction) could be assigned as being
of cellular origin, meaning that these may be either elements
recently acquired by HGT from cellular sources, or else clus-
ters of atypical native genes (Figure 5b; Additional data files 1
and 3).
The origin of the remaining 37% of newly identified CAGs
remained unassigned even after database correction (Figure
5b, violet; Table 1). Given the current under-representation of
viral/plasmid diversity in public sequence databases rather
than cellular diversity, these elements are probably members
of new families of IEs that have no sufficient viral/plasmid
relatives in current sequence databases to be unambiguously
assigned based on our probabilistic approach. Importantly,
only 5.96% of newly identified CAGs have homologues (<e
-5
)
in four local viral metagenomic databases (see Material and
methods), but these databases may be also be biased towards
particular viral lineages.
ORFan distribution in CAGs
We identified 8,428 ORFans in the 119 complete genomes
(defined as ORFs presenting no Blast hits against the nr data-
base at the NCBI below an e-value of 0.001 [9]; see Materials
and methods; Table 1; Table S1 in Additional data file 1).
These ORFans are thus likely to be genes of very recent origin.
Nearly all of them (96%) have atypical sequence composition
and they are, on average, statistically smaller than non-
ORFans (Figure S2 in Additional data file 2). Interestingly,
this is also valid for ORFans from complete sequenced viral
genomes (Figure S2 in Additional data file 2).
We analyzed the distribution of these ORFans. We observe
that 39% of all ORFans lie inside CAGs (Table 1), and a χ
2
sta-
tistical test shows that this is more frequent than would be
expected by chance only (Figure S3 in Additional data file 2).
Importantly, genomes with a high number of ORFans (more
than 200; Additional data file 1), such as those of L. interro-
gans, Methanosarcina acetivorans, H. walsbyi, and Lacto-
bacillus casei, have around 50% of their ORFans inside CAGs.
Moreover, not only small ORFans, but also ORFans with
more than 100, 150 and 200 amino acids (thus likely to be
genuine coding genes rather than misannotated genes), are
overrepresented in CAGs (37.8%, 37.3% and 37.4%, respec-
tively; data not shown). Interestingly, even if CAGs inferred to
be of plasmid origin are more numerous, ORFans are more
abundant in CAGs inferred to be of viral origin (25.1%; Figure
6a, red) than in CAGs inferred to be of plasmid origin (19.5%;
Figure 6a, green). Moreover, 6.4% of ORFans lie in CAGs
inferred to be of plasmid/viral origin (Figure 6a, yellow), and
only 1.5% of ORFans lie inside CAGs inferred to be of cellular
origin (Figure 6a, blue). However, a significant proportion of
ORFan distributionFigure 6
ORFan distribution. (a) Distribution of ORFans in CAGs: ORFans in
CAGs of viral origin (red); ORFans in CAGs of plasmid origin (green);
ORFans in CAGs of viral/plasmid origin (yellow); ORFans in CAGs of
cellular origin (blue); and ORFans in unassigned CAGs (violet). (b)
Proportion of ORFans inside CAGs of different sizes. Data were
normalized according to the number of CAGs in each category.
(a)
(b)
0
10
20
30
40
50
[min-10[ [10-20[ [20-30[ [30-40[ [40-50[ [50-max]
Viral origin
25.1%
Normalized proportion of
ORFans inside CAGs
CAG sizes (in number of ORFs)
Plasmid origin
19.5%
Viral/Plasmid origin
6.4%
Cellular origin
1.5%
Unassigned
47.5%
Genome Biology 2009, Volume 10, Issue 6, Article R65 Cortez et al. R65.10
Genome Biology 2009, 10:R65
ORFans (47.5%) lie inside unclassified CAGs (Figure 6a, vio-
let).
Finally, large CAGs (that is, containing 40 or more ORFs)
harbor proportionally more ORFans than smaller CAGs (Fig-
ure 6b). Since larger CAGs may be more recent than smaller
ones (these likely deriving from disruption of larger CAGs),
this suggests that recently acquired CAGs contain proportion-
ally more ORFans, and that these are rapidly removed from
cellular genomes. The remaining 61% of ORFans do not lie in
any CAG. However, if we relax the criterion for CAG defini-
tion (from four up to six atypical genes), nearly a third of them
lie in small CAGs, which may represent the remnants of older
IEs (data not shown).
Conclusions
It is widely assumed that most cellular genomes harbor IEs,
but their proportion has not been quantified on a large scale.
With this study, we show that the use of a MM-based method
to identify ORFs with atypical composition in groups of
closely related genomes, coupled to the identification of
CAGs, their genomic context and gene content, is a powerful
approach to identify foreign elements that have recently inte-
grated into archaeal and bacterial genomes. This strategy
allowed us to recognize all previously annotated IEs and to
detect new CAGs that are likely of viral or plasmid origin in a
large number of archaeal and bacterial genomes.
The MM approach that we have developed could have many
useful applications. In particular, it may help automatic
genome annotation (detection of IEs in newly sequenced
genomes) and will allow an exhaustive description of all IE
families in sequenced archaeal and bacterial genomes. Our
MM method could also be very useful to determine if an ORF
of interest belongs to an IE. For instance, we have recently
used it to show that a conserved ORF (AFV3) from viruses
infecting Crenarchaeota has a unique homologue outside this
viral group that lies inside a CAG corresponding to a conjuga-
tive transposon in the genome of Bacillus subtilis [31,32].
Interestingly, this transposon is related to a large family of
CAGs that includes many of our newly identified CAGs, as
well as annotated prophages, 'free-living' phages and plas-
mids from Firmicutes [31]. This result highlights unsuspected
and still largely unknown links between the archaeal and bac-
terial IE worlds.
Our results are also different from those recently reported by
Hsiao and colleagues [6], who used a method based on atypi-
cal dinucleotide composition to identify genomic islands in 63
prokaryotic genomes. However, in contrast to our MM strat-
egy, they failed to identify more than half of already anno-
tated IEs. This significant difference between the two
methodologies underscores the importance of performing
HGT simulations to test statistically a method's accuracy
prior to its application.
Importantly, we found that several bacterial and archaeal
genomes contain an impressive number of CAGs, whereas
others contain only a few. These results are not correlated
with gene number nor with the evolutionary proximity of the
genomes in a given group. Different bacteria and archaea are
thus differently prone to acquire IEs. This may be linked to
different adaptation strategies under high selection pressures
[33] and might be related to a general mechanism for niche
differentiation in microbial species [34] by increasing the
genetic variability via the acquisition of foreign genetic mate-
rial.
Among our newly identified CAGs, a large number are
inferred to be of plasmid origin. This indicates that plasmid
integration is highly frequent, which is at odds with previous
reports. For example, Nakamura and colleagues [16] con-
cluded that most of the atypical ORFs that they identified are
from distant cellular sources since only 30% of these have
homologues in viral or plasmid sequence databases. We
showed that these databases are, in fact, biased towards
viruses and plasmids from particularly well-characterized
organisms. When this bias was corrected, a larger number of
CAGs could, in fact, be assigned to plasmid/viral origin.
Future increases in the number of available new viral, plas-
mid and cellular sequences will allow the large number of
CAGs that remained unclassified in our analysis to be classi-
fied and may also be of viral or plasmid origin.
Importantly, our results contribute to the issue of the origin
of ORFans in archaeal and bacterial genomes. In fact, a large
percentage of ORFans were found to lie in CAGs, half of which
are new CAGs of likely viral or plasmid origin. The number of
ORFans included in CAGs increased to up to 60% if we also
considered smaller CAGs (two to six genes) that might be
remnants of older/fragmented IEs.
The IE origin of most recent ORFans is consistent with the
recurrent observation that viral and plasmid genomes always
contain a higher proportion of ORFans than cellular genomes
[13]. Our data are in agreement with those reported by
Daubin and Ochman for γ-Proteobacteria [14] and indicate
that the IE origin of ORFans is a phenomenon that shapes
equally the genomes of both archaea and bacteria. Conse-
quently, the reported low number of ORFans with homo-
logues in viral databases [10], or else the reported low
number of viral ORFans with homologues in bacterial or
archaeal genomes [12], is very likely due to a large under-rep-
resentation of viral and plasmid diversity in current sequence
databases.
Our analysis strongly suggests that the variable component of
a particular genome with respect to its closely related kin
(that is, ORFans) has its origin in a still largely unsequenced
(hidden) reservoir of IE sequences. Consistently, direct
microscopic observations and metagenomic data indicate
that viruses are the most abundant entities and the greatest
Genome Biology 2009, Volume 10, Issue 6, Article R65 Cortez et al. R65.11
Genome Biology 2009, 10:R65
source of gene diversity on Earth [8,35,36]. The hidden IE
reservoir hypothesis also explains why the proportion of
ORFans remains stable despite the growing number of new
genome sequences. We predict that this proportion will start
decreasing only with a more exhaustive sequencing of all IEs
associated with a particular bacterial or archaeal species. The
study of the expression profiles, functions and structures of
these ORFans should become one of the priorities of post-
genomics studies.
Materials and methods
Analyzed genomes
The following groups of closely related genomes were ana-
lyzed. Group I, Archaea: Thermococcales, four genomes;
Methanosarcinales, three genomes; Halobacteriales, four
genomes; Thermoplasmatales, three genomes; Sulfolobales,
three genomes; Methanococcus, seven genomes; Pyrobacu-
lum, four genomes. Group II, Bacteria: γ-Proteobacteria
(Escherichia, Salmonella and Yersinia), 13 genomes; ε-Pro-
teobacteria (Helicobacter), four genomes; α-Proteobacteria
(Rickettsia), five genomes; Firmicutes (Bacillus, 11 genomes;
Staphylococcus, 12 genomes; Streptococcus, 6 genomes;
Lactobacillus, 10 genomes); Actinobacteria, (Mycobacte-
rium), ten genomes; Chlamydia, 7 genomes; Spirochaetes
(Leptospira), three genomes; Cyanobacteria (Synechococ-
cus, five genomes; Prochlorococcus, five genomes). The com-
plete list of species is given in Table S1 in Additional data file
1. All genomes were obtained from the NCBI database [37].
Models
Eleven first-order Markov-based models were constructed for
each genome for each different core genes dataset. The mod-
els take into account the Markov probability matrix of the dif-
ferent core genes datasets and the composition of the ORF
under study. The model is based on the mathematic formulas
described in [38], and summarized below:
where S(m) is the Markov index for the m sequence, h is
sequence length of the gene m, P(xy) set ORFi are the dinu-
cleotide probabilities found in the ORF i under study, and
P(xy)set coregeneX% are the dinucleotide probabilities cal-
culated from the core genes dataset calculated from gene
sequences from the organisms under study having ortho-
logues in at least X% of the group's genomes.
The model calculates for each ORF an index that represents
the likelihood of that ORF to have a similar composition to
the core genes dataset (that is, a Markov index close to one for
a given ORF means that its composition is similar to that of
the core genes dataset). In order to assess significance cut-
offs for Markov indexes, we applied the following statistics
(based on the method described in [16]) and Monte Carlo
simulations; for every ORF of a particular group analyzed,
one million random sequences were generated based on the
Markov model probability matrix of the core genes dataset,
and the Markov index of each of these random sequences was
calculated. Then, the results were analyzed by a one-tailed
test with different distribution cut-offs (0.l% to 5%). An ORF
having a Markov index above a specific cut-off was then con-
sidered as atypical. The Bayesian model was built as detailed
in Nakamura et al. [16] but with our different core genes data-
sets and our Monte Carlo simulations to define statistical
thresholds. The GC% model looks for the differences between
a give ORF and a dataset of core sequences by looking at the
GC% variability in the third codon base. The model was
applied using the different core genes datasets and our Monte
Carlo simulations to define statistical thresholds. Genes that
are atypical per se (approximately 10% of all core genes ana-
lyzed), such as genes coding for ribosomal proteins or genes
smaller than 150 nucleotides, were excluded from further
analysis.
Horizontal gene transfer simulations
The MM, BM and GC% approaches were evaluated using in
silico HGT simulations in order to test their performances
under different genomic backgrounds. The 119 genomes were
analyzed and 100 simulations were performed using the core
genes datasets and a variety of cut-offs (0.1% to 5%). Higher
Markov orders were also tested, but these showed lower spe-
cificity (that is, higher numbers of false positives; data not
shown), probably because with our Markov chain approach
the increase in the Markov order reduces considerably the
quantity of information that can be obtained from the gene
sequence, especially for small genes. To evaluate the average
performances of the models, we applied a Wilcoxon-test.
Homology searches
All ORFs contained in annotated IEs (10,651 ORFs) and
newly identified CAGs (36,790) were searched by BLASTP
[39] against: a local database of all annotated IEs in the 119
genomes; complete plasmid sequences available at the NCBI;
complete viral genomes at the NCBI; a local database of core
genes in the 119 genomes (from the selected core genes data-
set after the HGT simulations; 194,554 genes); and ORFs in
newly identified CAGs. Bit-score is useful when comparing
BLAST results obtained from different databases searches
because it remains constant, unlike the e-value, which
changes depending on the size of the database. We therefore
defined the homology cut-off between two sequences when
the bit-score of the BLAST hit was above 30% of the bit-score
of the query protein against itself (maximum bit-score value)
[27]. We also performed BLASTP searches against four
metagenomic databases available at the SDSU Center for Uni-
versal Microbial Sequencing: 'The marine viromes of four
oceanic regions' [35].
Sm
h
Pxy setORF
i
Pxy setcoregeneX
i
h
()
log ( )
log ( ) %
=
⎡
⎣
⎤
⎦
⎡
⎣
⎤
⎦
=
−
1
1
11
∑
Genome Biology 2009, Volume 10, Issue 6, Article R65 Cortez et al. R65.12
Genome Biology 2009, 10:R65
Gene content probabilistic analysis
One-thousand clusters of size n, where n goes from 7 ORFs
(smaller CAG by definition) up to 152 ORFs (larger CAG
found) were artificially built using ORFs from the 119 ana-
lyzed genomes. We then counted, for all clusters of n size, the
number of homologues they have in the viral genome data-
base, the plasmid genome database and the core genes data-
base. ORFs were allowed to have only one homologue in each
database in order to reduce any possible biases due to the
presence of closely related sequences in the database that
would falsely increase the number of homologues for a given
ORF. Based on these data, we built three distributions of
probabilities (one for each of the above-mentioned data-
bases), and from these distributions we were able to calculate
a 95% confidence interval. We could then determine which
CAGs are of viral or plasmid or cellular origin by counting the
number of homologues their ORFs show in the viral genome
database and the plasmid database and the core genes data-
base. For instance, a CAG of size 'x' that has 'y' homologues in
the plasmid database could be considered of plasmid origin
when 'y' was above the 95% confidence interval calculated
from the distribution of homologues in the plasmid database
of the 1,000 random clusters of size 'x'.
Detection of ORFans
All ORFs in the 119 analyzed genomes were searched by
BLASTP against the nr database at the NCBI (as of January
2009) [37]. When no hits were found below an e-value of
0.001, ORFs were considered as ORFans [9]. We corrected
the list of ORFans by eliminating potential misannotated
ORFs. In fact, 1,859 potential ORFans were found in more
than one genome by using a BLASTN search (cut-off was fixed
at 50% of bit score of the query sequence against itself). For
each genome, we calculated the expected number of ORFans
inside CAGs given the total number of ORFs in the genome,
the total number of ORFs in CAGs, and the total number of
ORFans. Because the data had a normal distribution, a χ
2
test
was performed to determine if the number of ORFans inside
CAGs was higher than expected by chance only. To analyze if
CAGs are enriched in genes of small size and because data had
a normal distribution, a one-way ANOVA test followed by a
TukeyHSD statistical test were performed between all the
groups of CAGs and 1,000 randomly chosen core genes.
Statistics
All statistical tests were performed with the R package [40].
All other analyses were performed using in-house developed
Perl scripts.
Abbreviations
BM: Bayesian model; CAG: cluster of genes with atypical
composition; HGT: horizontal gene transfer; IE: integrative
element; MM: Markov model; ORF: open reading frame.
Authors' contributions
DC carried out all analyses and simulations. DC, SG and PF
conceived the study, interpreted the results and wrote the
paper. All authors read and approved the final manuscript.
Additional data files
The following additional data are available with the online
version of this paper: Table S1, listing all detailed information
on CAGs for the 122 analyzed genomes (Additional data file
1); supplementary Figures S1, S2 and S3 (Additional data file
2); detailed results from the 119 analyzed genomes (Addi-
tional data file 3).
Additional data file 1Detailed information on CAGs for the 122 analyzed genomesDetailed information on CAGs for the 122 analyzed genomes.Click here for fileAdditional data file 2Figures S1, S2 and S3Figure S1 shows the statistical results of the sizes of CAGs' ORFs with respect to the size of core genes. Figure S2 shows the statistics of ORF and ORFan sizes. Figure S3 shows the results of a χ
2
test on the frequencies of ORFans inside and outside CAGs.Click here for fileAdditional data file 3Detailed results from the 119 analyzed genomesDetailed results from the 119 analyzed genomes.Click here for file
Acknowledgements
We thank Samuel Karlin, David Prangishvili, Peter Redder, Alexis
Criscuolo, and Elie Desmond for helpful suggestions and comments. We
acknowledge the support of CONACYT to DC.
References
1. Gogarten JP, Townsend JP: Horizontal gene transfer, genome
innovation and evolution. Nat Rev Microbiol 2005, 3:679-687.
2. Canchaya C, Fournous G, Chibani-Chennoufi S, Dillmann ML, Brus-
sow H: Phage as agents of lateral gene transfer. Curr Opin
Microbiol 2003, 6:417-424.
3. Frost LS, Leplae R, Summers AO, Toussaint A: Mobile genetic ele-
ments: the agents of open source evolution. Nat Rev Microbiol
2005, 3:722-732.
4. Canchaya C, Fournous G, Brussow H: The impact of prophages
on bacterial chromosomes. Mol Microbiol 2004, 53:9-18.
5. Karlin S: Detecting anomalous gene clusters and pathogenic-
ity islands in diverse bacterial genomes. Trends Microbiol 2001,
9:335-343.
6. Hsiao WW, Ung K, Aeschliman D, Bryan J, Finlay BB, Brinkman FS:
Evidence of a large novel gene pool associated with prokary-
otic genomic islands. PLoS Genet 2005, 1:e62.
7. Mantri Y, Williams KP: Islander: a database of integrative
islands in prokaryotic genomes, the associated integrases
and their DNA site specificities. Nucleic Acids Res 2004,
32:D55-58.
8. Hambly E, Suttle CA: The viriosphere, diversity, and genetic
exchange within phage communities. Curr Opin Microbiol 2005,
8:444-450.
9. Siew N, Azaria Y, Fischer D: The ORFanage: an ORFan data-
base. Nucleic Acids Res 2004, 32:D281-283.
10. Yin Y, Fischer D: On the origin of microbial ORFans: quantify-
ing the strength of the evidence for viral lateral transfer.
BMC Evol Biol 2006, 6:63.
11. Siew N, Fischer D: Analysis of singleton ORFans in fully
sequenced microbial genomes. Proteins 2003, 53:241-251.
12. Yin Y, Fischer D: Identification and investigation of ORFans in
the viral world.
BMC Genomics 2008, 9:24.
13. Prangishvili D, Garrett RA, Koonin EV: Evolutionary genomics of
archaeal viruses: unique viral genomes in the third domain of
life. Virus Res 2006, 117:52-67.
14. Daubin V, Ochman H: Bacterial genomes as new gene homes:
the genealogy of ORFans in E. coli. Genome Res 2004,
14:1036-1042.
15. Cortez DQ, Lazcano A, Becerra A: Comparative analysis of
methodologies for the detection of horizontally transferred
genes: a reassessment of first-order Markov models. In Silico
Biol 2005, 5:581-592.
16. Nakamura Y, Itoh T, Matsuda H, Gojobori T: Biased biological
functions of horizontally transferred genes in prokaryotic
genomes. Nat Genet 2004, 36:760-766.
17. Ochman H, Lawrence JG, Groisman EA: Lateral gene transfer and
the nature of bacterial innovation. Nature 2000, 405:299-304.
18. Garcia-Vallve S, Romeu A, Palau J: Horizontal gene transfer in
Genome Biology 2009, Volume 10, Issue 6, Article R65 Cortez et al. R65.13
Genome Biology 2009, 10:R65
bacterial and archaeal complete genomes. Genome Res 2000,
10:1719-1725.
19. Ou HY, Chen LL, Lonnen J, Chaudhuri RR, Thani AB, Smith R, Garton
NJ, Hinton J, Pallen M, Barer MR, Rajakumar K: A novel strategy for
the identification of genomic islands by comparative analysis
of the contents and contexts of tRNA sites in closely related
bacteria. Nucleic Acids Res 2006, 34:e3.
20. Lawrence JG, Ochman H: Amelioration of bacterial genomes:
rates of change and exchange. J Mol Evol 1997, 44:383-397.
21. Hayes WS, Borodovsky M: How to interpret an anonymous bac-
terial genome: machine learning approach to gene identifi-
cation. Genome Res 1998, 8:1154-1171.
22. van Passel MW, Bart A, Thygesen HH, Luyf AC, van Kampen AH,
Ende A van der: An acquisition account of genomic islands
based on genome signature comparisons. BMC Genomics 2005,
6:163.
23. Campbell A, Mrazek J, Karlin S: Genome signature comparisons
among prokaryote, plasmid, and mitochondrial DNA. Proc
Natl Acad Sci USA 1999, 96:9184-9189.
24. van Passel MW, Bart A, Luyf AC, van Kampen AH, Ende A van der:
Compositional discordance between prokaryotic plasmids
and host chromosomes. BMC Genomics 2006, 7:26.
25. Monier A, Claverie JM, Ogata H: Horizontal gene transfer and
nucleotide compositional anomaly in large DNA viruses.
BMC Genomics 2007, 8:456.
26. Mrazek J, Karlin S: Distinctive features of large complex virus
genomes and proteomes. Proc Natl Acad Sci USA 2007,
104:5127-5132.
27. Lerat E, Daubin V, Moran NA: From gene trees to organismal
phylogeny in prokaryotes: the case of the gamma-Proteo-
bacteria. PLoS Biol 2003, 1:E19.
28. van Passel MW, Smillie CS, Ochman H:
Gene decay in archaea.
Archaea 2007, 2:137-143.
29. She Q, Peng X, Zillig W, Garrett RA: Gene capture in archaeal
chromosomes. Nature 2001, 409:478.
30. Williams KP: Integration sites for genetic elements in prokary-
otic tRNA and tmRNA genes: sublocation preference of
integrase subfamilies. Nucleic Acids Res 2002, 30:866-875.
31. Keller J, Leulliot N, Cambillau C, Campanacci V, Porciero S, Prangish-
villi D, Forterre P, Cortez D, Quevillon-Cheruel S, van Tilbeurgh H:
Crystal structure of AFV3-109, a highly conserved protein
from crenarchaeal viruses. Virol J 2007, 4:12.
32. Auchtung JM, Lee CA, Monson RE, Lehman AP, Grossman AD: Reg-
ulation of a Bacillus subtilis mobile genetic element by inter-
cellular signaling and the global DNA damage response. Proc
Natl Acad Sci USA 2005, 102:12554-12559.
33. Sobecky PA, Coombs JM: Horizontal gene transfer in metal and
radionuclide contaminated soils. Methods Mol Biol 2009,
532:455-472.
34. Coleman ML, Sullivan MB, Martiny AC, Steglich C, Barry K, Delong EF,
Chisholm SW: Genomic islands and the ecology and evolution
of Prochlorococcus. Science 2006, 311:1768-1770.
35. Angly FE, Felts B, Breitbart M, Salamon P, Edwards RA, Carlson C,
Chan AM, Haynes M, Kelley S, Liu H, Mahaffy JM, Mueller JE, Nulton
J, Olson R, Parsons R, Rayhawk S, Suttle CA, Rohwer F: The marine
viromes of four oceanic regions. PLoS Biol 2006, 4:e368.
36. Weinbauer MG, Rassoulzadegan F: Are viruses driving microbial
diversification and diversity? Environ Microbiol 2004, 6:1-11.
37. NCBI Database [ />38. Durbin R: Biological Sequence Analysis: Probabilistic Models of Proteins and
Nucleic Acids Cambridge: Cambridge University Press; 1998.
39. Altschul SF, Madden TL, Schaffer AA, Zhang J, Zhang Z, Miller W, Lip-
man DJ: Gapped BLAST and PSI-BLAST: a new generation of
protein database search programs.
Nucleic Acids Res 1997,
25:3389-3402.
40. R Project [ />