Báo cáo y học: "iBsu1103: a new genome-scale metabolic model of Bacillus subtilis based on SEED annotations." pdf
Bạn đang xem bản rút gọn của tài liệu. Xem và tải ngay bản đầy đủ của tài liệu tại đây (380.99 KB, 15 trang )
Genome Biology 2009, 10:R69
Open Access
2009Henryet al.Volume 10, Issue 6, Article R69
Research
iBsu1103: a new genome-scale metabolic model of Bacillus subtilis
based on SEED annotations
Christopher S Henry
*
, Jenifer F Zinner
*†
, Matthew P Cohoon
*
and
Rick L Stevens
*†
Addresses:
*
Mathematics and Computer Science Department, Argonne National Laboratory, S. Cass Avenue, Argonne, IL 60439, USA.
†
Computation Institute, The University of Chicago, S. Ellis Avenue, Chicago, IL 60637, USA.
Correspondence: Christopher S Henry. Email:
© 2009 Henry et al.; licensee BioMed Central Ltd.
This is an open access article distributed under the terms of the Creative Commons Attribution License ( which
permits unrestricted use, distribution, and reproduction in any medium, provided the original work is properly cited.
Bacillus subtilis metabolic model<p>A new and validated genome-scale metabolic model of Bacillus subtilis 168, iBsu1103, is presented that has significantly improved com-pleteness and accuracy.</p>
Abstract
Background: Bacillus subtilis is an organism of interest because of its extensive industrial
applications, its similarity to pathogenic organisms, and its role as the model organism for Gram-
positive, sporulating bacteria. In this work, we introduce a new genome-scale metabolic model of
B. subtilis 168 called iBsu1103. This new model is based on the annotated B. subtilis 168 genome
generated by the SEED, one of the most up-to-date and accurate annotations of B. subtilis 168
available.
Results: The iBsu1103 model includes 1,437 reactions associated with 1,103 genes, making it the
most complete model of B. subtilis available. The model also includes Gibbs free energy change
(Δ
r
G'°) values for 1,403 (97%) of the model reactions estimated by using the group contribution
method. These data were used with an improved reaction reversibility prediction method to
identify 653 (45%) irreversible reactions in the model. The model was validated against an
experimental dataset consisting of 1,500 distinct conditions and was optimized by using an
improved model optimization method to increase model accuracy from 89.7% to 93.1%.
Conclusions: Basing the iBsu1103 model on the annotations generated by the SEED significantly
improved the model completeness and accuracy compared with the most recent previously
published model. The enhanced accuracy of the iBsu1103 model also demonstrates the efficacy of
the improved reaction directionality prediction method in accurately identifying irreversible
reactions in the B. subtilis metabolism. The proposed improved model optimization methodology
was also demonstrated to be effective in minimally adjusting model content to improve model
accuracy.
Background
Bacillus subtilis is a naturally competent, Gram-positive,
sporulating bacterium often used in industry as a producer of
high-quality enzymes and proteins [1]. As the most thor-
oughly studied of Gram-positive and sporulating bacteria, B.
subtilis serves as a model cell for understanding the Gram-
positive cell wall and the process of sporulation. With its sim-
ilarity to the pathogens Bacillus anthracis and Staphylococ-
Published: 25 June 2009
Genome Biology 2009, 10:R69 (doi:10.1186/gb-2009-10-6-r69)
Received: 1 March 2009
Revised: 18 May 2009
Accepted: 25 June 2009
The electronic version of this article is the complete one and can be
found online at /> Genome Biology 2009, Volume 10, Issue 6, Article R69 Henry et al. R69.2
Genome Biology 2009, 10:R69
cus aureus, B. subtilis is also important as a platform for
exploring novel medical treatments for these pathogens.
Moreover, the natural competence of B. subtilis opens the
way for simple and rapid genetic modification by homologous
recombination [2].
For all these reasons, B. subtilis has been the subject of exten-
sive experimental study. Every gene essential for growth on
rich media is known [3]; 60 gene intervals covering 49% of
the genes in the genome have been knocked out and the
resulting phenotypes analyzed [4];
13
C experiments have been
run to explore the cell response to mutations in the central
carbon pathways [5]; and Biolog phenotyping experiments
[6] have been performed to study the ability of B. subtilis to
metabolize 271 different nutrient compounds [7].
As genome-scale experimental datasets begin to emerge for B.
subtilis, genome-scale models of B. subtilis are required for
the analysis and interpretation of these datasets. Genome-
scale metabolic models may be used to rapidly and accurately
predict the cellular response to gene knockout [8,9], media
conditions [10], and environmental changes [11]. Recently,
genome-scale models of the metabolism and regulation of B.
subtilis have been published by Oh et al. [7] and Goelzer et al.
[12], respectively. However, both of these models have draw-
backs and limitations. While the Goelzer et al. model provides
regulatory constraints for B. subtilis on a large scale, the met-
abolic portion of this model is limited to the central metabolic
pathways of B. subtilis. As a result, this model captures fewer
of the metabolic genes in B. subtilis, thereby restricting the
ability of the model to predict the outcome of large-scale
genetic modifications. While the Oh et al. metabolic model
covers a larger portion of the metabolic pathways and genes
in B. subtilis, many of the annotations that this model is based
upon are out of date. Additionally, both models lack thermo-
dynamic data for the reactions included in the models. With-
out these data, the directionality and reversibility of the
reactions reported in these models is based entirely on data-
bases of biochemistry such as the Kyoto Encyclopedia of
Genes and Genomes (KEGG) [13,14]. Hence, directionality is
often over-constrained, with a large number of reactions
listed as irreversible (59% of the reactions in the Goelzer et al.
model and 65% of the reactions in the Oh et al. model).
In this work, we introduce a new genome-scale model of B.
subtilis based on the annotations generated by the SEED
Project [15-17]. The SEED is an attractive source for genome
annotations because it provides continuously updated anno-
tations with a high level of accuracy, consistency, and com-
pleteness. The exceptional consistency and completeness of
the SEED annotations are primarily a result of the subsys-
tems-based strategy employed by the SEED, where each indi-
vidual cellular subsystem (for example, glycolysis) is
annotated and curated across many genomes simultaneously.
This approach enables annotators to exploit comparative
genomics approaches to rapidly and accurately propagate
biological knowledge.
During the reconstruction process for the new model, we
applied a group contribution method [18] to estimate the
standard Gibbs free energy change of reaction (Δ
r
G'°) for each
reaction included in the model. We then developed new
extensions to an existing methodology [19-21] that uses these
estimated Δ
r
G'° values along with the reaction stoichiometry
to predict the reversibility and directionality of every reaction
in the model. The Δ
r
G'° values reported for the reactions in
the model may also be of use in applying numerous forms of
thermodynamic analysis now emerging [22-24] to study the
B. subtilis metabolism on a genome scale.
Once the reconstruction process was complete, we applied a
significantly modified version of the GrowMatch algorithm
developed by Kumar and Maranas [25] to fit our model to the
available experimental data. In the GrowMatch methodology,
an optimization problem is solved for each experimental con-
dition that is incorrectly predicted by the original model, in
order to identify the minimal number of reactions that must
be added or removed from the model to correct the predic-
tion. As a result, many equivalent solutions are generated for
correcting each erroneous model prediction. We propose new
solution reconciliation steps for the GrowMatch procedure to
identify the optimal combination of GrowMatch solutions
that results in an optimized model. We also propose signifi-
cant alterations to the objective function of the GrowMatch
optimization to improve the quality of the solutions generated
by GrowMatch.
Results
Reconstruction of the Core iBsu1103 model
We started the model reconstruction by obtaining the anno-
tated B. subtilis 168 genome from the SEED. This annotated
genome consists of 2,691 distinct functional roles associated
with 3,257 (79%) of the 4,114 genes identified in the B. subtilis
168 chromosome. Of the functional roles included in the
annotation, 50% are organized into SEED subsystems, each
of which represents a single biological pathway such as histi-
dine biosynthesis. The functional roles within subsystems are
the focus of the cross-genome curation efforts performed by
the SEED annotators, resulting in greater accuracy and con-
sistency in the assignment of these functional roles to genes.
Reactions were mapped to the functional roles in the B. sub-
tilis 168 genome based on three criteria: match of the Enzyme
Commission numbers associated with the reaction and the
functional role; match of the metabolic activities associated
with the reaction and the functional role; and match of the
substrates and products associated with the reaction and
functional role [26]. In total, 1,263 distinct reactions were
associated with 1,032 functional roles and 1,104 genes. Of
these reactions, 88% were assigned to functional roles
included in the highly curated SEED subsystems, giving us a
Genome Biology 2009, Volume 10, Issue 6, Article R69 Henry et al. R69.3
Genome Biology 2009, 10:R69
high level of confidence in the annotations that form the basis
of the B. subtilis model.
Often genes produce protein products that function coopera-
tively as a multi-enzyme complex to perform a single reaction.
To accurately capture the dependency of such reactions on all
the genes encoding components of the multi-enzyme com-
plex, we grouped these genes together before mapping them
to the reaction. We identified 111 such gene groups and
mapped them to 199 distinct reactions in the B. subtilis
model. Reactions were mapped to these gene groups instead
of individual genes if: the functional roles assigned to the
genes indicated that they formed a complex; multiple consec-
utive non-homologous genes were assigned to the same func-
tional role; or the reaction represented the lumped functions
of multiple functional roles associated with multiple genes.
The metabolism of B. subtilis is known to involve some meta-
bolic functions that are not associated with any genes in the
B. subtilis genome. During the reconstruction of the B. subti-
lis model, 71 such reactions were identified. While 19 of these
reactions take place spontaneously, the genes associated with
the remaining reactions are unknown. These reactions were
added to the model as open problem reactions, indicating that
the genes associated with these reactions have yet to be iden-
tified (Table S3 in Additional data files 1 and 2).
Data from Biolog phenotyping arrays were also used in recon-
structing the B. subtilis model. The ability of B. subtilis to
metabolize 153 carbon sources, 53 nitrogen sources, 47 phos-
phate sources, and 18 sulfate sources was tested by using
Biolog phenotyping arrays [7]. Of the tested nutrients, B. sub-
tilis was observed to be capable of metabolizing 95 carbon, 42
nitrogen, 45 phosphate, and 2 sulfate sources. Transport
reactions are associated with genes in the B. subtilis 168
genome for only 94 (51%) of these proven nutrients. There-
fore, 73 open problem transport reactions were added to the
model to allow for transport of the remaining Biolog nutrients
that exist in our biochemistry database (Table S3 in Addi-
tional data files 1 and 2).
In total, the unoptimized SEED-based B. subtilis model con-
sists of 1,405 reactions and 1,104 genes (Table 1). We call this
model the Core iBsu1103, where the i stands for in silico, the
Bsu stands for B. subtilis, and the 1,103 stands for the number
of genes captured by the model (one gene is lost during the
model optimization process described later). In keeping with
the modeling practices first proposed by Reed et al. [27], pro-
tons are properly balanced in the model by representing all
model compounds and reactions in their charge-balanced
and mass-balanced form in aqueous solution at neutral pH
[28].
Construction of a biomass objective function
In order to use the reconstructed iBsu1103 model to predict
cellular response to media conditions and gene knockout, a
biomass objective function (BOF) was constructed. This BOF
was based primarily on the BOF developed for the Oh et al.
genome-scale model of B. subtilis [7]. The 61 small molecules
that make up the Oh et al. BOF can be divided into seven cat-
egories representing the fundamental building blocks of bio-
mass: DNA, RNA, lipids, lipoteichoic acid, cell wall, protein,
and cofactors and ions. In the Oh et al. BOF, all of these com-
ponents are lumped together as reactants in a single biomass
synthesis reaction, which is not associated with any genes
involved in macromolecule biosynthesis. In the iBsu1103
model, we decomposed biomass production into seven syn-
thesis reactions: DNA synthesis; RNA synthesis; protein syn-
thesis; lipid content; lipoteichoic acid synthesis; cell wall
synthesis; and biomass synthesis. These abstract species pro-
duced by these seven synthesis reactions are subsequently
consumed as reactants along with 22 cofactors and ionic spe-
cies in the biomass synthesis reaction. This process reduces
the complexity of the biomass synthesis reaction and makes
the reason for the inclusion of each species in the reaction
more transparent. Additionally, this allows the macromole-
cule synthesis reactions to be mapped to macromolecule bio-
synthesis genes in B. subtilis. For example, genes responsible
for encoding components of the ribosome and genes respon-
sible for tRNA loading reactions were all assigned together as
a complex associated with the protein synthesis reaction.
Table 1
Model content overview
Model Core iBsu1103 Optimized iBsu1103 Oh et al. model
Number of genes 1,104 (26.8%) 1,103 (26.8%) 844
Total reactions 1,411 1,443 1,020
Reactions associated with genes 1,266 (89.7%) 1,263 (87.5%) 904 (88.6%)
Spontaneous reactions 20 (1.4%) 20 (1.4%) 2 (0.2%)
Open problem reactions 125 (8.9%) 160 (11.1%) 114 (11.2%)
Total compounds 1,144 1,145 988
Genome Biology 2009, Volume 10, Issue 6, Article R69 Henry et al. R69.4
Genome Biology 2009, 10:R69
Some of the species acting as biomass precursor compounds
in the Oh et al. BOF were also altered in the adaptation of the
BOF to the iBsu1103 model. In the Oh et al. model, the BOF
involves 11 lumped lipid and teichoic acid species, which rep-
resent the averaged combination of numerous lipid com-
pounds with varying carbon chain lengths. In the
development of the fatty acid and cell wall biosynthesis path-
ways for the iBsu1103 model, we represented every distinct
fatty acid and teichoic acid species explicitly rather than using
lumped reactions and compounds. As a result, lumped spe-
cies that serve as biomass components in the Oh et al. model
were replaced by 99 explicit species in the iBsu1103 BOF. Of
these species, 63 serve as reactants in the lipid content reac-
tion, while the remaining species serve as reactants in the tei-
choic acid synthesis reaction.
Two new biomass precursor compounds were added to the
biomass synthesis reaction of the iBsu1103 model to improve
the accuracy of the gene essentiality predictions: coenzyme A
(CoA) and acyl-carrier-protein (ACP). Both of these species
are used extensively as carrier compounds in the metabolism
of B. subtilis, making the continuous production of these
compounds essential. The biosynthesis pathways for both
compounds already existed in the iBsu1103, and two of the
steps in these pathways are associated with essential genes in
B. subtilis: ytaG (peg.2909) and acpS (peg.462). If these spe-
cies are not included in the BOF, these pathways become non-
functional, and the essential genes associated with these
pathways are incorrectly predicted to be nonessential.
The coefficients in the Oh et al. BOF are derived from numer-
ous analyses of the chemical content of B. subtilis biomass
[29-33]. We similarly derived the coefficients for the
iBsu1103 model from these sources. While no data were avail-
able on the percentage of B. subtilis biomass represented by
our two additional biomass components CoA and ACP, we
assume these components to be 0.5% of the net mass of cofac-
tors and ions represented in the BOF.
Results of automated assignment of reaction
reversibility
The group contribution method [18] was used to estimate
standard Gibbs free energies of formation (Δ
f
G'°) for 948
(83.3%) of the metabolites and Δ
r
G'° for 1,372 (97.4%) of the
reactions in the unoptimized iBsu1103 model. Estimated
Δ
r
G'° values were used in combination with a set of heuristic
rules (see Materials and methods) to predict the reversibility
and directionality of each reaction in the model under physi-
ological conditions (Figure 1). Based on these reversibility
rules, 635 (45%) of the reactions in the model were found to
be irreversible. However, when the directionality of the irre-
versible reactions was set according to our reversibility crite-
ria, the model no longer predicted growth on LB or glucose-
minimal media. This result indicates that the direction of flux
required for growth under these media conditions contra-
dicted the predicted directionality for some of the irreversible
reactions in the model. Six reactions were identified in the
model that met these criteria (Table 2). In every case, these
reactions were irreversible in the reverse direction because
the minimum Gibbs free energy change ( ) of each
reaction was greater than zero. However, all of these reactions
involve uncommon molecular substructures for which few
experimental thermodynamic data are available [18]. Thus, in
combination with the strong experimental evidence for the
activity of these reactions in the direction shown in Table 2,
we assumed that the Δ
r
G'° values of these reactions were
overestimated by the group contribution method and that
these reactions are, in fact, reversible.
Results of the model optimization procedure
The unoptimized model was validated against a dataset con-
sisting of 1,500 distinct experimental conditions, including
gene essentiality data [3], Biolog phenotyping data [7], and
gene interval knockout data [4] (Table 3). Initially, 85 errors
arose in the gene essentiality predictions, including 58 false
positives (an essential gene being predicted to be nonessen-
Δ
r
G
min
’
Table 2
Reactions required to violate the automated reversibility rules
Reaction name Equation Δ
r
G
'm
(kcal/mol)
CMP-lyase 2-p-4-CDP-2-m-eryth => CMP + 2-m-eryth-2-4-cyclodiphosphate 22.7
Dihydroneopterin aldolase Dihydroneopterin => Glycolaldehyde + 2-Amino-4-hydroxy-6-hydroxymethyl-7,8-
dihydropteridine
10.7
Tetrahydrodipicolinate acetyltransferase H
2
O + Acetyl-CoA + Tetrahydrodipicolinate => CoA + L-2-acetamido-6-oxopimelate 11.4
Dihydroorotase H
+
+ N-carbamoyl-L-aspartate => H
2
O + L-dihydroorotate 5.3
Phosphoribosyl aminoimidazole synthase ATP + 5'-Phosphoribosylformylglycinamidine => ADP + Phosphate + H
+
+
Aminoimidazole ribotide
16.6
Sulfate adenylyltransferase ATP + Sulfate + H
+
=> Diphosphate + Adenylyl sulfate 12.6
Genome Biology 2009, Volume 10, Issue 6, Article R69 Henry et al. R69.5
Genome Biology 2009, 10:R69
tial) and 27 false negatives (a nonessential gene being pre-
dicted to be essential). The annotations of all erroneously
predicted essential and nonessential genes were manually
reviewed to identify cases where the prediction error was a
result of an incorrect gene annotation. Of the essential genes
that were predicted to be nonessential, 30 were mapped to
essential metabolic functions in the model. However, these
essential genes all had homologs in the B. subtilis genome
that were mapped to the same essential metabolic functions
(Table S4 in Additional data files 1 and 2). Three explanations
exist for the apparent inactivity of these gene homologs: they
are similar to the essential genes but actually perform a differ-
ent function; they are nonfunctional homologs; or the regula-
tory network in the cell deactivates these genes, making them
incapable of taking over the functions of the essential genes
when they are knocked out. In order to correct the essentiality
predictions in the model, these 30 homologous genes were
disassociated from the essential metabolic functions.
We then applied our modified GrowMatch model optimiza-
tion procedure (see Materials and methods) in an attempt to
fix the 116 remaining false negative predictions and 39
remaining false positive predictions (Figure 2). First, the gap
filling algorithm was applied to identify existing irreversible
reactions that could be made reversible or new reactions that
could be added to correct each false negative prediction. This
step produced 686 solutions correcting 78 of the false nega-
tive predictions. The gap filling reconciliation algorithm was
used to combine the gap filling solutions into a single solution
that corrected 45 false negative predictions and introduced
five new false positive predictions. Next, the gap generation
algorithm was applied to identify reactions that could be
removed or made irreversible to correct each false positive
prediction. The gap generation algorithm produced 144 solu-
tions correcting 32 of the false positive predictions. The gap
generation reconciliation algorithm combined these solutions
into a single solution that corrected 11 false positive predic-
tions without introducing any new false negative predictions.
Overall, two irreversible reactions were made reversible, 35
new reactions were added to the model, 21 reversible reac-
tions were made irreversible, and 3 reactions were removed
entirely from the model (Table S5 in Additional data files 1
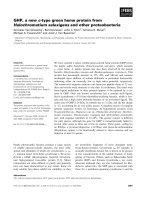
Distribution of reactions conforming to reversibility rulesFigure 1
Distribution of reactions conforming to reversibility rules. (a) The
distribution of reactions in the iBsu1103 model conforming to every
possible state in the proposed set of rules for assigning reaction
directionality and reversibility is shown. This distribution indicates that
most of the irreversible reactions in the model were determined to be
irreversible because the Δ
r
G
'
max
value calculated for the reaction was
negative. (b) The distribution of reactions in the iBsu1103 model involving
the compounds used in the reversibility score calculation is also shown.
These compounds are prevalent in the reactions of the iBsu1103 model,
with 64% of the reactions in the model involving at least one of these
compounds.
29%
20%
13%
12%
12%
7%
5%
1%
1%
19%
17%
5%
34%
23%
2%
Involving phosphate
ATP hydrolysis
Involving diphosphate
Involving dihydrolipoamide
Involving coenzyme A
Involving ACP
Involving NH
3
Involving CO
2
Involving HCO
3
ABC transporter
(a)
(b)
Irreversible (45%)
Reversible (65%)
q
Δ
<
'
max
0
r
G
'
'
0& 0
m
rrev
GS
=
0
rev
S
'd
'
2
m
r
GmM
'
<
'
0
m
rrev
GS
q
'
'
Unknown
r
G
~
Table 3
Accuracy of model predictions before and after optimization
Data type Experimental data Core iBsu1103 (correct/total) Fit iBsu1103 (correct/total) Oh et al. model (correct/total)
Biolog media with nonzero
growth
184 [7] 107/184 (58.2%) 137/184 (74.5%) 122/184 (66.3%)
Biolog media with zero growth 87 [7] 80/87 (92%) 81/87 (93.1%) 79/87 (90.8%)
Essential genes in LB media 271 [3] 187/215 (87%) 192/215 (89.3%) 63/91 (69.2%)
Nonessential genes in LB media 3,841 [3] 862/889 (97%) 872/888 (98.2%) 657/675 (97.3%)
Nonessential intervals in LB
media
63 [4] 55/63 (87.3%) 58/63 (92.1%) 58/63 (92.1%)
Nonessential intervals in minimal
media
54 [4] 48/54 (88.9%) 49/54 (90.7%) 50/54 (92.6%)
Essential gene intervals in
minimal media
9 [4] 5/9 (55.6%) 5/9 (55.6%) 6/9 (66.7%)
Overall accuracy 4,452 1,344/1,501 (89.5%) 1,398/1,500 (93.2%) 1,035/1,163 (89.0%)
LB, Luria-Bertani.
Genome Biology 2009, Volume 10, Issue 6, Article R69 Henry et al. R69.6
Genome Biology 2009, 10:R69
and 2). As a result of these changes, the model accuracy
increased from 89.7% to 93.1%.
Model overview
The final optimized version of the iBsu1103 model consists of
1,437 reactions, 1,138 metabolites, and 1,103 genes (Table 1).
Based on the reversibility rules and the estimated thermody-
namic data, 653 (45.0%) of the model reactions were deter-
mined to be irreversible. All data relevant to the model are
provided in the Additional data files, including metabolite
structures (Additional data file 3), metabolite data (Table S1
in Additional data files 1 and 2), reaction data (Table S2 in
Additional data files 1 and 2), estimated thermodynamic data
(Table S2 in Additional data files 1 and 2), model stoichiome-
try in SBML format (Additional data file 4), and mappings of
model compound and reaction IDs to IDs in the KEGG and
other genome-scale models (Tables S1 and S2 in Additional
data files 1 and 2).
The reactions included in the optimized model were catego-
rized into ten regions of B. subtilis metabolism (Figure 3a;
Table S2 in Additional data files 1 and 2). The largest category
of model reactions is 'fatty acid and lipid biosynthesis'. This is
due to the explicit representation of the biosynthesis of every
significant lipid species observed in B. subtilis biomass as
opposed to the lumped reactions used in other models. The
explicit representation of these pathways has numerous
advantages: Δ
f
G'° and Δ
r
G'° may be estimated for every spe-
cies and reaction; every species has a distinct structure, mass,
and formula; and the stoichiometric coefficients in the reac-
tions better reflect the actually biochemistry taking place. The
other most significantly represented categories of model reac-
tions are carbohydrate metabolism, amino acid biosynthesis
and metabolism, and membrane transport. These categories
are expected to be well represented because they represent
pathways in the cell that deal with a highly diverse set of sub-
strates: 20 amino acids, more than 95 metabolized carbon
sources, and 244 transportable compounds.
Reactions in the model were also categorized according to
their behavior during growth on Luria-Bertani (LB) media
(Figure 3b; Table S2 in Additional data files 1 and 2). Of the
model reactions, 300 (21%) were essential for minimal
growth on LB media. These are the reactions fulfilling essen-
tial metabolic functions for B. subtilis where no other path-
ways exist, and they form an always-active core of the B.
subtilis metabolism. Another 697 (49%) of the model reac-
tions were nonessential but capable of carrying flux during
growth on LB media. While these reactions are not individu-
ally essential, growth is lost if all of these reactions are simul-
taneously knocked out. The reason is that some of these
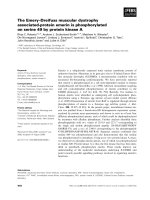
Model optimization procedure resultsFigure 2
Model optimization procedure results. The results are shown from the
application of each step of the model optimization procedure to fit the
iBsu1103 model to the 1,500 available experimental data-points. KO,
knock out.
Initial iBsu1101 model:
~116 f alse negatives: 27 gene KO/75 biolog/14 interval KO
~39 false positives: 28 gene KO/7 biolog/4 interval KO
Gap generation
Gap filling
686 solutions correcting
78/116 false negatives
144 solutions correcting
32/44 false positives
~Make 2 reactions reversible
~Add 35 new reactions
Gap filling
reconciliation
Gap filled iBsu 1101 model:
~71 f alse negatives: 16 gene KO/45 biolog/10 interval KO
~44 f alse positives: 28 gene KO/11 biolog/5 interval KO
Gap generation
reconciliation
~Make 22 reactions irreversible
~Entirely remove 3 reactions
Optimized iBsu1101 model:
~71 f alse negatives: 16 gene KO/45 biolog/10 interval KO
~33 false positives: 23 gene KO/6 biolog/4 interval KO
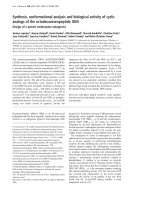
Classification of model reactions by function and behaviorFigure 3
Classification of model reactions by function and behavior. (a) Reactions
in the optimized iBsu1103 model are categorized into ten regions of the B.
subtilis metabolism. Regions of metabolism involving a diverse set of
substrates typically involve the greatest number of reactions. (b) The
iBsu1103 reactions were also categorized according to their essentiality
during minimal growth on Luria-Bertani (LB) media.
21%
20%
17%
14%
11%
9%
6%
2%
20%
1%
21%
13%
15%
16%
14%
(a)
(b)
Essential in reverse direction
Essential in forward direction
Nonessential always forward
Cannot carry flux in LB media
Nonessential always reverse
Nonessential reversible
Disconnected from network
Carbohydrates
Fatty acids and lipids
Amin o acids an d d erivatives
Sulfur metabolism
Membrane tran sport
Cofactors an d vitamins
Metabolism of aromatics
Macromolecule synthesis
Nucleosides and nucleotides
Cell wall an d capsule
Genome Biology 2009, Volume 10, Issue 6, Article R69 Henry et al. R69.7
Genome Biology 2009, 10:R69
reactions represent competing pathways for performing an
essential metabolic function. Another 229 (16%) of the reac-
tions cannot carry flux during growth on LB media. These
reactions are on the periphery of the B. subtilis metabolism
involved in the transport and catabolism of metabolites not
included in our in silico representation of LB media. Moreo-
ver, 210 (14%) of the model reactions are disconnected from
the network, indicating that these reactions either lead up to
or are exclusively derived from a dead end in the metabolic
network. Presence of these reactions indicates miss-annota-
tion or overly generic annotation of the gene associated with
the reaction, or a gap in the metabolic network. Thus, these
reactions represent areas of the metabolic chemistry where
more experimental study and curation of annotations must
occur.
Comparison with previously published models of B.
subtilis
We performed a detailed comparison of the Oh et al. and
iBsu1103 models to identify differences in content and eluci-
date the conflicts in the functional annotation of genes (Table
1). Our comparison encompassed the reactions involved in
the models, the genes involved in the models, the mappings
between genes and reactions in the models, and the gene
complexes captured by the models (Figure 4). Our compari-
son revealed significant overlap in the content of the two
models. Of the 1,020 total reactions in the Oh et al. model,
810 (79%) were also contained in the iBsu1103 model. The
remaining 210 Oh et al. reactions were excluded from the
iBsu1103 model primarily because of a disagreement between
the Oh et al. and SEED annotations or because they were
lumped reactions that were represented in un-lumped form
in the iBsu1103 model (Table S6 in Additional data files 1 and
2).
Significant agreement was also found in the mapping of genes
to reactions in the Oh et al. and iBsu1103 models. Of the 1,550
distinct gene-reaction mappings that involved the 810 reac-
tions found in both models, 997 (64%) were identical. Of the
357 mappings that were exclusive to the iBsu1103 model, 20
involved reactions that were included in the Oh et al. model
without any gene association. The remaining 337 exclusive
iBsu1103 mappings involved paralogs or gene complexes not
captured in the Oh et al. annotation. The 175 mappings exclu-
sive to the Oh et al. model all represent conflicts between the
functional annotations in the Oh et al. model and the func-
tional annotations generated by the SEED. Although some of
these Oh et al. exclusive mappings involved eight reactions
with no associated gene in the iBsu1103 model, these map-
pings were rejected because they conflicted with the SEED
annotation.
In addition to containing most of the reaction and annotation
content of the Oh et al. model, the iBsu1103 model also
includes 628 reactions and 354 genes that are not in the Oh et
al. model (Figure 4; Table S2 in Additional data files 1 and 2).
Of the additional reactions in the iBsu1103 model, 173 are
associated with the 354 genes that are exclusive to the
iBsu1103 model. These additional reactions are a direct result
of the improved coverage of the B. subtilis genome by the
SEED functional annotation. The remaining 455 reactions
that are exclusive to the iBsu1103 model take part in a variety
of functional categories spread throughout the
B. subtilis
metabolism, although nearly half of these reactions partici-
pate in the fatty acid and lipid biosynthesis (Figure 4b). These
reactions are primarily a result of the replacement of lumped
fatty acid and lipid reactions in the Oh et al. model with
unlumped reactions in the iBsu1103 model.
A comparison of the gene complexes encoded in both model
reveals little overlap in this portion of the models. Of the 111
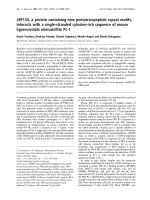
Comparison of iBsu1103 model to the Oh et al. modelFigure 4
Comparison of iBsu1103 model to the Oh et al. model. (a) A detailed
comparison of the iBsu1103 model and the Oh et al. model was performed
to determine overlap of reactions, genes, annotations, and gene
complexes between the two models. In the annotation comparison, only
annotations involving the 818 overlapping reactions in the two models
were compared; and each annotation consisted of a single reaction paired
with a single gene. If two genes were mapped to a single reaction, this was
treated as two separate annotations in this comparison. (b) The
distribution of the 628 reactions that are exclusive to the iBsu1103 model
among the metabolic pathways of the cell. Almost half of the exclusive
reactions in the iBsu1103 model are involved in the Fatty Acids and Lipids
pathway due to the unlumping of these reaction pathways in the iBsu1103
model.
43%
15%
11%
9%
7%
8%
5%
3%
Percent of total
Oh et al model only
iBsu1121 only
Common
207
354
357
8
628
749
175
88
23
94
810
997
(a)
(b)
100%
80%
60%
40%
20%
0%
Carbohydrates
Fatty acids and lipids
Amino acids and derivatives
Sulfur metabolism
Membrane transport
Cofactors and vitamins
Metabolism of aromatics
Macromolecule synthesis
Nucleosides and nucleotides
Cell wall and capsule
Genome Biology 2009, Volume 10, Issue 6, Article R69 Henry et al. R69.8
Genome Biology 2009, 10:R69
distinct gene complexes encoded in the iBsu1103 model, only
21 overlapped with the Oh et al. model, whereas the Oh et al.
model contained only 8 gene complexes not encoded in the
iBsu1103 model (Figure 3). This indicates a significantly more
complete handling of complexes in the iBsu1103 model.
All of the additional content in the iBsu1103 model translates
into a significant improvement in the accuracy of the gene
knockout predictions, the Biolog media growth predictions,
and the gene interval knockout predictions (Table 3). Even
before optimization, the iBsu1103 model is 0.7% more accu-
rate than the Oh et al. model. After optimization, the
iBsu1103 model is 4.1% more accurate. In addition to the
improvement in accuracy, the improved coverage of the
genome by the iBsu1103 model also allows for the simulation
of 337 additional experimental conditions by the model.
We note that while the annotations used in the iBsu1103
model were derived primarily from the SEED, the Oh et al.
model proved invaluable in reconstructing the iBsu1103
model. The work of Oh et al. was the source of Biolog pheno-
typing data and analysis; and the Oh et al. model itself was a
valuable source of reaction stoichiometry, metabolite
descriptions, and data on biomass composition, all of which
were used in the reconstruction of the iBsu1103 model.
Conclusions
As one of the first genome-scale metabolic models con-
structed based on an annotated genome from the SEED
framework, the iBsu1103 model demonstrates the excep-
tional completeness and accuracy of the annotations gener-
ated by the SEED. The iBsu1103 model covers 259 more genes
than the Oh et al. model; it can simulate 337 more experimen-
tal conditions; and it simulates conditions with greater accu-
racy. In fact, of the seven new assignments of functions to
genes proposed in the Oh et al. work based on manual gene
orthology searches, two were already completely captured by
the SEED annotation for B. subtilis 168 prior to the publica-
tion of the Oh et al. manuscript. Another two of these pro-
posed annotations were partially captured by the SEED
annotation.
In this work we also demonstrate new extended reversibility
criteria for consistently and automatically assigning direc-
tionality to the biochemical reactions in genome-scale meta-
bolic models. The extended criteria enabled us to identify 306
additional irreversible reactions that are missed when using
existing methodologies alone [19-21]. However, we also found
that even with the extended criteria, the predicted reversibil-
ity was not correct for every reaction in the model. In order for
model predictions to fit available experimental observations,
the predicted reversibility had to be adjusted for 29 (2%) of
the model reactions. Some possible explanations for these
exceptions to the reversibility criteria include: the estimated
Δ
r
G'° may be too high or too low; the reactant or product con-
centrations may be tightly regulated to levels that prohibit
reactions from functioning in certain directions; or the reac-
tions involve additional/alternative cofactors not accounted
for in current reversibility calculations. These exceptions to
the reversibility rules emphasize the importance of using a
model correction method to adjust predicted reversibility
based on experimental data. While these rules were very
effective with the iBsu1103 model, they still need to be vali-
dated with a wider set of organisms and models. The
extended version of GrowMatch presented in this work was
also demonstrated to be a highly effective means of identify-
ing and correcting potential errors in the metabolic network
that cause errors in model predictions. This method is driven
entirely by the available experimental data, requiring manual
input only in selecting the best of the equivalent solutions
generated by the solution reconciliation steps of the method.
The reconciliation steps we introduced to the GrowMatch
method also proved to be effective for identifying the minimal
changes to the model required to produce the optimal fit to
the available experimental data. The reconciliation reduced
830 distinct solutions involving hundreds of changes to the
model to a single solution that combined 62 model modifica-
tions to fix 51 (33%) of the 155 incorrect model predictions.
Overall, we demonstrate the iBsu1103 model to be the most
complete and accurate model of B. subtilis published to date.
The identification and encoding of gene complexes, the
removal of lumped reactions and compounds, and the refine-
ments of the biomass objective function make this model
especially applicable to thermodynamic analysis and gene
knockout prediction. This model will be a valuable tool in the
ongoing efforts to genetically engineer a minimal strain of B.
subtilis for numerous engineering applications [2,4]. The
thermodynamic data published with this model will be inval-
uable in the application of the model to numerous emerging
forms of thermodynamic analysis [22-24]. Additionally, the
new extensions that we have proposed for methods of auto-
matically predicting reaction reversibility and automatically
correcting model errors are valuable steps towards the goal of
automating the genome-scale model reconstruction process
[34,35].
Materials and methods
Validation of the B. subtilis model using flux balance
analysis
Flux balance analysis (FBA) was used to simulate all experi-
mental conditions to validate the iBsu1103 model. FBA
defines the limits on the metabolic capabilities of a model
organism under steady-state flux conditions by constraining
the net production rate of every metabolite in the system to
zero [36-39]. This quasi-steady-state constraint on the meta-
bolic fluxes is described mathematically in Equation 1:
Nv⋅=0
(1)
Genome Biology 2009, Volume 10, Issue 6, Article R69 Henry et al. R69.9
Genome Biology 2009, 10:R69
In Equation 1, N is the m × r matrix of the stoichiometric coef-
ficients for the r reactions and m metabolites in the model,
and v is the r × 1 vector of the steady-state fluxes through the
r reactions in the model. Bounds are placed on the reaction
fluxes depending on the reversibility of the reactions:
- (CDW = cell dry weight). When simulating a gene knockout,
the bounds on the flux through all reactions associated exclu-
sively with the gene being knocked out (or associated exclu-
sively with a protein complex partially encoded by the gene
being knocked out) were reset to zero. When simulating
media conditions, only nutrients present in the media were
allowed to have a net uptake by the cell. All other transporta-
ble nutrients were allowed only to be excreted by the cell.
Details on conditions for all FBA simulations performed are
provided in Table S8 in Additional data files 1 and 2.
Prediction of reaction reversibility based on
thermodynamics
The reversibility and directionality of the reactions in the
iBsu1103 model were determined by using a combination of
thermodynamic analysis and a set of heuristic rules based on
knowledge of metabolism and biochemistry. In the thermo-
dynamic analysis of the model reactions, Δ
r
G'° was estimated
for each reaction in the model by using the group contribution
method [40-42]. The estimated Δ
r
G'° values were then used
to determine the minimum and maximum possible values for
the absolute Gibbs free energy change of reaction (Δ
r
G
'
) using
Equations 4 and 5, respectively:
In these equations, x
min
is the minimal metabolite activity,
assumed to be 0.01 mM; x
max
is the maximum metabolite
activity, assumed to be 20 mM; R is the universal gas con-
stant; T is the temperature; n
i
is the stoichiometric coefficient
for species i in the reaction; U
r
is the uncertainty in the esti-
mated Δ
r
G'°; and ΔG
Transport
is the energy involved in trans-
port of ions across the cell membrane. Any reaction with a
negative maximum Gibbs free energy change of reaction
( ) was assumed to be irreversible in the forward
direction, and any reaction with a positive was
assumed to be irreversible in the reverse direction. These cri-
teria form the basis of many existing methods for predicting
reaction reversibility [19-21].
However, in our work with the iBsu1103 model we found that
and alone are insufficient to exhaustively
identify every irreversible reaction in a model. Many reac-
tions that are known to be irreversible have a negative
and a positive due primarily to a lack of
knowledge of true metabolite concentration ranges. To iden-
tify every irreversible reaction in the iBsu1103 model, we
developed and applied a set of three heuristic rules based on
common categories of biochemical reactions that are known
to be irreversible: carboxylation reactions, phosphorylation
reactions, CoA and ACP ligases, ABC transporters, and reac-
tions utilizing ATP hydrolysis to drive an otherwise unfavora-
ble action. We applied our new heuristic rules to identify any
irreversible reactions that were missed by previous methods
based only on and .
The first reversibility rule is that all ABC transporters are irre-
versible. As a result of the application of this rule, ATP syn-
thase is the only transporter in the iBsu1103 model capable of
producing ATP directly. The second reversibility rule is that
any reaction with a milli-molar Gibbs free energy change
(Δ
r
G
'm
) that is less than 2 kcal/mol and greater than -2 kcal/
mol is reversible. The Δ
r
G
'm
is calculated by using Equation 6:
Δ
r
G
'm
is preferred over Δ
r
G'° when assessing reaction feasibil-
ity under physiological conditions because the 1-mM refer-
ence state of Δ
r
G
'm
better reflects the intracellular metabolite
concentration levels than does the 1-M reference state of
Δ
r
G'°.
The final reversibility rule uses a reversibility score, S
rev
, cal-
culated as follows:
In this equation, n
x
is the number of molecules of type x
involved in the reaction, Pi represents phosphate, Ppi repre-
sents pyrophosphate, and
λ
i
is a binary parameter equal to 1
when i is a low-energy substrate and equal to zero otherwise.
Lower-energy substrates in this calculation include CO
2
,
HCO
3
-
, CoA, ACP, phosphate, and pyrophosphate. According
−≤≤100 100 mMol gm CDW h mMol gm CDW h//
,
v
i reversible
(2)
00 100./ /
,
mMol gm CDW h mMol gm CDW h≤≤v
i irreversible
(3)
ΔΔΔ
rr i
i
i
i
GGG RTnxRTn
min
’’
min
ln=+ +
()
+
°
==
∑
Transport
Products
11
RReactants
∑
()
−ln
max
xU
r
(4)
ΔΔΔ
rr i
i
oducts
i
i
GGG RTnxRTn
max
’’
Pr
max
ln=+ +
()
+
°
==
∑
Transport
11
RReactants
∑
()
+ln
min
xU
r
(5)
Δ
r
G
max
’
Δ
r
G
min
’
Δ
r
G
min
’
Δ
r
G
max
’
Δ
r
G
min
’
Δ
r
G
max
’
Δ
r
G
min
’
Δ
r
G
max
’
ΔΔΔ
r
m
ri
i
GGG RT n
’’
ln .=+ +
°
=
∑
Transport
Products and reactants
1
00001
()
(6)
S min n n n min n n n n
ATP ADP Pi ATP AMP Ppi i i
i
Substra
Rev
=+ −
=
(, ,) (, ,)
λ
0
ttes
∑
(7)
Genome Biology 2009, Volume 10, Issue 6, Article R69 Henry et al. R69.10
Genome Biology 2009, 10:R69
to the final reversibility rule, if the product of S
rev
and Δ
r
G
'm
is
>2 and Δ
r
G
'm
is <0, the reaction is irreversible in the forward
direction; if the product of S
rev
and Δ
r
G
'm
is >2 and Δ
r
G
'm
is >0,
the reaction is irreversible in the reverse direction. All
remaining reactions that fail to meet any of the reversibility
rule criteria are considered to be reversible.
Model optimization procedure overview
We applied an extended version of the GrowMatch procedure
developed by Kumar et al. [25] to identify changes in the sto-
ichiometry of the iBsu1103 model that would eliminate erro-
neous model predictions. The procedure consists of four steps
applied consecutively (Figure 2): step 1, gap filling to identify
and fill gaps in the original model that cause false negative
predictions (predictions of zero growth where growth is
known to occur); step 2, gap filling reconciliation to combine
many gap filling solutions to maximize correction of false
negative predictions while minimizing model modifications;
step 3, gap generation to identify extra or under-constrained
reactions in the gap-filled model that cause false positive pre-
dictions (predictions of growth where growth is known not to
occur); and step 4, gap generation reconciliation to combine
the gap generation solutions to maximize correction of false
positive predictions with a minimum of model modifications.
While the gap filling and gap generation steps are based
entirely on the existing GrowMatch procedure (with some
changes to the objective function), the reconciliation steps
described here are new.
Model optimization step one: gap filling
The gap filling step of the model optimization process, origi-
nally proposed by Kumar et al. [43], attempts to correct false
negative predictions in the original model by either relaxing
the reversibility constraints on existing reactions or by adding
new reactions to the model. For each simulated experimental
condition with a false negative prediction, the following opti-
mization was performed on a superset of reactions consisting
of every balanced reaction in the KEGG or in any one of ten
published genome-scale models [7,12,20,27,44-49]:
Objective:
Subject to:
The objective of the gap filling procedure (Equation 8) is to
minimize the number of reactions that are not in the original
model but must be added in order for biomass to be produced
under the simulated experimental conditions. Because the
gap filling is run only for conditions with a false negative pre-
diction by the original model, at least one reaction will always
need to be added.
In the gap filling formulation, all reactions are treated as
reversible, and every reversible reaction is decomposed into
separate forward and reverse component reactions. This
decomposition of reversible reactions allows for the inde-
pendent addition of each direction of a reaction by the gap fill-
ing, which is necessary for gaps to be filled by the relaxation
of the reversibility constraints on existing reactions. As a
result of this decomposition, the reactions represented in the
gap filling formulation are the forward and backward compo-
nents of the reactions in the original KEGG/model superset.
In the objective of the gap filling formulation, r
gapfilling
repre-
sents the total number of component reactions in the super-
set; z
i
is a binary use variable equal to 1 if the flux through
component reaction i is nonzero; and
λ
gapfill, i
is a constant
representing the cost associated with the addition of compo-
nent reaction i to the model. If component reaction i is
already present in the model,
λ
gapfill, i
is equal to zero. Other-
wise,
λ
gapfill, i
is calculated by using Equation 12:
Each of the P variables in Equation 12 is a binary constant
representing a type of penalty applied for the addition of var-
ious component reactions to the model. These constants are
equal to 1 if the penalty applies to a particular reaction and
equal to zero otherwise. P
KEGG, i
penalizes the addition of com-
ponent reactions that are not in the KEGG database. Reac-
tions in the KEGG database are favored because they are up
to date and typically do not involve any lumping of metabo-
lites. P
structure, i
penalizes the addition of component reactions
that involve metabolites with unknown structures. P
known-ΔG, i
penalizes the addition of component reactions for which Δ
r
G'°
cannot be estimated. P
unfavorable, i
penalizes the addition of
component reactions operating in an unfavorable direction as
predicted by our reaction directionality prediction method.
Inclusion of these penalty terms in the
λ
gapfill, i
objective coef-
ficients significantly improves the quality of the solutions
produced by the gap filling method.
Equation 9 represents the mass balance constraints that
enforce the quasi-steady-state assumption of FBA. In this
equation, N
super
is the stoichiometric matrix for the decom-
posed superset of KEGG/model reactions, and v is the vector
of fluxes through the forward and reverse components of our
superset reactions.
Minimize
λ
gapfill i i
i
r
z
gapfilling
,
()
=
∑
1
(8)
Nv
Super
•=0
(9)
01≤≤ =vv zi r
imaxii,
,,…
(10)
v
bio
>
−
10
3
gm/gm CDW hr
(11)
λ
gapfill i i i G i
PP P P
,,,,
=+ + + +1
KEGG structure known- unfavorableΔ ,,i
3
10
+
°
⎛
⎝
⎜
⎜
⎜
⎞
⎠
⎟
⎟
⎟
Δ
r
G
iest
m
,
(12)
Genome Biology 2009, Volume 10, Issue 6, Article R69 Henry et al. R69.11
Genome Biology 2009, 10:R69
Equation 10 enforces the bounds on the component reaction
fluxes (v
i
), and the values of the component reaction use var-
iables (z
i
). This equation ensures that each component reac-
tion flux, v
i
, must be zero unless the use variable associated
with the component reaction, z
i
, is equal to 1. The v
max, i
term
in Equation 10 is the key to the simulation of experimental
conditions in FBA. If v
max, i
corresponds to a reaction associ-
ated with a knocked-out gene in the simulated experiment,
this v
max, i
is set to zero. If v
max, i
corresponds to the uptake of
a nutrient not found in the media conditions being simulated,
this v
max, i
is also set to zero. Equation 11 constrains the flux
through the biomass reaction in the model, v
bio
, to a nonzero
value, which is necessary to identify sets of component reac-
tions that must be added to the model in order for growth to
be predicted under the conditions being simulated.
Each solution produced by the gap filling optimization
defines a list of irreversible reactions within the original
model that should be made reversible and a set of reactions
not in the original model that should be added in order to fix
a single false negative prediction. Recursive mixed integer
linear programming (MILP) [50] was applied to identify the
multiple gap filling solutions that may exist to correct each
false negative prediction. Each solution identified by recur-
sive MILP was implemented in a test model and validated
against the complete set of experimental conditions. All
incorrect predictions by a test model associated with each gap
filling solution were tabulated into an error matrix for use in
the next step of the model optimization process: gap filling
reconciliation.
Model optimization step two: gap filling reconciliation
The gap filling step in the model optimization algorithm pro-
duces multiple equally optimal solutions to correct each false
negative prediction in the unoptimized model. While all of
these solutions repair at least one false negative prediction,
they often do so at the cost of introducing new false positive
predictions. To identify the cross-section of gap filling solu-
tions that results in an optimal fit to the available experimen-
tal data with minimal modifications to the original model, we
apply the gap filling reconciliation step of the model optimi-
zation procedure. In this step, we perform the following inte-
ger optimization that maximizes the correction of false
negative errors, minimizes the introduction of new false pos-
itive errors, and minimizes the net changes made to the
model:
Objective:
Subject to:
In the objective of the gap filling reconciliation formulation
(Equation 13), n
obs
and r
sol
are constants representing the
total number of experimental observations and the number of
unique component reactions involved in the gap filling solu-
tions, respectively;
λ
gapfill, i
and z
i
carry the same definitions as
in the gap filling formulation; and o
k
is a binary variable equal
to zero if observation k is expected to be correctly predicted
given the values of z
i
and equal to 1 otherwise.
The values of the o
k
variables are controlled by the constraints
defined in Equations 14 and 15. Equation 14 is written for any
experimental condition with a false negative prediction by the
original model. This constraint states that at least one gap fill-
ing solution that corrects this false negative prediction must
be implemented in order for this prediction error to be cor-
rected in the gap-filled model. Equation 15 is written for any
experimental condition where the original model correctly
predicts that zero growth will occur. This constraint states
that implementation of any gap filling solution that causes a
new false positive prediction for this condition will result in
an incorrect prediction by the gap-filled model. In these con-
straints, n
sol
is the total number of gap filling solutions;
ε
j, k
is
a binary constant equal to 1 if condition k is correctly pre-
dicted by solution j and equal to zero otherwise; s
j
is a binary
variable equal to 1 if gap filling solution j should be imple-
mented in the gap-filled model and equal to zero otherwise.
The final set of constraints for this formulation (Equation 16)
enforce the condition that a gap filling solution (represented
by the use variable s
j
) is not implemented in the gap-filled
model unless all of the reaction additions and modifications
(represented by the use variable z
i
) that constitute the solu-
tion have been implemented in the model. In these con-
straints,
γ
i, j
is a constant equal to 1 if reaction i is involved in
solution j and equal to zero otherwise.
Once again, recursive MILP was applied to identify multiple
equivalently optimal solutions to the gap filling reconciliation
problem, and each solution was validated against the com-
plete set of experimental data to ensure that the combination
of multiple gap filling solutions did not give rise to additional
false positive predictions. The solutions that resulted in the
Minimize 30
11
oz
k
k
n
gapfill i i
i
r
obs sol
==
∑∑
+
λ
,
(13)
osknvv
kjkj
j
n
obs bio in vivo k bio
sol
+−
()
()
≥= >
=
∑
111 0
1
ε
,,,,
,, | ,…
iin silico k ,
= 0
(14)
no s k n v v
sol k j k j
j
n
obs bio in vivo k bio
sol
−
()
≥= =
=
∑
ε
,,,,
,, | ,
1
01 0…
iin silico k ,
= 0
(15)
γγ
ij i
i
r
jij
i
r
sol
zs j n
sol sol
,,
,,
==
∑∑
−≥=
11
01…
(16)
Genome Biology 2009, Volume 10, Issue 6, Article R69 Henry et al. R69.12
Genome Biology 2009, 10:R69
most accurate prediction of growth in all experimental condi-
tions were manually curated to identify the most physiologi-
cally relevant solution. This solution was then implemented
in the original model to produce the gap-filled model.
Model optimization step three: gap generation
The gap-filled model produced by the gap filling reconcilia-
tion step not only will retain all of the false positive predic-
tions generated by the original model but also will generate a
small number of new false positive predictions that arise as a
result of additions and modifications made during the gap
filling process. In the gap generation step of the model opti-
mization procedure we attempt to correct these false positive
predictions either by removing irreversible reactions or by
converting reversible reactions into irreversible reactions.
For each simulated experimental condition with a false posi-
tive prediction by the gap-filled model, the following optimi-
zation was performed:
Objective:
Subject to:
The objective of the gap generation procedure (Equation 17)
is to minimize the number of component reactions that must
be removed from the model in order to eliminate biomass
production under conditions where the organism is known
not to produce biomass. As in the gap filling optimization, all
reversible reactions are decomposed into separate forward
and backward component reactions. This process enables the
independent removal of each direction of operation of the
reactions in the model. As a result, r
gapgen
in Equation 17 is
equal to the number of irreversible reactions plus twice the
number of reversible reactions in the gap-filled model; z
i
is a
binary use variable equal to 1 if the flux through component
reaction i is greater than zero and equal to zero otherwise;
λ
gapfill, i
is a constant representing the cost of removal of com-
ponent reaction i from the model.
λ
gapfill, i
is calculated using
Equation 28:
The P
irreversible, i
term in Equation 28 is a binary constant equal
to 1 if reaction i is irreversible and associated with at least one
gene in the model. This term exists to penalize the complete
removal of reactions from the model (as is done when remov-
ing one component of an irreversible reaction) over the
adjustment of the reversibility of a reaction in the model (as
is done when removing one component of a reversible reac-
tion).
Equations 18 and 19 represent the mass balance constraints
and flux bounds that simulate the experimental conditions
with false positive predictions. N
gapfilled
is the stoichiometric
matrix for the gap-filled model with the decomposed reversi-
ble reactions; v
no-growth
is the vector of fluxes through the
reactions under the false positive experimental conditions;
and v
max, no-growth, i
is the upper-bound on the flux through
reaction i set to simulate the false positive experimental con-
ditions.
Equations 20 and 21 define the dual constraints associated
with each flux in the primal FBA formulation. In these con-
straints,
σ
i, j
is the stoichiometric coefficient for metabolite j in
reaction i; m
j
is the dual variable associated with the mass bal-
ance constraint for metabolite j in the primal FBA formula-
tion;
μ
i
is the dual variable associated with the upper-bound
constraint on the flux through reaction i in the primal FBA
formulation; and K is a large constant selected such that the
Equation 20 and 21 constraints are always feasible when z
i
is
equal to zero. Equation 22 sets the dual slack variable associ-
ated with reaction i,
μ
i
, to zero when the use variable associ-
ated with component reaction i, z
i
, is equal to zero. Equation
22 and the term involving K in Equations 20 and 21 exist to
eliminate all dual constraints and variables associated with
Maximize
λ
gapgen i i
i
r
z
gapfilled
,
()
=
∑
1
(17)
Nv
gapfilled
•=
no growth
0
(18)
01≤≤=vvzir
no growth i Max i i gapfilled ,,
,,…
(19)
σμ
ij j
j
n
i i gapfilled
mKzKir i
gapfilled cpd
,
,, |
biomass
∑
+− ≥− = ≠1 … reaction
(20)
σμ
biomass j j
j
n
biomass
m
gapfilled cpd
,
∑
+≥1
(21)
01≤≤ =
μ
i i gapfilled
Kz i r,,…
(22)
vvu
biomass Max i i
i
r
gapfilled
−=
∑
,
0
(23)
v
bionogrowth,
= 0
(24)
Nv
gapfilled growth
•=0
(25)
01≤≤ =vv zir
growth i max growth i i gapfilled,,,
,,…
(26)
vgmgmCDWhr
bio growth
,
/
>
−
10
5
(27)
λ
gapgen i irreversible i
P
,,
=+1
(28)
Genome Biology 2009, Volume 10, Issue 6, Article R69 Henry et al. R69.13
Genome Biology 2009, 10:R69
component reaction i when component reaction i is flagged to
be removed by the gap generation optimization.
Equation 23 is the constraint that sets the original primal FBA
objective (maximization of biomass production) equal to the
dual FBA objective (minimization of flux slack). This con-
straint ensures that every set of v
no-growth
fluxes that satisfies
the constraints in Equations 20 to 23 represents an optimal
solution to the original FBA problem that maximizes biomass
production. Therefore, if the biomass flux is set to zero, as is
done in Equation 24, this is equivalent to stating that the
binary use variables z
i
must be set in such a way that the max-
imum production of biomass when simulating the false posi-
tive experimental conditions must be zero.
With no additional constraints, the gap generation optimiza-
tion would produce solutions recommending the knockout of
component reactions that cause the loss of biomass produc-
tion under every experimental condition instead of just the
false positive conditions. Constraints are required to ensure
that only solutions that eliminate biomass production under
the false positive conditions while preserving biomass pro-
duction in all other conditions will be feasible. These con-
straints are defined by Equations 25, 26, and 27, which
represent the FBA constraints simulating an experimental
condition where the organism being modeled is known to
grow. When the false positive condition being simulated by
the v
max, no-growth, i
values is the knockout of an essential gene
or interval, the v
max, growth, i
values in Equation 26 simulate the
same media conditions with no reactions knocked out. When
the false positive condition being simulated is an unviable
media, the v
max, growth, i
values simulate a viable media.
Because the binary z
i
variables are shared by the 'no growth'
and 'growth' FBA constraints, z
i
will be set to zero only for
those reactions that are not essential or coessential under the
'growth' conditions but are essential or coessential under the
'no growth conditions'. To further reduce the probability that
a gap generation solution will cause new false negative pre-
dictions, we identified the component reactions in the gap-
filled model that were essential for the correct prediction of
growth in at least three of the experimental conditions prior
to running the gap generation optimization. The z
i
variables
associated with these essential component reactions were
fixed at one to prevent their removal in the gap generation
optimization.
As done in previous steps, recursive MILP was used to iden-
tify up to ten equally optimal solutions that correct each false
positive prediction error in the gap-filled model. Each solu-
tion was implemented and validated against the complete set
of experimental data, and the accuracy of each solution was
tabulated into a matrix for use in the final step of the model
optimization procedure: gap generation reconciliation.
Model optimization step four: gap generation reconciliation
Like the gap filling step, the gap generation step of the model
optimization process produces multiple equally optimal solu-
tions to correct each false positive prediction in the gap-filled
model, and many of these solutions introduce new false neg-
ative prediction errors. To identify the cross-section of gap
generation solutions that results in the maximum correction
of false positive predictions with the minimum addition of
false negative predictions, we perform one final optimization
step: gap generation reconciliation. The optimization prob-
lem solved in the gap generation reconciliation step is identi-
cal to the gap filling reconciliation optimization except that
the constraints defined by Equations 14 and 15 are replaced
by the constraints defined by Equations 29 and 30:
Equation 29 is written for any experimental condition with a
false positive prediction by the gap-filled model. This con-
straint states that at least one gap generation solution that
corrects the false positive prediction must be implemented
for the condition to be correctly predicted by the optimized
model. Equation 30 is written for any experimental condition
where the original model correctly predicts that growth will
occur. This constraint states that implementation of any gap
generation solution that causes a new false positive prediction
will result in a new incorrect prediction by the optimized
model. All of the variables and constants used in Equations 29
and 30 have the same meaning as in Equations 14 and 15.
Although the objective, remaining constraints, and remaining
variables in the gap generation reconciliation are mathemati-
cally identical to the gap filling reconciliation, some variables
take on a different physiological meaning. Because gap gener-
ation solutions involve the removal (not the addition) of reac-
tions from the gap-filled model, the reaction use variable z
i
is
now equal to 1 if a reaction is to be removed from the gap-
filled model and equal to zero otherwise.
The gap generation reconciliation was solved repeatedly by
using recursive MILP to identify multiple solutions to the gap
generation reconciliation optimization, and each solution was
implemented in a test model and validated against the com-
plete set of experimental data. The solutions associated with
the most accurate test models were manually examined to
identify the most physiologically relevant solution. The
selected solution was then implemented in the gap-filled
model to produce the optimized iBsu1103 model.
osknvv
kjkj
j
n
obs bio in vivo k bio
sol
+−
()
()
≥= =
=
∑
111 0
1
ε
,,,,
,, | ,…
iin silico k ,
> 0
(29)
no s k n v v
sol k j k j
j
n
obs bio in vivo k bio
sol
−
()
≥= >
=
∑
ε
,,,,
,, | ,
1
01 0…
iin silico k ,
> 0
(30)
Genome Biology 2009, Volume 10, Issue 6, Article R69 Henry et al. R69.14
Genome Biology 2009, 10:R69
Abbreviations
Δ
f
G'°: standard Gibbs free energy change of formation; Δ
r
G'°:
standard Gibbs free energy change of reaction; Δ
r
G
'm
: milli-
molar Gibbs free energy change of reaction; : maxi-
mum Gibbs free energy change of reaction; : mini-
mum Gibbs free energy change of reaction; ACP: acyl-carrier-
protein; BOF: biomass objective function; CoA: coenzyme A;
CDW: cell dry weight; FBA: flux balance analysis; KEGG:
Kyoto Encyclopaedia of Genes and Genomes; LB: Luria-Ber-
tani; MILP: mixed integer linear programming.
Authors' contributions
CH, JZ, MC, and RS all participated in the reconstruction,
curation, and analysis of the iBsu1103 model. CH developed
the reaction reversibility prediction and model optimization
methods with direction and advice provided by RS. RS con-
ceived of the project and coordinated all research. CH wrote
the paper with revisions by JZ, MC, and RS. All authors read
and approved the final manuscript.
Additional data files
The following additional data are available with the online
version of this paper: an Excel file containing all supplemen-
tary data associated with the iBsu1103 model as Tables S1 to
S11 (Additional data file 1); a zip archive containing tab-
delimited text files for all of the supplementary tables
included in Additional data file 1 (Additional data file 2); a zip
archive containing data on the structure of every molecule in
the model in molfile format (Additional data file 3); an SBML
version of the model, which may be used with the published
COBRA toolbox [18] to run FBA on the model (Additional
data file 4).
Additional data file 1Tables S1 to S11Tables S1 and S2 contain all compound and reaction data associ-ated with the model, respectively; Table S3 lists all of the open problem reactions in the model; Table S4 lists all of the essential genes that have nonessential homologs in the B. subtilis genome; Table S5 lists all of the changes made to the model during the model optimization process; Table S6 lists the reactions in the Oh et al. model that are not in the iBsu1103 model; Table S7 shows simula-tion results for all 1,500 experimental conditions; Table S8 pro-vides the details on the media formulations used for each FBA simulation; and Tables S9, S10, and S11 show all data on the genes, functional roles, and subsystems in the B. subtilis SEED annota-tion.Click here for fileAdditional data file 2Tab-delimited text files for all of the supplementary tables included in Additional data file 1The text files may be copied into any spreadsheet program of choice to visualize the data for the iBsu1103 model.Click here for fileAdditional data file 3Data on the structure of every molecule in the model in molfile for-matThese molfiles reflect the structure of the predominant ionic form of the compounds at neutral pH as predicted using the Marvin-Beans software [28]. These structures were used with the group contribution method [40-42] to estimate the Δ
f
G'° and Δ
r
G'° for the compounds and reactions in the model.Click here for fileAdditional data file 4SBML version of the modelThis may be used with the published COBRA toolbox [18] to run FBA on the model.Click here for file
Acknowledgements
This work was supported in part by the US Department of Energy under
contract DE-ACO2-06CH11357. We thank Professor DeJongh for assist-
ance in curating the reaction-to-functional role mapping. We thank Profes-
sor Noirot for expert advice on B. subtilis behavior. We thank Dr Overbeek
and the entire SEED development team for advice and assistance in using
the SEED annotation system. We also thank Mindy Shi and Fangfang Xia for
technical support.
References
1. Zweers JC, Barak I, Becher D, Driessen AJ, Hecker M, Kontinen VP,
Saller MJ, Vavrova L, van Dijl JM: Towards the development of
Bacillus subtilis as a cell factory for membrane proteins and
protein complexes. Microb Cell Fact 2008, 7:10.
2. Fabret C, Ehrlich SD, Noirot P: A new mutation delivery system
for genome-scale approaches in Bacillus subtilis. Mol Microbiol
2002, 46:25-36.
3. Kobayashi K, Ehrlich SD, Albertini A, Amati G, Andersen KK, Arnaud
M, Asai K, Ashikaga S, Aymerich S, Bessieres P, Boland F, Brignell SC,
Bron S, Bunai K, Chapuis J, Christiansen LC, Danchin A, Debarbouille
M, Dervyn E, Deuerling E, Devine K, Devine SK, Dreesen O, Err-
ington J, Fillinger S, Foster SJ, Fujita Y, Galizzi A, Gardan R, Eschevins
C, et al.: Essential Bacillus subtilis genes. Proc Natl Acad Sci USA
2003, 100:4678-4683.
4. Morimoto T, Kadoya R, Endo K, Tohata M, Sawada K, Liu S, Ozawa
T, Kodama T, Kakeshita H, Kageyama Y, Manabe K, Kanaya S, Ara K,
Ozaki K, Ogasawara N: Enhanced recombinant protein produc-
tivity by genome reduction in Bacillus subtilis. DNA Res 2008,
15:73-81.
5. Fischer E, Sauer U: Large-scale in vivo flux analysis shows rigid-
ity and suboptimal performance of Bacillus subtilis metabo-
lism. Nat Genet 2005, 37:636-640.
6. Bochner BR: Global phenotypic characterization of bacteria.
Fems Microbiol Rev 2009, 33:191-205.
7. Oh YK, Palsson BO, Park SM, Schilling CH, Mahadevan R: Genome-
scale reconstruction of metabolic network in Bacillus subtilis
based on high-throughput phenotyping and gene essentiality
data. J Biol Chem 2007, 282:28791-28799.
8. Burgard AP, Maranas CD: Probing the performance limits of the
Escherichia coli metabolic network subject to gene additions
or deletions. Biotechnol Bioeng 2001, 74:364-375.
9. Edwards JS, Palsson BO: Robustness analysis of the Escherichia
coli metabolic network.
Biotechnol Prog 2000, 16:927-939.
10. Edwards JS, Ibarra RU, Palsson BO: In silico predictions of
Escherichia coli metabolic capabilities are consistent with
experimental data. Nat Biotechnol 2001, 19:125-130.
11. Mahadevan R, Edwards JS, Doyle FJ 3rd: Dynamic flux balance
analysis of diauxic growth in Escherichia coli. Biophys J 2002,
83:1331-1340.
12. Goelzer A, Bekkal Brikci F, Martin-Verstraete I, Noirot P, Bessieres
P, Aymerich S, Fromion V: Reconstruction and analysis of the
genetic and metabolic regulatory networks of the central
metabolism of Bacillus subtilis. BMC Syst Biol 2008, 2:20.
13. Kanehisa M, Goto S: KEGG: Kyoto encyclopedia of genes and
genomes. Nucleic Acids Res 2000, 28:27-30.
14. Kanehisa M, Goto S, Kawashima S, Nakaya A: The KEGG data-
bases at GenomeNet. Nucleic Acids Res 2002, 30:42-46.
15. Overbeek R, Disz T, Stevens R: The SEED: A peer-to-peer envi-
ronment for genome annotation. Commun ACM 2004, 47:46-51.
16. Aziz RK, Bartels D, Best AA, DeJongh M, Disz T, Edwards RA,
Formsma K, Gerdes S, Glass EM, Kubal M, Meyer F, Olsen GJ, Olson
R, Osterman AL, Overbeek RA, McNeil LK, Paarmann D, Paczian T,
Parrello B, Pusch GD, Reich C, Stevens R, Vassieva O, Vonstein V,
Wilke A, Zagnitko O: The RAST Server: rapid annotations
using subsystems technology. BMC Genomics 2008, 9:75.
17. Seed Viewer [ />18. Jankowski MD, Henry CS, Broadbelt LJ, Hatzimanikatis V: Group
contribution method for thermodynamic analysis of com-
plex metabolic networks. Biophys J 2008, 95:1487-1499.
19. Henry CS, Jankowski MD, Broadbelt LJ, Hatzimanikatis V: Genome-
scale thermodynamic analysis of Escherichia coli metabolism.
Biophys J 2006,
90:1453-1461.
20. Feist AM, Henry CS, Reed JL, Krummenacker M, Joyce AR, Karp PD,
Broadbelt LJ, Hatzimanikatis V, Palsson BØ: A genome-scale met-
abolic reconstruction for Escherichia coli K-12 MG1655 that
accounts for 1261 ORFs and thermodynamic information.
Mol Syst Biol 2007, 3:121.
21. Kummel A, Panke S, Heinemann M: Systematic assignment of
thermodynamic constraints in metabolic network models.
BMC Bioinformatics 2006, 7:512.
22. Kummel A, Panke S, Heinemann M: Putative regulatory sites
unraveled by network-embedded thermodynamic analysis of
metabolome data. Mol Syst Biol 2006, 2:. 2006.0034.
23. Henry CS, Broadbelt LJ, Hatzimanikatis V: Thermodynamics-
based metabolic flux analysis. Biophys J 2007, 92:1792-1805.
24. Beard DA, Qian H: Thermodynamic-based computational pro-
filing of cellular regulatory control in hepatocyte metabo-
lism. Am J Physiol Endocrinol Metab 2005, 288:E633-E644.
25. Kumar VS, Maranas CD: GrowMatch: an automated method for
reconciling in silico/in vivo growth predictions. PLoS Comput Biol
2009, 5:e1000308.
26. DeJongh M, Formsma K, Boillot P, Gould J, Rycenga M, Best A:
Toward the automated generation of genome-scale meta-
bolic networks in the SEED. BMC Bioinformatics 2007, 8:139.
27. Reed JL, Vo TD, Schilling CH, Palsson BO: An expanded genome-
scale model of Escherichia coli K-12 (iJR904 GSM/GPR).
Genome Biol 2003, 4:R54.
28. The Marvin Family [ />marvin_land.html]
29. Dauner M, Sauer U: Stoichiometric growth model for ribofla-
Δ
r
G
max
’
Δ
r
G
min
’
Genome Biology 2009, Volume 10, Issue 6, Article R69 Henry et al. R69.15
Genome Biology 2009, 10:R69
vin-producing Bacillus subtilis. Biotechnol Bioeng 2001,
76:132-143.
30. Sauer U, Hatzimanikatis V, Hohmann HP, Manneberg M, van Loon AP,
Bailey JE: Physiology and metabolic fluxes of wild-type and
riboflavin-producing Bacillus subtilis. Appl Environ Microbiol 1996,
62:3687-3696.
31. Matsumoto K, Okada M, Horikoshi Y, Matsuzaki H, Kishi T, Itaya M,
Shibuya I: Cloning, sequencing, and disruption of the Bacillus
subtilis psd gene coding for phosphatidylserine decarboxy-
lase. J Bacteriol 1998, 180:100-106.
32. Sonenshein AL, Hoch JA, Losick R: Bacillus subtilis and its Closest Rela-
tives: from Genes to Cells Washington, DC: ASM Press; 2002.
33. Soga T, Ohashi Y, Ueno Y, Naraoka H, Tomita M, Nishioka T: Quan-
titative metabolome analysis using capillary electrophoresis
mass spectrometry. J Proteome Res 2003, 2:488-494.
34. Suthers PF, Dasika MS, Kumar VS, Denisov G, Glass JI, Maranas CD:
A genome-scale metabolic reconstruction of Mycoplasma
genitalium, iPS189. PLoS Comput Biol 2009, 5:e1000285.
35. DeJongh M, Formsma K, Boillot P, Gould J, Rycenga M, Best A:
Toward the automated generation of genome-scale meta-
bolic networks in the SEED. BMC Bioinformatics 2007, 8:139.
36. Papoutsakis ET, Meyer CL: Equations and calculations of prod-
uct yields and preferred pathways for butanediol and mixed-
acid fermentations. Biotechnol Bioeng 1985, 27:50-66.
37. Jin YS, Jeffries TW: Stoichiometric network constraints on
xylose metabolism by recombinant Saccharomyces cerevisiae.
Metab Eng 2004, 6:229-238.
38. Varma A, Palsson BO: Stoichiometric flux balance models
quantitatively predict growth and metabolic by-product
secretion in wild-type Escherichia-coli W3110. Appl Environ
Microbiol 1994,
60:3724-3731.
39. Varma A, Palsson BO: Metabolic capabilities of Escherichia-coli.
2. Optimal-growth patterns. J Theoret Biol 1993, 165:503-522.
40. Jankowski MD, Henry CS, Broadbelt LJ, Hatzimanikatis V: Group
contribution method for thermodynamic analysis on a
genome-scale. Biophys J 2008, 95:1487-1499.
41. Mavrovouniotis ML: Group contributions for estimating stand-
ard Gibbs energies of formation of biochemical-compounds
in aqueous-solution. Biotechnol Bioeng 1990, 36:1070-1082.
42. Mavrovouniotis ML: Estimation of standard Gibbs energy
changes of biotransformations. J Biol Chem 1991,
266:14440-14445.
43. Satish Kumar V, Dasika MS, Maranas CD: Optimization based
automated curation of metabolic reconstructions. BMC Bioin-
formatics 2007, 8:212.
44. Feist AM, Scholten JC, Palsson BO, Brockman FJ, Ideker T: Modeling
methanogenesis with a genome-scale metabolic reconstruc-
tion of Methanosarcina barkeri. Mol Syst Biol 2006, 2:. 2006.0004.
45. Oliveira AP, Nielsen J, Forster J: Modeling Lactococcus lactis using
a genome-scale flux model. BMC Microbiol 2005, 5:39.
46. Duarte NC, Herrgard MJ, Palsson BO: Reconstruction and valida-
tion of Saccharomyces cerevisiae iND750, a fully compart-
mentalized genome-scale metabolic model. Genome Res 2004,
14:1298-1309.
47. Becker SA, Palsson BO: Genome-scale reconstruction of the
metabolic network in Staphylococcus aureus N315: an initial
draft to the two-dimensional annotation. BMC Microbiol 2005,
5:8.
48. Jamshidi N, Palsson BO: Investigating the metabolic capabilities
of Mycobacterium tuberculosis H37Rv using the in silico
strain
iNJ661 and proposing alternative drug targets. BMC Syst Biol
2007, 1:26.
49. Thiele I, Vo TD, Price ND, Palsson BO: Expanded metabolic
reconstruction of Helicobacter pylori (iIT341 GSM/GPR): an
in silico genome-scale characterization of single- and double-
deletion mutants. J Bacteriol 2005, 187:5818-5830.
50. Lee S, Phalakornkule C, Domach MM, Grossmann IE: Recursive
MILP model for finding all the alternate optima in LP models
for metabolic networks. Computers Chem Eng 2000, 24:711-716.