assessing financial vulnerability an early warning system for emerging markets phần 10 pptx
Bạn đang xem bản rút gọn của tài liệu. Xem và tải ngay bản đầy đủ của tài liệu tại đây (149.28 KB, 13 trang )
SUMMARY OF RESULTS AND CONCLUDING REMARKS 101
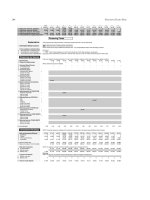
Table 8.3 Country rankings of vulnerability to banking crises for
two periods
a
January 1996-June 1997 January 1996-December 1997
Experienced Experienced
Country Rank crisis
b
Country Rank crisis
b
Most vulnerable
Czech Republic 1 Czech Republic 1
South Korea 2 * South Korea 2 *
Greece 3 Thailand 3 *
South Africa 4 South Africa 4
Thailand 5 * Colombia 5 *
Least vulnerable
Venezuela 15 Chile 16
Chile 16 Argentina 17
Peru 17 Venezuela 18
Uruguay 18 Peru 19
Mexico 19 Uruguay 20
a. Weighted index is a sum of the weighted signals flashing at any time during the specified
period. Monthly and annual indicators are included. Weights are equal to the inverse noise-
to-signal ratios of the respective indicators.
b. An asterisk (*) indicates that the country experienced a crisis during the out-of-sample
period.
Turning to banking crises, the ordinal rankings of country vulnerability
again are quite similar across the two out-of-sample periods, although
the correspondence is slightly lower than was the case for currency crises:
four of the five countries estimated to be most vulnerable to banking
crises are the same across the two periods. Specifically, for the 1996 to
mid-1997 period, the five most vulnerable countries (again in descending
order) were Czech Republic, South Korea, Greece, South Africa, and Thai-
land (table 8.3). When the out-of-sample period is extended through the
end of 1997, Greece drops out of the top five and is replaced by Colombia.
As with the vulnerability rankings for currency crises, it is useful to
ask which of the countries estimated to be most vulnerable to banking
crises actually suffered that fate during the out-of-sample periods. As
suggested earlier, this is intrinsically a tougher question to answer for
banking crises than for currency crises because the identification and
dating of crises are subject to wider margins of error. Recall also that
because our 24-month early warning window for banking crises covers
both the 12-month period preceding the beginning of the crisis as well
as the 12-month period following the onset, successful predictions would
include some crises that began toward the end of 1995 and some that
started no later than early1998(as well as those that began in 1996 or 1997).
With these caveats in mind, the picture painted by table 8.3 can be
summarized as follows.Of the five countriesestimated to be most vulnera-
Institute for International Economics |
102 ASSESSING FINANCIAL VULNERABILITY
ble during January 1996 to the end of June 1997, two experienced banking
crises that fall in our prediction window. Specifically, we consider South
Korea’s banking crisis to have begun in January 1997, with the loan losses
stemming from the bankruptcy of Hanbo Steel. In a similar vein, we date
Thailand’s banking crisis as starting in May 1996, when the Ministry of
Finance took control of Bangkok Bank of Finance (following a run on
deposits). A thirdmember of the most vulnerablegroup, the Czech Repub-
lic, also experienced a banking crisis although the timing is not clear-cut.
The start of the Czech crisis could be dated in August 1996, reflecting the
closure of Kreditni Banka; alternatively, one could also defend a much
earlier starting date, namely September 1993, when Kreditni was initially
placed under supervision.
7
Some researchers (e.g., Kaminsky and Reinhart
1999) also classify Malaysia and the Philippines as having registered
banking crises in 1997. The results for the longer out-of-sample period,
shown in the upper panel of table 8.3, are quite similar: the same three
countries (South Korea, Thailand, and Czech Republic) make up the list
of successful banking-crisis predictions. For the more recent sample,
Colombia is also added to the list of successful predictions. In April 1998
the bailout by Banco de la Republica of several finance companies facing
severe difficulties with mounting losses in their loan portfolios intensified
in earnest, and banking sector problems deepened throughout 1998-99.
What about the group of countries estimated to be least vulnerable to
banking crises? As seen in the lower panel of table 8.3, four of the five
countries in this category are common to both sample periods: Uruguay,
Venezuela, Peru, and Chile. Mexico appears only in the shorter period,
while Argentina makes the least vulnerable list only in the longer period.
For all five of the countries estimated to be least vulnerable, no banking
crisis appears to have taken place during the out-of-sample periods. As
was the case with the forecasting of currency crises, Indonesia (which is
ranked 11 or 12, depending on the sample chosen) emerges as a major
misclassification, although timing problems somewhat cloud the issue.
Many observers would regard the severity of Indonesia’s financial sector
problems in 1997 as constituting a ‘‘new’’ banking crisis; others might
argue that these difficulties constituted a continuation of the banking
problems that began in 1992 with the collapse of Bank Summa. In any case,
it is clear that the model was not picking up the increase in Indonesia’s
vulnerability in 1997. Mexico presents another timing problem. Mexico
remained in the throes of a banking crisis throughout the out-of-sample
period and thus could be classified as highly vulnerable. At the same
time, most studies (e.g., Demirgu
¨
c
¸
-Kunt and Detragiache 1998; IMF 1998b)
regard the Mexican banking crisis as having started at least as early as
7. The Czech banking crisis was not included in our in-sample test, and hence the model
is not calibrated to account for this crisis.
Institute for International Economics |
SUMMARY OF RESULTS AND CONCLUDING REMARKS 103
1994. Here, too, the model seems to have difficulty in identifying changes
in vulnerability when they occur in the context of continuing banking
problems.
Looking at both the high and low vulnerability groups, it is clear that
the early warning model is less successful out of sample in anticipating
banking crises than it is in anticipating currency crises. The problem is
not so much that the model misses many banking crises that do occur
but rather that it generates too many false positives or ‘‘noise,’’—that is,
it predicts more cases of banking crisis vulnerability than actually occur.
In this connection, it is worth noting that we classify only five or six
episodes as meeting our criteria for a banking crisis during the out-of-
sample period (that is, the period running roughly from late 1995 to early
1998). This list comprises South Korea, Thailand, the Czech Republic,
Indonesia, and Malaysia.
8
Of these five crisis cases, three of the countries
concerned (South Korea, Thailand, and the Czech Republic) were mem-
bers of our ‘‘most vulnerable’’ group.
9
This might be considered fair
performance. Difficulties in forecasting Asian banking crises in 1997 seem
to be common to the leading forecasting models—be they signals
approach models or regression-based models. For example, Demirgu
¨
c
¸
-
Kunt and Detragiache (1998), using a multivariate logit model, report that
the conditional probabilities for banking crises in the five most adversely
affected Asian economies were actually below the unconditional crisis
probabilities (Furman and Stiglitz 1998). Similarly, Kaminsky (1998) finds
that estimated crisis probabilities were rising sharply in the case of the
Thai banking crisis and moderately in the case of the Philippines, but not
for either Malaysia or Indonesia.
We conducted a number of experiments, which are described in chapter
5, to help gauge the robustness of our results on the ordinal ranking of
country vulnerability to currency and banking crises. In one exercise,
instead of basingthe ordinal vulnerability rankings exclusivelyon weights
derived from the noise-to-signal ratios,we looked atboth the proportionof
indicators signaling a crisis and the proportion of the top eight indicators
signaling a crisis. In another exercise, we looked at various indicators
signaling both banking and currency crises and calculated ‘‘average’’
vulnerability to banking and currency crises combined. And in yet another
set of exercises, we liberalized the optimal thresholds for each of the
indicators by 5 percent, thereby making it less likely that we would miss
crises that were unfolding, albeit at the cost of predicting crises that never
8. The Malaysian crisis would probably best be regarded as beginning in March 1998,
when the central bank announced losses at Sime Bank and elsewhere and when Malaysian
President Datuk Seri Mahathir bin Mohamad pledged state funds to prop up weak
institutions.
9. Malaysia was ranked fourteenth (out of 25 countries) in the shorter period and tenth in
the longer one.
Institute for International Economics |
104 ASSESSING FINANCIAL VULNERABILITY
occurred. While these robustness exercises not surprisingly generated
some changes in the ordinal rankings, perhaps the most important finding
was that the same ‘‘core’’ set of vulnerable countries—the Czech Republic,
South Korea, South Africa, Greece, Colombia, Thailand, the Philippines,
and Malaysia—consistently remained in the top tier of the vulnerability
list. It isalso noteworthy that noneof these sensitivity exercisesanticipated
the Indonesian crisis.
All in all, we regard the out-of-sample performance of the signals
approach as encouraging— particularly as regards anticipating currency
crises in the Asian crisis countries.
10
With the exception of Indonesia,
the model did well in identifying thecountries with relatively high vulner-
ability. In addition, the model gave strong signals for Brazil, the Czech
Republic, South Africa, and Colombia, which also experienced crises (or
turbulence) outside the Asian region. The results for banking crises were
less impressive. While we would not place much confidence in the precise
estimated ordering of vulnerability across countries, we think the signals
approach looks promising for making distinctions between the vulnerabil-
ity of countries near the top of the list and those near the bottom—that
is, it may be useful as a ‘‘first screen,’’ which can then be followed by
more in-depth country analysis.
Some others are pessimistic about both the potential and actual out-of-
sample performance of signals-based leading-indicator models of cur-
rency crises, including their track record in anticipating the Asian financial
crisis.
11
They argue that when such models do perform seemingly well,
it is often because they rely on ‘‘black box’’ simple contagion variables
(for example, the number of crises that have occurred in the previous
period), that the methodology embedded in the signals approach is biased
toward overpredicting crises in countries with good histories and this
explains its successes in predicting currency crises in Asia, and that both
in-sample and out-of-sample performance would be better if the good
indicator variables were entered linearly (rather than sending a signal
only when the indicator crossed its threshold) and if the weights on the
individual indicators were estimated by a regression (rather than selected
from an iterative noise-to-signal test one at a time). These critics also
argue that the correlation between the severity of observed currency crises
and crisis vulnerability predicted by the signals approach was low (at
least in 1996) and that (also in 1996) there did not seem to be a marked
distinction between the calculated currency crisis vulnerabilities of several
10. This is consistent with the results of a recent IMF study (Berg and Pattillo 1999), which
found that the signals model of Kaminsky, Lizondo, and Reinhart (1998) did a better job
of predicting the Asian crisis than the models of Frankel and Rose (1996) and of Sachs,
Tornell, and Velasco (1996).
11. See Berg and Pattillo (1999), The Economist (1998), Furman and Stiglitz (1998), IMF
(1998c), and Wyplosz (1997, 1998).
Institute for International Economics |
SUMMARY OF RESULTS AND CONCLUDING REMARKS 105
noncrisis countries (particularly Argentina and Mexico) and the Asian
crisis countries (Thailand and Indonesia). Further, they find that leading-
indicator models have poor in-sample performance in forecasting cur-
rency crises for developing countries, especially in emitting Type II errors
(false positives) andthat publication of a vulnerability index could precipi-
tate a crisis. We do not find these criticisms to be persuasive.
In the two studies (Berg and Pattillo 1999; Furman and Stiglitz 1998)
that have explicitly run out-of-sample horse races between the Kaminsky-
Reinhart signals model and two other regression-based models of cur-
rency crises (Frankel and Rose 1996; Sachs, Tornell, and Velasco 1997),
both concluded that the signals approach does better.
Wyplosz (1998) bases his pessimistic conclusions on the in-sample per-
formance of leading-indicator models of currency crises in developing
countries using the Frankel and Rose (1996) model—not the Kaminsky-
Reinhart signals approach. Using an abbreviated search technique for the
optimal threshold for various indicators, Wyplosz finds that (using a 5
percent threshold) 62 of 86 currency crises are detected, while the model
signals wrongly—that is, emits false positives—in 43 percent of the crises.
Our results are more favorable than Wyplosz’s for developing-country
currency crises (in-sample). Out of sample, we find that the false positives
problem is more serious for the banking crises than for currency crises.
While we present some new results on cross-country contagion in chap-
ter 6, the out-of-sample results—both in earlier Kaminsky-Reinhart stud-
ies and in this book—do not rely at all on cross-country contagion; instead,
they reflect only own-country fundamentals.
There is (at least to our knowledge) no empirical evidence to support
the view that imposing a common absolute threshold for indicator variables
would produce better in-sample and out-of-sample performance than our
procedure of imposing a common percentile threshold and allowing the
absolute threshold to differ across countries. Nor, as we have argued earlier,
does it seem more reasonable on a priori grounds to impose the one-size-
fits-all restriction on countries with different histories—quite the contrary.
As for the alleged influence of our procedure in the context of forecasting
the Asian financial crisis, one would have thought that if this bias were
large, it might have led to a very successful prediction of crises in the Asian
countries, yet some of these same critics find that the signals approach does
very poorly in forecasting currency crises in these countries.
While more work is clearly needed to assess the robustness of the results
to different out-of-sample periods (since these differ and seem to generate
different outcomes across studies), we do not find that there was little
distinction in estimatedcurrency-crisis vulnerabilities between most ofthe
Asian crisis countries, on the one hand, and some other (Latin American)
noncrisis countries, on the other. As indicated earlier, we found that
Thailand, the Philippines, and Malaysia had higher estimated currency-
Institute for International Economics |
106 ASSESSING FINANCIAL VULNERABILITY
crisis probabilities in 1996-97 than did Argentina and Mexico—not the
other way around. Thailand was near the top of our vulnerability list—
not near thebottom. Also, it isnot obvious that out-of-sample comparisons
based on the severity of crises are more meaningful than those (as above)
that concentrate on the crisis/no crisis distinction.
In short, just as we emphasized that it is important not to oversell the
potential of early warning models to predict crises in emerging economies,
we think some of the critics are too quick to dismiss the usefulness of
these models because of a mixed out-of-sample performance based on
runs from a single period. We should also keep in mind the apparent
inability of non-model-based forecasts to foresee the Asian crisis. In our
view, much more empirical work will need to be done before we can
draw reliable conclusions on the out-of-sample performance of the sig-
nals approach.
Examining a somewhat more limited sample (20) of small developed
and emerging economies over the 1970-98 period, we looked for patterns
in the cross-country contagion of currency crises. Following Eichengreen,
Rose, and Wyplosz (1996), we define contagion as a case in which the
presence of a crisis elsewhere increases the probability of crisis at home,
even when the fundamentals have been taken into account. We considered
four channels through which shocks can be transmitted across borders:
two dealt with trade links (bilateral trade flows and trade competition
in third-country markets) and two channels addressed financial links
(correlation of asset returns in global portfolios and reliance on a common
bank lender). We also demonstrated how these four contagion channels
could be combined and weighted appropriately to form a ‘‘contagion
vulnerability index.’’
This exercise led us to our tenth main finding: that cross-country conta-
gion adds significantly to own-country fundamentals in furthering an
understanding of emerging market vulnerability to financial crises and
that (at least historically) contagion has operated more along regional
than global lines. According to our contagion vulnerability index, Brazil,
Argentina, and the Philippines had high vulnerability to the 1994 Mexican
peso crisis; Malaysia, South Korea, and Indonesia had high vulnerability
to the 1997 Thai crisis; and Argentina, Chile, and Uruguay had high
vulnerability to the 1999 Brazilian crisis. Although it is difficult to separate
financial contagion channels from trade channels (since countries linked
in trade also are linked in finance) we concluded that withdrawal of a
common bank lender (particularly Japanese banks) and high correlation
of asset returns were important in the contagion in Asia in 1997-98.
Eleventh, in addition to studying the antecedents of crises we also
drew on our data base for information on the aftermath of crises—with
particular attention to the speed with which emerging economies return
to ‘‘normal’’ after a currency or banking crises. We defined normal in
Institute for International Economics |
SUMMARY OF RESULTS AND CONCLUDING REMARKS 107
two alternative ways: first, as a period of ‘‘tranquility’’ that excludes not
only the crisis years but also the two- to three-year windows before
and after the crisis, and second, as the average of the two years just
preceding crises.
12
One of our most robust findings was that the deleterious effects on
economic activity are more lingering for banking crises than for cur-
rency crises.
13
For example, whereas it took about two years for economic
growth to return to the average of the two precrisis years after a currency
crisis, that recovery was not evident even three years after a banking
crisis. One possible explanation for this difference is that, whereas a
currency crisis sharply reduces external sources of funding, a banking
crisis curtails access to both external and domestic sources of finance for
households and firms—that is, the ‘‘credit crunch’’ is more severe in the
wake of banking crises. This more sluggish recovery pattern for banking
crises was also evident for exports, imports, and stock prices. For instance,
whereas exports recover relatively quickly (eight months) and ahead of
the rest of the economy following currency crises, they continue to sink
for two years following theonset of a bankingcrisis. Two other dimensions
of the protracted nature of banking crises are that it takes about three to
four years for a banking crisis to be resolved and it takes on the order of
a year and half between the onset of a banking crisis and its peak. All of
this highlights the challenge faced by the Asian crisis countries in sustain-
ing their recoveries: not only did the most affected countries in emerging
Asia suffer from currency crises that were accompanied by banking crises
(what Kaminsky and Reinhart 1999 dub ‘‘twin crises’’), but the banking
crises themselves are very severe.
Our analysis of the aftermath of crises does not lend support to the
notion that devaluations in emerging economies generate deflation.
Instead, we find that devaluations are inflationary, that the pass-through
to prices is incomplete (hence, devaluations lead to real depreciations),
and that it takes between two and three years after a devaluation for
inflation to return to the average of the two precrisis years.
Last but not least, we offer a number of suggestions for improving
early warning models of currency and banking crises. In our view, four
directions for future research merit priority.
As hinted above, more work needs to be done to determine the out-
of-sample forecasting properties of these models—be it signals approach
models or regression-based logit or probit models. In particular, it would
be useful to know how robust ‘‘who’s next’’ country rankings of vulnera-
12. Morespecifically, the ‘‘tranquil’’ period excludes the 24 months beforeand after currency
crises and the 24 months before and 36 months after banking crises.
13. In the cases where currency and banking crises coincide, the postcrisis performance
would show up inboth the averages forcurrencyand banking crises. Seechapter 7 for details.
Institute for International Economics |
108 ASSESSING FINANCIAL VULNERABILITY
bility are in the face of changes in the forecasting period, different compos-
ite indicators, different definitions and transformations of the indicator
variables (e.g., alternative definitions of the effective real exchange rate
or of real exchange rate ‘‘misalignments,’’ and alternative ways of dating
banking crises or selecting the early warning ‘‘window’’), and the restric-
tions imposed in the different models (e.g., imposing thresholds versus
allowing indicators to enter linearly, imposing absolute thresholds versus
common percentile ones). It may turn out, as suggested by Berg and
Pattillo (1999), that combining certain features of the signals approach
and the regression-based models would improve forecasting (e.g., using
the signals approach to select the good indicators and then estimating
the weights and crisis probabilities using a regression-based format).
We think there is scope to bring other indicators into these horse races.
For example, Kaminsky (1998) has found that the share of short-term debt
in total foreign debt, as well as a proxy for capital flight (by residents of
emerging economies), do quite well in anticipating currency and banking
crises within the sample. Looking at the run-up to the Asian financial
crisis, Furman and Stiglitz (1998) likewise make a good case for including
the ratio of short-term external debt to international reserves as an indica-
tor in future early warning exercises. If monthly data could be obtained
both on real property prices and on the exposure of the banking system
to property, those too could prove very helpful.
A plausible extension would be to bring institutional characteristics of
weak banking systems into the forecasting of banking crises. There is a
strong presumption that the following all matter for vulnerability to
banking crises: weak accounting, provisioning, and legal frameworks;
policy-directed lending; the ownership structure of the banking system
(government ownership, foreign ownership, and so on); the incidence of
connected lending; the extent of diversification; the quality of banking
supervision; and the incentive-compatibility of the official safety net. Yet
it is only very recently that any of these factors have begun to enter the
empirical literature.
14
The main constraint on making use of these institutional characteristics
is that one cannot get high-frequency measurements of them. Indeed, for
some of these characteristics (e.g., the share of government ownership),
it has proved difficult to get even annual data that is less than two or
three years old. This means that such variables have to be introduced as
zero-one dummy variables in a time-series context. There would be more
scope to take advantage of such factors in cross-section work—that is, in
explaining cross-country differences in the incidence of banking crises
over long periods.
14. See, for example, Demirgu
¨
c
¸
-Kunt and Detragiache (1998), who introduce law enforce-
ment and deposit-insurance variables into their banking crisis model.
Institute for International Economics |
SUMMARY OF RESULTS AND CONCLUDING REMARKS 109
Lastly, we think the ongoing work on modeling the nature of cross-
country contagion of crises should be extended. One of the lessons of the
last few major crises (that is, the Mexican crisis and the Asian/global
financial crisis) is that the channels of cross-country contagion are more
numerous and complicated than we thought earlier. Each of these factors
seem to play a part in contagion: trade links (bilateral and third party),
perceived similarities in macroeconomic and financial vulnerability, the
dynamics of competitive devaluations, induced effects on primary com-
modity prices, financial links operating via withdrawal of a common bank
or mutual fund lender, liquidity and margin-call effects operating via the
regulatory framework, and perceived changes in the rescheduling cum
capital-account convertibility regime (such as took place after the Russian
unilateral rescheduling/default in August1998 and the Malaysian imposi-
tion of wide-ranging capital controls). Weneed to find ways to incorporate
more of these channels of contagion in our forecasting models.
Would the Publication of the Indicators Erode
Their Early Warning Role?
It is sometimes argued that if the indices of crisis vulnerability were made
publicly available on a timely basis, such publication could prompt a self-
fulfilling run on a country’s currency or its banks. Alternatively, it is
sometimes asserted that if countries really paid heed to the message of
the indicators and took preemptive action, then the indicators would
lose predictive power. This latter outcome would, of course, be highly
desirable. While neither of these arguments can be dismissed lightly, we
would regard both as exaggerated.
The conditions for generating this type of self-fulfilling runs are likely
to be relatively rare. As we have stressed throughout this book, the signals
approach is useful in identifying cases of high vulnerability to crises.
Explaining the precise timing of the crises remains an elusive goal. To
the extent that timing matters and that investment decisions are made
under uncertainty, there is little reasonto expect that moderate increases in
the extent of vulnerability are likelyto be sufficient to prompt a speculative
attack. As argued earlier, negative announcements of the readings in the
leading indicator index of business cycles—which have been published
for many years—do not cause a recession, although investors certainly
take these readings into account.
By the same token, we think it unlikely that publication would cause
the indicators to lose most of their predictive ability. This could certainly
occur if preemptive policy was an everytime, everywhere phenomenon
and if such preemptive policies were in fact successful in staving off
crises. These are strong assumptions. All too often, policymakers are
inclined to ignore distress signals on the grounds that, this time, the
situation is really different or that there are overriding political objectives
Institute for International Economics |
110 ASSESSING FINANCIAL VULNERABILITY
against corrective action. Furthermore, even if the signals are heeded and
corrective policy actions are taken, they may not be sufficient to prevent
the crisis. If the feedback from the indicators to corrective policy action
were strong and consistent, we would not have been able to identify
useful indicators in the first place. Of course, one could always speculate
that future policymakers will be wiser than their predecessors, but that
remains to be seen.
Do the Better Performing Indicators Carry
Policy Implications?
The empirical evidence presented in this book can be seen as supporting
the case for including leading indicators in the analytical tool kit for
diagnosing crisis vulnerability. But can one go farther and draw policy
implications from the performance of the better univariate indicators?
One should recall that the signals approach outlined in this book and
in earlier works by Kaminsky and Reinhart looks for empirical regularities
in the behavior of macroeconomic and financial variables in the run-up
to currency and banking crises. We thus cannot fully identify from this
exercise the channels by which policies affect economic outcomes.
For some of the indicators, the results have clear implications for macro-
economic and exchange rate policies; for others there is no obvious link.
For example, the performance of M2/reserves as an indicator of currency
crises is suggestive of the desirability of avoiding large discrepancies
between liquid liabilities and liquid assets. In this regard, the policy
implication would be to encourage emerging market countries to maintain
high liquidity ratios, prearranged lines of credit, and an ample stock of
reserves. Much of the behavior of other indicators, notably rising real
interest rates and money multipliers, are associated with financial liberal-
ization. Indeed, the reliability of these indicators in anticipating banking
crises may warn against hasty liberalizations. On the other hand, real
exchange rate overvaluations are an important indicator of both currency
and banking crises, but the burning policy question that remains unan-
swered is how emerging market countries can avoid these costly periodic
overvaluations. Real exchange rate targeting has been tried by countries
as diverse as Brazil, Chile, Indonesia, and Colombia, but the outcomes
were quite dissimilar—particularly as regards their consequences for
inflation.
15
In the case of some other indicators, such as stock prices, the
policy implications are even less obvious.
In short, while we regard the empirical work on early warning indica-
tors as consistent with many stories of the origins of currency and banking
crises, one has to be careful not to overinterpret the results, as alternative
explanations of crises often yield observationally equivalent implications.
15. Calvo, Reinhart and Ve
´
gh (1995) present empirical evidence on this issue.
Institute for International Economics |
111
Appendix
Data and Definitions
Currency Crisis Index
The index is a weighted average of exchange rate and reserve changes,
with weights such that the two components of the index have equal
conditional volatilities. Since changes in the exchange rate enter with a
positive weight and changes in reserves have a negative weight attached,
readings of this index that were three standard deviations or more above
the mean were cataloged as crises. For countries in the sample that had
hyperinflation, the construction of the index was modified. While a 100
percent devaluation may be traumatic for a country with low to moderate
inflation, a devaluation of that magnitude is commonplace during hyper-
inflations. A single index forthe countries thathad hyperinflation episodes
would miss sizable devaluations and reserve losses in the moderate infla-
tion periods, as thehistoric mean is distorted by the high-inflation episode.
To avoid this, we divided the sample according to whether inflation in
the previous six months was higher than 150 percent and then constructed
an index for each subsample. Our cataloging of crises for these countries
coincides fairly tightly with our chronology of currency market disrup-
tions. Eichengreen, Rose, and Wyplosz (1995) also include interest rates
in this index; however, our data on market-determined interest rates for
developing countries does not span the entire sample.
The Indicators
Sources include theIMF’s International Financial Statistics (IFS), the Interna-
tional Finance Corporation’s (IFC) Emerging Market Indicators, and the
Institute for International Economics |
112 ASSESSING FINANCIAL VULNERABILITY
World Bank’s World Development Indicators. When data were missing
from these sources, central bank bulletins and other country-specific
sources were used as supplements. Unless otherwise noted, we used 12-
month percentage changes.
M2 multiplier: the ratio of M2 to base money (IFS lines 34 plus 35)
divided by IFS line 14.
Domestic credit/nominal GDP: IFS line 52 divided by IFS line 99b
(interpolated). Monthly nominal GDP was interpolated from annual or
quarterly data.
Real interest rate on deposits: IFS line 601, monthly rates, deflated
using consumer prices (IFS line 64) expressed in percentage points.
Ratio of lending rate to deposit rate: IFS line 60p divided by IFS line
601 was used in lieu of differentials to ameliorate the distortions caused
by the large percentage point spreads observed during high inflation.
In levels.
Excess real M1 balance: M1 (IFS line 34) deflated by consumer prices
(IFS line 64) less an estimated demand for money. The demand for real
balances is determined by real GDP (interpolated IFS line 99b), domestic
consumer price inflation, and a time trend. Domestic inflation was used
in lieu of nominal interest rates, as market-determined interest rates were
not available during the entire sample for a number of countries; the time
trend (which canenter log-linearly, linearly, or exponentially) is motivated
by its role as aproxy for financialinnovation and/or currencysubstitution.
Excess money supply (demand) during precrisis periods (mc) is reported
as a percentage relative to excess supply (demand) during tranquil times
(mt)—that is, 100 ן (mc מ mt)/mt.
M2 (in US dollars)/reserves (in US dollars): IFS lines 34 plus 35 con-
verted into dollars (using IFS line ae) divided by IFS line 1L.d.
Bank deposits: IFS line 24 plus 25.
Exports (in US dollars): IFS line 70.
Imports (in US dollars): IFS line 71.
Terms of trade: the unit value of exports (IFS line 74) over the unit
value of imports (IFS line 75). For those developing countries where
import unit values (or import price indices) were not available, an index
of prices of manufactured exports from industrial countries to developing
countries was used.
Real exchange rate: based on consumer price indices (IFS line 64) and
defined as the relative price of foreign goods (in domestic currency) to
the price of domestic goods. If the central bank of the home country pegs
the currency to the dollar (or deutsche mark), the relevant foreign price
index is that of the United States (or Germany). Hence for all the European
countries the foreign price index is that of Germany, while for all the
other countries consumer prices in the United States were used. The trend
was specified as, alternatively, log-linear, linear, and exponential; the best
Institute for International Economics |
DATA AND DEFINITIONS 113
fit among these was selected on a country-by-country basis. Deviations
from trend during crisis periods (dc) were compared with the deviations
during tranquil times (dt) as a percentage of the deviations in tranquil
times (i.e., 100 ן (dc מ dt)/dt).
Reserves: IFS line 1L.d.
Domestic-foreign interest rate differential on deposits: monthly rates
in percentage points (IFS line 601). Interest rates in the home country are
compared with interest rates in the United States (or Germany) if the
domestic central bank pegs the currency to the dollar (or deutsche mark).
The real interest rate is given by 100 ן [(1 ם i
t
)p
t
/p
tם1מ1
].
Output: for most countries, industrial production (IFS line 66). How-
ever, for some countries (the commodity exporters) an index of output
of primary commodities is used (IFS line 66aa).
Stock prices (in dollars): IFC global indices are used for all emerging
markets; for industrial countries the quotes from the main bourses are
used.
Overall budget balance/GDP: consolidated public-sector balance as
share of nominal GDP (World Bank Debt Tables).
Current account balance ashare of GDP: (World Bank, World Develop-
ment Report database available in CD ROM).
Current account balance a share of investment: current account
divided by gross investment (World Bank, World Development Report
database available in CD ROM).
Short-term capital inflows: Short-term capital flows as a percent of
GDP, (World Bank, World Debt Tables, database available in CD ROM).
Foreign direct investment (FDI): FDI as a share of GDP (World Bank,
World Debt Tables, database available in CD ROM).
General government consumption/GDP: General government con-
sumption, national income accounts basis as a percent of GDP, annual
growth rate (World Bank, World Development Report database available
in CD ROM).
Central bank credit to the public sector/GDP: Annual growth rate
(World Bank, World Development Report database available in CD ROM).
Net credit to the public sector/GDP: Annual growth rate (World Bank,
World Development Report database available in CD ROM).
Institute for International Economics |