Digital Economy: Impacts, Influences and Challenges 2005 phần 6 docx
Bạn đang xem bản rút gọn của tài liệu. Xem và tải ngay bản đầy đủ của tài liệu tại đây (749.31 KB, 42 trang )
On Software Piracy 185
Copyright © 2005, Idea Group Inc. Copying or distributing in print or electronic forms without written
permission of Idea Group Inc. is prohibited.
The profit of the original software firm is:
*
*
O
π
=
()( )
2
)
3
4
)(
1
(
1
1
4
qq
qq
θθ
θ
−−−
−−
(8)
and that of the pirate is:
()
()
2
**
34
1
P
θ
π
−−
−
=
(9)
The following result summarizes the impact of the presence of the pirate in the market
under network externality.
Proposition 1
In the presence of network externality, when the pirate is present in the market, the
demand for the original firm is higher than its demand under protection, while price
under piracy is lower than under protection. Formally:
D
*
O
> D
*
NP
and P
*
O
< P
*
NP
.
Proof: Follows after comparing (and simplifying) (2) with (6) and (1) with (4) respec-
tively. Q.E.D.
So under network externality, the presence of the pirate has a positive effect on the
original firm’s demand as expected, but a dampening effect on the price due to compe-
tition. Under this, we are interested to see how these two opposing effects combine and
what would be a more profitable situation for the original firm between piracy and
protection.
Protection versus Non-Protection
We compare between the profits of the original software firm under protection and non-
protection.
Proposition 2
In the presence of network externality given a choice between employing protection
and non-protection, it is always profitable for the original software developer to
protect its software.
TLFeBOOK
186 Poddar
Copyright © 2005, Idea Group Inc. Copying or distributing in print or electronic forms without written
permission of Idea Group Inc. is prohibited.
Proof: To show that
π
*
NP
–
π
**
O
≥ 0
Observe that:
π
*
NP
–
π
**
O
=
()( )
()
−−
−−
−
−
2
34
114
4
1
)1(
1
θ
θ
θ
=
()( )
2
2222
3414
98108
qqqqq
θθ
θθθ
−−−
++−−
The denominator of the above expression is non-negative. We have to show that the
numerator is non-negative for all
θ
and q.
Simplifying the numerator, we get (1 –
θ
)[8q – q
2
(9
θ
– 1)], to make it positive we must
have
q
q
9
8
+
≤
θ
which is always true for all q ∈ (0.1) and
∈
2
1
,0
θ
. Note that
q
q
9
8
+
is
decreasing in q. Q.E.D.
This result is interesting since under network externality, when the pirate is present in
the market, even if there is a positive effect on the demand of the original firm, yet the
more profitable situation for the firm, is to protect.
Proposition 3
The original software developer has got higher incentive to protect its product in the
presence of network externality as oppose to the case of without any network external-
ity.
Proof: It is easy to see that the incentive to protect increases with the degree of network
externality. Gain from protection under network externality is
()
()
2
344
98
qqq
θ
θ
−−
−+
= G (say).
Observe that G is an increasing function of
θ
. Q.E.D.
Discussion
In this part, we tried to argue that the prevalence of network externality in the software
user market cannot generally be held as a reason for software piracy. We showed that
in some situations, even with very strong network effect, protection instead of allowing
piracy, is the optimal measure for the original software developer. To this end one might
argue that in our model since deterring the pirate (or protection) is costless to the original
TLFeBOOK
On Software Piracy 187
Copyright © 2005, Idea Group Inc. Copying or distributing in print or electronic forms without written
permission of Idea Group Inc. is prohibited.
software firm, the original firm will always deter the pirate and enjoy the monopoly market
simply because monopoly profit is always higher than duopoly profit. To this end,
readers would also like to notice that the presence of the pirate increases the demand of
the original firm through network effect compared to the full protection case. Thus, this
is clearly a positive effect of allowing piracy. Although there exists the dampening effect
on the price under piracy due to competition, but a priori it is not quite clear which effect
dominates and eventually which situation would be more profitable to the original firm.
Digging a little bit deeper and contrasting with previous results in the literature
(discussed earlier), we realize that the market structure, the nature of competition and the
demand structure play a very crucial role to drive these results. For example, when the
market structure is monopolistic with two types of consumers, software piracy allows
price-discrimination among the different classes consumers (see Conner and Rumelt,
1991; Takeyama, 1994; Slive and Bernhardt, 1998).
14
On the other hand, when the market
structure is duopolistic (or strategic in general), the results regarding the existence (or
not) of software piracy very much depends on the nature of competition between the
competing firms. For example, when competition takes place between two symmetric firms
(both are original software developer, while their products are differentiated) (see Shy
and Thisse (1999)), then allowing software piracy by one group (typically low-valued
users) of software users could be supported as a non-cooperative equilibrium under
strong network effect. At the same time, when the competition takes place between two
asymmetric firms, i.e., one firm is the original software developer and the other is just a
pirate (as in this case), then allowing piracy (by the pirate) is not a profitable outcome
to the original firm. Therefore, protection remains the only profitable option to the original
developer.
One important distinction that we would like the readers to notice here is that our study
is based on retail piracy (i.e., one single pirate does all the piracy and sells to others),
15
while most of the studies (except Banerjee 2003) discussed in the literature (see section
2 and above) so far, are mainly based on end-user piracy (i.e., consumers pirate copies
mainly for their own use). So there is a distinct difference in the act of coping. Hence,
whether the nature of piracy actually leads to alternative outcomes that remain to be seen.
A future research along this will line would be desirable.
Part II
The Case of Sequential Move
So far we have considered a simultaneous move game between the original developer and
the pirate. Now we are going to consider a sequential move game where the original firm
acts as a leader and the pirate as the follower. We believe this market structure is also
very common in many real life situations, where the original producer is an established
firm in the business and is the market leader. In such situation if any pirate comes to
TLFeBOOK
188 Poddar
Copyright © 2005, Idea Group Inc. Copying or distributing in print or electronic forms without written
permission of Idea Group Inc. is prohibited.
operate, it naturally becomes the follower. An analysis of the leader-follower game also
gives us the opportunity to compare the outcomes of the simultaneous move game
scenario, which we had studied in the previous part, with the sequential version of the
game. This also makes our analysis on software piracy in a strategic framework rather
complete.
The Leader-Follower Game of Piracy
Given the distribution of the buyers which we have discussed earlier (see section 3.3),
the profit function of the pirate (follower) is given by:
π
F
P
= D
P
.
P
P
= P
P
. [
)
1( qq
PqP
PO
−
−
] (For the expression D
P
see section 3.3)
Thus, the reaction function is given by: P
F
P
(P
O
) =
2
O
qP
The profit function of the original firm (leader) is:
π
O
= D
O
.
P
O
= P
O
.
[
()( )( )
()()
θ
θ
−−
−−−+−
1
1
1
q
PPPqPq
POPO
] (for D
O
see 3.3)
Plugging in the reaction function of the follower in the above expression, we solve for
(subgame perfect) equilibrium prices:
P
O
L
=
q
q
q
θ
−−
−
2
1
; P
P
F
=
()
)
2(
2
1
θ
−−
−
(10)
Equilibrium demands are given by:
()
θ
−
=
1
2
1
L
O
D
;
()
D
F
P
θ
−−
=
2
2
1
(11)
TLFeBOOK
On Software Piracy 189
Copyright © 2005, Idea Group Inc. Copying or distributing in print or electronic forms without written
permission of Idea Group Inc. is prohibited.
The profit of the original software firm is given by:
∗
L
O
π
=
()
)
2
(
1
2
)
1
(
q
θθ
−−−
−
(12)
and that of the pirate is:
()
()
2
24
1
F
P
θ
π
−−
−
=
∗
(13)
Comparison between Simultaneous and Sequential Move Game
When we compare the equilibrium expressions in the leader-follower game with the
simultaneous move game, we get the following results.
Proposition 4
(i) In the leader-follower game, the prices of the original firm and the pirate are higher
compared to the simultaneous move game. Formally, P
O
L
≥ P
O
*
and P
O
F
≥ P
P
*
.
(ii) The demand of the original firm becomes lower while the demand of the pirate
becomes higher in the leader-follower game compared to the simultaneous move
game. Formally, D
O
L
< D
O
*
and D
P
F
≥ D
P
*
.
Proof: (i) Follows after comparing (10) with (4) and (10) with (5) respectively.
(ii) Follows after comparing (11) with (6) and (11) with (7) respectively.
Proposition 5
(i) The profits for both the leader and the follower are higher than respective
simultaneous Bertrand profits. Formally,
*
*
*
O
L
O
π
π
≥
and
*
*
*
P
F
P
ππ
≥
.
(ii) The original firm (leader) gets a higher profit than the pirate (follower).
Formally,
*
*
F
P
L
O
ππ
≥
.
Proof: (i) Follows after comparing (12) with (8) and (13) with (9) respectively.
(ii) Follows after comparing (12) with (13).
Note that point (ii) needs some attention. Usually, if the strategies are strategic
complements between the competitors (which is the case here), then the follower
gets higher profit than the leader. Here, that is not happening since the products
TLFeBOOK
190 Poddar
Copyright © 2005, Idea Group Inc. Copying or distributing in print or electronic forms without written
permission of Idea Group Inc. is prohibited.
are vertically differentiated. The leader is selling the high quality product and the
follower is selling the low quality product. The former is true when the products
are horizontally differentiated.
Now, we compare between the profits of the original software firm under protection and
non-protection.
Protection versus Non-Protection
We begin with the following interesting observation:
()
=
−
=
θ
12
1
L
O
D
D
*
NP
,
where D
*
NP
is the demand under protection.
Also:
*
L
O
P
=
q
q
q
θ
−−
−
2
1
∗
=<
NP
P
2
1
,
where P
*
NP
is the monopoly price under protection.
Hence, we have the following result.
Proposition 6
In this leader-follower case with the presence of network externality, presence of the
pirate does not make any difference to the demand of the original firm. It remains exactly
the same as it was under protection, yet the price is reduced due to competition.
This implies total profit of the original firm under the leader-follower game must be less
than the total profit under protection. Thus, we arrive at the main result for this part.
Proposition 7
In the presence of network externality given a choice between employing protection
and non-protection, it is always profitable for the original software developer to
protect its software, even when it is the market leader.
TLFeBOOK
On Software Piracy 191
Copyright © 2005, Idea Group Inc. Copying or distributing in print or electronic forms without written
permission of Idea Group Inc. is prohibited.
Proposition 8
The ranking of profits of the original firm in three different regimes (i.e., (i) simulta-
neous move under no protection, (ii) sequential move under no protection, and (iii)
protection) respectively is as follows:
∗∗∗∗
<<
N
P
L
OO
πππ
.
Thus, moving from a simultaneous move game to a sequential move game as a leader
improves the original firm’s profit, yet the improved profit is still lower than the profit
under protection. Hence, protection remains the optimal policy to the original developer
under all circumstances.
Like the simultaneous case, the following result is also true in the sequential game.
Proposition 9
The original software developer has a greater incentive to protect its product in the
presence of network externality as oppose to the case without any network externality.
Proof: As before, the incentive to protect increases with the degree of network
externality. Gain from protection under network externality is:
() ( )
2
2
34)2(12
)1(
qqqq
θθθ
−−−−−
−
= G
1
(say).
Observe that G
1
is an increasing function of
θ
. Q.E.D.
Part III
Welfare Analysis
Now we are ready to do some welfare analysis. Assume that in the set up, that is,
discussed in previous two parts (I and II), there is a social planner (say, the government)
whose objective is to maximize society’s welfare. What would be the policy recommen-
dation with respect to piracy? In other words, the question is, whether allowing piracy
is welfare improving or welfare reducing from the society’s point of view. To analyze that,
first we list the consumer surplus and the social welfare under various cases.
TLFeBOOK
192 Poddar
Copyright © 2005, Idea Group Inc. Copying or distributing in print or electronic forms without written
permission of Idea Group Inc. is prohibited.
Software Protection (No Piracy)
2
1
)
1
(
8
1
θ
−
=
C
S
(14)
2
2
1
)
1
(
8
2
3
)
1
(
4
1
)
1
(
8
1
θ
θ
θ
θ
−
−
=
−
+
−
=
W
(15)
No Software Protection (Piracy) - The Simultaneous Game
22
2222
2
)34()1(2
4
45148
qqqqq
C
S
θθ
θθθθ
−−−
+−+−+
=
(16)
2
2
2
2
2
2
2
2
)
3
4
(
)
1
(
2
2
2
8
11
18
8
12
qqqqqq
W
θθ
θθθθθ
−−−
−−++−−−
=
(17)
Comparisons
Comparing between (15) and (17), we get the following result.
Proposition 10
Under network externality, the society is better off with the pirate. Formally:
W
2
> W
1
.
Proof: It can be shown that W
2
is increasing in q for all
θ
∈ (0, ½). It is also true that
W
1
(
θ
) = W
2
(
θ
)
q=0
. Thus, combining these two we get the result.
No Software Protection (Piracy) - The Sequential Game
Here again, we list the consumer surplus and the welfare for the case when the original
developer is the leader in the market, while the pirate is the follower.
2
2
2
2
2
2
2
3
)
2
(
)
1
(
8
4
10
2
3
qqqqqq
C
S
θθ
θθθθ
−−−
+−+−++
=
(18)
TLFeBOOK
On Software Piracy 193
Copyright © 2005, Idea Group Inc. Copying or distributing in print or electronic forms without written
permission of Idea Group Inc. is prohibited.
2
2
2
2
2
2
2
3
)
2
(
)
1
(
8
3
6
7
6
9
8
12
qqqqqq
W
θθ
θθθθθ
−−−
−+++−−−
=
(19)
Comparisons
Comparing between (15) and (19), we get the following result.
Proposition 11
The society is better off with the pirate under network externality, i.e.:
W
3
> W
1
.
Proof: Like before, it can be shown that W
3
is increasing in q for all
θ
∈ (0, ½). It is also
true that W
1
(
θ
) = W
3
(
θ
)
q=0
. Thus, combining these two, we get the result.
Discussion
Thus, in our models, we find that the existence of the pirate is always better for the society.
This is true for both the simultaneous and sequential version of the game under network
externality. But at the same time, we would like to warn our readers to be more careful in
order to generalize this result in other situations. First of all, here we only capture a
situation of retail piracy in a particular demand environment. Generally, the impact of
piracy on social welfare is a far more complex issue than we captured here. For that matter,
we would like to draw the readers’ attention on a comprehensive study by Chen and Png
(2003) on copyright enforcement and pricing of information goods and welfare aspects.
Software is one of the information goods that we are interested here. Chen and Png deal
with general information goods, where the primary question was – how should the
government use its various policy instruments – penalties, taxes, and subsidies – in the
market for information good? This question is especially difficult because the govern-
ment, in setting policy, must consider how legitimate producers will adjust their pricing
and enforcement in response to government policy. So the study addresses the impact
of government policy on the software publisher’s price and detection expenditure and
then analyzes the consequences for social welfare. One distinct difference from their
study to our study here is that in their study the pirates are end-users (consumers) and
there is no retail piracy. The main findings from the study can be summarized as follows.
While the publisher may consider a price reduction and an increase in detection as simply
two alternative ways to boost legitimate demand, the two changes have qualitatively
different welfare effects. Society prefers the publisher to manage piracy through lower
prices rather than increased enforcement. Lower prices allow more people to use
software, which in turn increase consumer surplus and welfare. Second, a tax on the
copying medium is welfare superior to a penalty for copyright violations. Compared to
the penalty, the tax has less effect on the legitimate price and leads the publisher to reduce
TLFeBOOK
194 Poddar
Copyright © 2005, Idea Group Inc. Copying or distributing in print or electronic forms without written
permission of Idea Group Inc. is prohibited.
rather than raise spending on detection. Reducing spending on detection always has a
positive effect on welfare, since the cost of detection is somewhat wasteful. Lastly, it is
optimal to subsidize legitimate purchases. Here also subsidy leads to reduced spending
on detection. On the other hand, it is generally true that the government policies that
focus only on penalties will never be an optimal choice from society’s welfare point of
view. So the other policy instruments available turn out to be crucial in enhancing
society’s overall welfare under the existence of software piracy.
Contribution of the Study to
Researchers/Instructors and
Managers/Entrepreneurs
Academic Purpose for Researchers and Instructors
Up until now, the literature on the economics of software piracy is scattered in various
directions and sometimes even with several conflicting results. This chapter puts an
order to this scattered literature and connects one research agenda with the other. It
explains why some results are in conflict with other results. In doing so, the study
provides an in-depth analysis of certain important issues raised in the literature of
software piracy. We believe the chapter will be a useful guide to an academic researcher
as well as to the instructor who plans to teach a course on the economics of software
piracy. Further readings on the issue of software piracy are listed in the bibliography.
Business Purpose for Managers and Entrepreneurs
We also believe this study will give some new insights to the business practitioners who
are involved in the software industry. Every year software piracy is costing billions of
dollars to the industry. So the conventional wisdom would suggest to stop piracy at any
cost to save the industry. But at the same time, the legal software products are almost
beyond the purchasing capability of the average software users in the developing world.
So piracy remains the only way out in those regions. It is also true that easy availability
of the software products in a developing country’s markets increases the know-how and
the usage of software products. This in turn helps the software companies to sell their
products in those markets more successfully. When the scenario is like this, it is
important to the managers and entrepreneurs in the industry to come up with innovative
business strategies, which are feasible as well as profitable. We believe this study will
help them to formulate such business strategies.
Another issue is that in the present business world, e-business and e-commerce are
gradually taking the center stage, and it is needless to say that the behaviour of the
software industry will have a profound effect on them as well. Managers and entrepre-
TLFeBOOK
On Software Piracy 195
Copyright © 2005, Idea Group Inc. Copying or distributing in print or electronic forms without written
permission of Idea Group Inc. is prohibited.
neurs will try to understand this impact in great detail in order to find profitable business
solutions. The analysis done in this chapter will be a good starting point to see how the
software industry behaviour and industry growth are actually going to affect e-business
and e-commerce over time.
Concluding Thoughts
In this chapter, we argued that the presence of consumer network externality cannot be
generally held as the prime reason for piracy in all situations. We emphasize the fact that
whether network externality can be a possible reason for allowing piracy by the original
producer depends on the market structure, demand environment and the nature of
competition. We also identify that the policy recommendations on the issue of software
piracy could be very complicated, and in many cases, the effect on overall welfare is
ambiguous. We believe one policy recommendation that is unambiguous is: the
government’s incentive to enforce laws against piracy increases with the size of the
domestic software industry. In other words, this means, for small and developing
domestic software industries, allowing limited piracy does give a solid impetus for a rapid
development of the domestic software market in terms of usage and know-how. In order
to facilitate this, the growth of the industry attaining a critical market size is absolutely
essential. But this stance usually changes, once the domestic software industry becomes
relatively developed. Then to foster new innovations and in order to keep a steady
growth of the industry, a strong copyright protection law is vital. It clearly appears that
piracy can have positive social effects in the short run, provided it does not provoke a
market breakdown. In the long run, piracy is unambiguously detrimental because it limits
the potential development of new products by software sellers.
Lastly, we would like to point out that there are certain limitations with the models that
we described in this chapter. We always assumed stopping piracy is costless to the
original firm, but in reality this may not be the case. Actually, in most of the cases, it is
not a costless operation. To stop piracy or at least to limit the activity of the pirate, the
original developer has to do something which is costly. For example, to stop piracy, the
original firm may wish to set up an operation in order to monitor the market for piracy.
Now this is definitely a costly operation, which has to be borne by the original firm in order
to check the pirate. In general, monitoring also raises the cost of piracy to the pirate mainly
because if the pirate gets caught, he or she has to pay some kind of penalty. One can
capture this notion by assuming that the pirate’s cost of producing a copy increases with
the monitoring effort of the original developer. So higher the monitoring level, higher the
cost of producing pirated copies. Hence, overall piracy becomes costly with the degree
of monitoring arrangement made by the original firm. Secondly, instead of monitoring
or in addition to monitoring, the original firm can invest in R & D, so that it can develop
a technology (like putting a protective chip inside the software), which increases the cost
of copying the software. Now to develop such technology, costly R&D must be
undertaken before. So the idea is that the original firm can increase the cost of the pirate’s
TLFeBOOK
196 Poddar
Copyright © 2005, Idea Group Inc. Copying or distributing in print or electronic forms without written
permission of Idea Group Inc. is prohibited.
activity by investing in something before the pirate starts it operation. Since the
investment is costly, the question that naturally arises is whether the original firm will
actually undertake such operation or not. And if it undertakes such operation, under what
circumstances it will be effective? We believe these are some important issues that need
a great deal of attention. For future research in this area, this would be a good starting
point.
Endnotes
*
First of all, I would like to thank the editor of the book, Dr. H. S. Kehal for the
encouragement and giving me the support to write this chapter and anonymous
reviewers for the most helpful comments. I also thank the seminar participants at
the Department of Economics at NUS, and the conference participants at Australian
Economic Society Meeting (2002) in Adelaide for useful helpful comments and
suggestions. All possible remaining errors are mine.
This chapter is a part of the research work done under the research project titled
“Economics of Software Piracy” (2002). Financial support from NUS in the form of
research grant (R-122-000-040-112) for the project is gratefully acknowledged.
1
With advanced and sophisticated technological methods, pirated software copies
or even copies of copies become almost if not perfectly identical to an original one.
2
In Vietnam only 5% software is legitimate; while in U.S. 23% software is pirated
(Source: BSA 2003).
3
Benchmark levels vary from country to country and from one software category to
another. For PC business software, benchmark levels of 23% (the rate currently
experienced in the U.S.) were used for most countries, and a rate of 0% was used
for the United States.
4
The idea of network externality stems from the work of Katz and Shapiro (1985). See
also Rohlfs (1974), Gandal (1994) and Shy (1996). Generally, the idea is that the
utility that a given user derives from some products depends upon the number of
other users who consume the same products. In other words, consumers’ prefer-
ences are said to exhibit network externality if the utility of each consumer increases
with the cumulative number of other consumers purchasing the same brand. When
this is the case, each additional purchase raises the value to existing users as well
as the expected value to future adopters. A classic example of a product that
exhibits such a characteristic is found in the telephone network.
5
We would like to emphasize that in this study we do not deal with network security
issues or any such technical matter.
6
Presumably, the original developer had incurred some fixed cost (like R&D to
develop the software) which is sunk now. The cost of making a copy of the software
is negligible.
TLFeBOOK
On Software Piracy 197
Copyright © 2005, Idea Group Inc. Copying or distributing in print or electronic forms without written
permission of Idea Group Inc. is prohibited.
7
q X – P
P
= q (X – P
P
) + (1 - q)(-P
P
). If the pirated software is not working, consumer
does not derive any benefit from the software and instead only incurs a loss
equivalent to the amount paid for the pirated software.
8
In most market pirates operate using some makeshift arrangement. If the pirated
software turns out to be a defect product, there is no chance of getting software
replaced.
9
The effects of installing protection into software in the market for software as well
as monitoring piracy have been analyzed in Chen and Png (2003) and Banerjee
(2003) among others.
10
Using notation “NP” in the subscript for no piracy.
11
Network effect is bounded by ½; because θ = ½ is enough to serve the full market
under monopoly.
12
Since the consumer buys original software, he gets to enjoy the benefit X and the
network externality generated by those who also buy original software with
certainty. However, he only gets to enjoy the network created by those who buy
pirated software with probability q, since only there is only a q chance that it works.
13
Since this consumer buys pirated software, he gets to enjoy the benefit and the
network effect created by both legal and illegal users if and only if his software
works.
14
Although, recently King and Lampe (2002) argued that allowing piracy cannot raise
profits if the monopoly producer itself can directly price discriminate between
potential consumers who pirate and other consumers who buy original product.
15
Retail piracy is more prevalent in the poor and developing countries, where the laws
against piracy or in general copyright violations are rather weak, and sometimes
even more difficult to enforce because of corruptions.
References
Banerjee, D. S. (2003). Software Piracy: A Strategic Analysis and Policy Instruments.
International Journal of industrial Organization, 21(1), 97-127.
Chen, Y, and Png, I. (2003). Information Goods Pricing and Copyright Enforcement:
Welfare Analysis. Information Systems Research, 14(1), 107-123.
Conner, K.R., and Rumelt, R.P. (1991). Software Piracy: An Analysis of Protection
Strategies. Management Science, 37(2), 125-139.
Gandal, N. (1994). Hedonic Price Indexes for Spreadsheets and an Empirical Test of
Network Externalities Hypothesis. Rand Journal of Economics, 25, 160-170.
Katz, M. and Shapiro, C. (1985). Network Externalities, Competition and Compatibility.
American Economic Review, 75(2), 424-440.
King, P. S. and Lampe, R. (2002). Network Externalities, Price Discrimination and
Profitable Piracy. Mimeo: University of Melbourne.
TLFeBOOK
198 Poddar
Copyright © 2005, Idea Group Inc. Copying or distributing in print or electronic forms without written
permission of Idea Group Inc. is prohibited.
PricewaterhouseCoopers for Business Software Alliance. (1998). Contributions of the
Packaged Software Industry to the Global Economy. Washington, D.C.
Rohlfs, J. (1974). A Theory of Interdependent Demand for a Communication Service. Bell
Journal of Economics, 8, 16-37.
Shy, O. (1995). Industrial Organization: Theory and Applications. Cambridge: MIT
Press.
Shy, O. and Thisse, J. F. (1999). A Strategic Approach to Software Protection. Journal
of Economics and Management Science, 8(2), 163-190.
Slive, J. and Bernhardt, D. (1998). Pirated for profit. Canadian Journal of Economics,
31(4), 886-899.
Takeyama, L. N. (1994). The Welfare Implications of Unauthorized Reproduction of
Intellectual Property in the Presence of Demand Network Externalities. Journal of
Industrial Economics, 2, 155-165.
Takeyama, L.N. (1997). The Intertemporal Consequences of Unauthorized Reproduction
of Intellectual Property. Journal of Law and Economics, 40(2), 511-522.
Internet Sources
1998, 2000, 2002, 2003 Global Software Piracy Report. Retrieved from the World Wide
Web: .
Further Readings on Software Piracy
Low, L. (2000). Economics of Information Technology and the Media. Singapore, New
Jersey, London, Hong Kong: Singapore University Press and World Scientific
Publishing Co. Pte. Ltd.
Mowery, D. C. (1996). The International Computer Software Industry. New York and
Oxford: Oxford University Press.
Poddar, S. (2002). “Economics of Software Piracy” – Project Report 2002. NUS. (Project
supported by NUS research grant R-122-000-040112.)
Steven C., Jr. (2002). Copycat: The Effects of Software Piracy on the Global Economy.
Retrieved from the World Wide Web: />trade_environment/growing_pains/schew.htm.
Watt, R. (2000). Copyright And Economic Theory: Friends or Foes? Northampton, MA:
Edward Elgar.
TLFeBOOK
On Software Piracy 199
Copyright © 2005, Idea Group Inc. Copying or distributing in print or electronic forms without written
permission of Idea Group Inc. is prohibited.
Readings in Game Theory
Fudenberg, D. and Tirole, J. (1991). Game Theory. Cambridge, MA: MIT Press.
Gibbons, R. (1992). A Primer in Game Theory. NewYork: Harvester Wheatsheaf.
Rasmusen, E. (1994). Games and Information: An Introduction to Game Theory. (2
nd
Edition) Oxford: Blackwell.
Romp, G. (1997). Game Theory: Introduction and Applications. Oxford: Oxford Univer-
sity Press.
TLFeBOOK
200 Brunn
Copyright © 2005, Idea Group Inc. Copying or distributing in print or electronic forms without written
permission of Idea Group Inc. is prohibited.
Chapter X
An E-Classification
of the World’s
Capital Cities:
URL References to
Web Sites
Stanley D. Brunn
University of Kentucky, USA
Abstract
The world’s capital cities perform various political functions for their populations,
contain embassies, consulates, and missions of other governments, and serve as
headquarters for major corporations, cultural, and humanitarian organizations.
While social scientists have classified major cities based on population size, number
of corporate headquarters, banks, and airline connections, the emergence of ICTs
suggests additional criteria. I use the number of URL references to Web sites listed in
the Google search engine for 199 world capitals and classify them into five distinct
categories. Small, prosperous city-states and major capitals in Western Europe and
North America have the most hyperlinks. The fewest are for capitals in poor, rural Sub-
Saharan Africa and Southeast Asia. Capitals with multiple government offices, strong
ICT economies and dominant tourist economies have the most hyperlinks per capita.
These are mostly in wealthy Europe and North America. The lowest values are among
African and Asian capitals in poor countries and those with repressive regimes. Major
news items, embassy, financial, and tourism information are major themes on web
pages. Additional research topics are suggested.
TLFeBOOK
An E-Classification of the World’s Capital Cities 201
Copyright © 2005, Idea Group Inc. Copying or distributing in print or electronic forms without written
permission of Idea Group Inc. is prohibited.
The emerging worlds of digital economies or e-commerce present challenges and
opportunities for scholars in the social and policy sciences who are interested in the
information that is available about individual cities and their linkages with other cities
in a region (Brunn, 2003b). Valuable and insightful contributions into these new worlds
of geography, economics, management, sociology, and politics have come from scholars
in a number of fields including geography (Geographical Review, 1997; Janelle and
Hodge, 2000; Wilson and Corey, 2000; Leinbach and Brunn, 2001; Tijdschrift voor
Economische en Sociale Geografie, 2002; Environment and Planning A, 2003), sociol-
ogy (Barnett, 2001; Castells, 2001; Hargittai and Centeno, 2001; Kick and Davis, 2001;
Sassen, 2001), organizational science and management (Sacks, Ventresca and Uzzi, 2001).
Cities, urban regions, and networks have also been a focus of disciplinary and interdis-
ciplinary research initiatives (Castells, 2002; Van der Wusten, 2002). Among the topics
addressed are telecommunications and the changing structures of cities (Graham and
Marvin, 1996; Wheeler, Aoyama and Warf, 2000; Brunn and Ghose, 2003), the changing
geographies of the Internet (Zook, 2001; Kellerman, 2002), the most and least linked
regions (Saad, House and Brunn, 2002), the changing infrastructure of international
Internet-based cities (Townsend, 2001), the changing dynamics of airline networks
(Smith and Timberlake, 2001), and salient features of globally networked cities (GaWC
Study and Network).
One feature of the contemporary urban world that has not been investigated to date is
a classification of the world’s capital cities, in particular, based on how much and what
kinds of information are available using major search engines. Classifying the world’s
largest cities or urban areas has long been of interest among social scientists, including
geographers, sociologists, and economists, because of their political, economic, and
cultural significance. One of the major themes has been classifying world or global cities
by using a number of indices, including population sizes, international sports venues,
number of major corporations, head offices of major banks, stock agencies, advertising
agencies, airline passengers, networks and freight volume, and cultural events (Brunn,
Williams and Zeigler, 2003; Friedman, 1986, 1995; Short et al., 1995; Short and Kim, 1999;
Knox, 1994; Knox and Taylor, 1995; Knox and Pinch, 2000; Hall 1966, 1984, 2001; Lo and
Marcotullio, 2001; GaWC Study and Network; Smith and Timberlake, 2001; Wagenaar,
Mamadouh and Dijkink, 2000). These studies are valuable in suggesting subsequent
studies on specific types of cities or city systems using new databases and perspectives.
National Capitals
National capitals represent a major category of important cities. They are not only
significant political, economic, and cultural nodes for the state in which they are located,
but they are also significant for the roles they play and influences they have elsewhere.
Capital cities are networked to rural areas and small towns within their state, as well as
the major centers of commerce, industry, research and development, and learning. As
the major administrative center for the country’s central government, the capital city is
the place where national decisions are made regarding the lives of those within its
TLFeBOOK
202 Brunn
Copyright © 2005, Idea Group Inc. Copying or distributing in print or electronic forms without written
permission of Idea Group Inc. is prohibited.
borders, including educational funding and the content of school curricula, economic
development initiatives, social welfare policy, and environmental regulations. Capital
cities often are the sites of not only the executive branches of the national government,
but the national legislative chambers, the highest courts, and military/defense and law
enforcement offices, as well. Many national capitals also are places where the embassies,
consulates, and missions of other countries are located as well as the headquarters for
IGOs and NGOs. Thus capital cities, in short, perform a variety of functions and roles,
not just to those living within its borders, but also to those in neighboring states, and
those in distant states.
Classifying a National Capital’s
Importance
Missing from the disciplinary and interdisciplinary literature on city functions are
examinations into the amounts and varieties of data from electronic databases that are
available about individual cities within a country, the world’s largest cities, and specific
types of cities. The latter would include capital cities, major university cities, medical
centers, tourist destinations, and high tech clusters. This chapter is an initial inquiry into
the amounts of information that are available about a specific category of cities, viz.,
capital cities of the world’s states, and using the references to Web sites in major
electronic search engines as a database.
There are a number of criteria one might utilize to describe, rank and classify a capital
city’s importance on a regional or global scale. These would include population size,
although in many countries, the capital is not the largest city, such as Brazil, Canada,
Australia, South Africa, India, Switzerland, Nigeria, Turkey, and Morocco. Capital cities
also include a number of embassies and consulates, offices of interregional and interna-
tional agencies, organizations and programs (United Nations or European Union). The
sizes of the international professional labor force (diplomats, diplomatic staff, students,
translators, program officers, bankers, consultants, lobbyists, health care and environ-
mental professionals) vary as do the number and variety of cultural (music and theater
performances, museum exhibitions, sporting events, and public lectures) events that take
place during a year, including international and regional conferences and conventions.
Capital cities are frequently also the sites of visits by international heads of states or
heads of various state programs (environment, trade and investment, education, chil-
dren, and health care). Transportation and communication linkages to and from the
capital cities are also important, including direct road and rail connections to other
capitals, airline connections as well as the volume of phone, mail (letters and packages),
and fax traffic, the exchanges of information among members of diplomatic staff and print
and visual journalists for various news organizations, and the volume of monies or credit
transferred for investment, developmental assistance, and personal use. (Many of these
information exchanges are already performed electronically.) Also we could use the
frequencies with which cities have appeared in major international newspapers or on
global TV networks (CNN, Skylab, etc.) and discuss their importance in a regional or
TLFeBOOK
An E-Classification of the World’s Capital Cities 203
Copyright © 2005, Idea Group Inc. Copying or distributing in print or electronic forms without written
permission of Idea Group Inc. is prohibited.
global context. An additional data source we could use is the amount of information
provided in an electronic database. Search engines provide access to materials special-
ists and generalists use to learn about specific subjects, in this case, capital cities and
distinctive features of those cities, including their histories, economies, cultures, tourist
sites, restaurants, and weather. URL references or hyperlinks provide access to Web
addresses for the desired information. We could utilize this information from search
engines to measure the importance of a capital city in an electronic world. That is, a high
hyperlink per capita rating for a capital city will inform us of the quantity, not necessarily
the quality, of information available electronically. A low volume will inform us that there
is little electronic information available. The number of electronic references also
provides a useful measure with which to compare world capitals.
One might picture what a set or volume of network maps might look like for the capital
cities of the world’s nearly 200 political units. These could be maps of each city
individually or networks of other capitals. Whether one uses absolute data, such as the
number of diplomatic staff, or international conferences held each year, or network data
(airline connections), or the number of diplomatic visits per year from a neighboring state,
geographic variations would surface. That is, some capitals would rank high using these
or other criteria, others would rank very low.
Digital Technologies
To assess the position of the world’s capital cities on the current world political map, I
use the number or volume of URL references to Web sites for each capital city. Each URL
reference or hyperlink gives a reference to a web address. That address provides
electronically available information. This information may be about population numbers,
investment opportunities, health and social well-being data, tourist sites, hotels, or some
combination of the above. This information may be in the form of narratives, graphs,
tables, photos, or maps. A capital city with few URLs is one with little electronically
available information compared to another capital city with thousands or hundreds of
thousands of references available about a city’s economy, history, culture, entertain-
ment, and government.
When we examine data on the number of URL references or hyperlinks per capita, we
obtain an additional measure of that city’s regional and global importance, at least in an
electronic or wired world. Capital cities with low per capita ratings are cities where we
find little information available electronically. Values of 1.00 or higher are cities that have
more hyperlinks than number of residents, that is, there are many more references to web
pages than residents.
Below I address the following questions:
• What capital cities have the most URL references or hyperlinks, and which have
the fewest? How might we classify them?
• Are the most “wired” capital cities, or those with most electronic addresses, located
in the richest countries? And, correspondingly, are the least wired in the poorest
regions?
TLFeBOOK
204 Brunn
Copyright © 2005, Idea Group Inc. Copying or distributing in print or electronic forms without written
permission of Idea Group Inc. is prohibited.
• What capital cities have the highest and lowest hyperlinks per capita? Are they
the same as those cities with the most URLs?
• Are there any commonalities among those capital cities with lowest and highest
hyperlinks per capita? Are they the poorest and the smallest in populations? Are
they new states on the world political map? Do they have specialized economies?
• Are there any differences in the content of the Web sites of the cities with the most
and fewest URL references?
In the following section I describe the database and methodology, followed by a
presentation and discussion of the results. The findings are examined in regards to the
total number of URLs for each capital city, hyperlinks (or URL references) per capita, and
subject content of selected capital cities’ information on Web pages. I also discuss these
findings within a regional context, as I am interested in discerning whether capital cities
in some regions have significantly more or fewer addresses than others. The presenta-
tion below is supported by several tables and graphics.
Data and Methodology
To ascertain the number of URLs or hyperlinks for each capital city, I used the Google
Search Engine. While there are other search engines one might use, including MetaCrawler,
Yahoo, DogPile, and AltaVista, I used Google because it has one of the largest and most
comprehensive electronic databases (more than 3 billion Web sites as of July 2003) and
because it contains international and multilingual entries. During several weeks in June
and July 2003, I collected information on the number of URL references for each capital
city. In the appropriate “box” on the screen, I typed in the name of the capital city and
the country, for example, Tegucigalpa+Honduras, Khartoum+Sudan, Rome+Italy, Wash-
ington, D.C. Within seconds I was given the total number of URL references or hyperlinks
for that city.
I used the above procedure to identify the number of URL references for 199 capital cities.
I included the capital cities of large countries, as well as small island states and political
units in the Caribbean (Dominica, Curaçao, and Guadeloupe); South Indian Ocean
(Mauritius and Seychelles); and Pacific Basin (Nauru, Tonga, and New Caledonia). Data
on the population sizes of these cities are available from a number of sources, including
statistical abstracts, world almanacs and capital city Web sites. The analyses below are
discussed in three sections: first, absolute numbers of references, and second, the URL
references or hyperlinks per capita, and third, the content of the first Web pages for
selected cities.
There are three additional points regarding the data set that merit mention. First, most
of the entries in the Google Search Engine are in English. While English is the unofficial
language of the Internet, there are doubtless many additional information items available
about these capital cities, even electronically available, that are not listed in this search
engine. Thus any data count on electronic entries from a major search engine will be
TLFeBOOK
An E-Classification of the World’s Capital Cities 205
Copyright © 2005, Idea Group Inc. Copying or distributing in print or electronic forms without written
permission of Idea Group Inc. is prohibited.
incomplete as someone has to place the information on the Web. Second, the number
of references for any given city is subject to change quickly, even within a 24-hour period
or from week to week. New entries appear and others disappear. This feature applies just
as much to very large capital cities as it does to small capitals. Third, the existence of a
given URL reference to a web address reveals nothing about the quality of that
information to the potential user, only that it is electronically available information. The
reference may be an official government document, an intergovernmental report, infor-
mation from an investment group, publicity by an indigenous or outside tourist bureau
or a private report or a webcam site prepared by a former resident, recent traveler, student
or exile. Sometimes brief descriptions accompany the URL. Thus examining in detail the
content of a single URL reference may result in the city only mentioned within a table or
a small section of a report or it could be devoted to an extensive discussion about that
city’s history, economy, and culture. In short, URL references contain a wide variety of
electronic information, and the quality and utility of that information will vary depending
on the source. That same generalization could be made about the printed materials
available in many public libraries.
To understand the kinds of information available on the WWW about capital cities, I
examined the sites listed on the first screen (“page”) listing URL references for a group
of individual capital cities. Google provides a PageLink for each site accessed. It
describes this metric as “an indicator of an individual page’s value” (www.google.com).
It looks at the links between each Web page and every other Web page. Thus the rank
is not based solely on volume of votes or links a page has, but at the pages that “vote”
or rank the page. This search engine, in describing this ranking, notes that “votes” cast
by pages that are themselves “important” weigh more heavily and help to make other
pages “important.” In the discussion below, I examined the first pages on the screen of
the 27 capital cities with the most URL references and those five capitals with the fewest.
Results
Absolute Totals
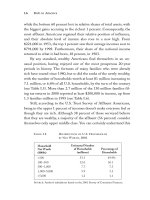
The 199 capital cities had a combined total of nearly 120 million hyperlinks or URL
references (Table 1). There was very wide variation from 6.6 million URL references for
Singapore to 3,550 for Yaren (capital of Nauru). I divided the countries and their
respective capitals into 19 major regions, adopting those used in a university world
geography textbook (Pulsipher and Pulsipher, 2002). The capitals in Western Europe had
the most hyperlinks (16.6 million) followed by Southern Europe (13.2 million), and Central
America (12.2 million) (Table 1). These three regions had 13, 11, and 10% respectively
of the total. By contrast, the regions with capital cities having the fewest hyperlinks were
Southern Africa (603,000) and the Pacific Islands (only 470,000). Together these regions
had less than 1% of all capital city references.
TLFeBOOK
206 Brunn
Copyright © 2005, Idea Group Inc. Copying or distributing in print or electronic forms without written
permission of Idea Group Inc. is prohibited.
Table 1. Total number of URL references or hyperlinks for capital cities in major world
regions (number of capital cities in the region in parenthesis)
Region Number % of total
U
nited States and Canada (2) 7,260,000 6.1
E
urope – North (10) 10,637,000 9.0
E
urope – South 13,241,700 11.1
E
urope – East (10) 6,875,000 5.8
E
urope – West (9) 15,230,000 13.0
S
outh America (13) 5,783,900 4.9
C
entral America (8) 12,279.000 10.3
C
aribbean (18) 6,664,000 5.6
A
frica – West (16) 2,891,000 2.4
A
frica – Central (9) 2,293,000 1.9
A
frica – Southern (5) 603,000 .5
A
frica – North (5) 1,229,000 1.0
A
frica – East (18) 3,275,000 2.7
A
sia – East (6) 5,769,000 4.9
A
sia – South & Central (14) 4,065,000 3.4
A
sia – Southeast (11) 11,182,000 9.4
A
sia – Southwest (17) 6,273,000 5.3
P
acific Islands (11) 410,000 .3
A
ustralia and New Zealand (2) 2,840,000 2.4
TOTAL 118,799,000 100.0
Classifying the World’s Capitals
Fifteen capitals had more than 2 million hyperlinks, led by Singapore, a city-state that is
among the world’s leaders in ICT development and e-commerce (Corey, 2000). Washing-
ton, D.C. was a distant second (Table 2). Several with more than 2 million references each
are “global cities,” such as, London, Paris, and Tokyo. Others are major continental
cities, including Rome, Berlin, and Madrid in Europe, and Mexico City in Central America.
TLFeBOOK
An E-Classification of the World’s Capital Cities 207
Copyright © 2005, Idea Group Inc. Copying or distributing in print or electronic forms without written
permission of Idea Group Inc. is prohibited.
The top 15 capitals, with 46 million references, had 31% of the all capital city references.
The top 27 capitals had 66 million or 56% of the total. Some of the cities with high rankings
are mentioned frequently in the international news as places with major military conflicts,
a natural disaster, or disease outbreak. Examples include Kabul, Baghdad, and Djibouti.
Cities with the most hyperlinks in a region are not always the largest political capital. For
example, Djibouti had the most in East Africa, Kingston in the Caribbean, and Bissau in
West Africa.
Table 2. Leading capital cities in number of URL references or hyperlinks in thousands
City Country Hyperlink
s
Singapore Singapore 6,640
Washington, D.C. U.S. 5,120
Mexico City Mexico 4,210
Luxembourg Luxembourg 3,400
Paris France 3,370
Panama Panama 3,170
Tokyo Japan 2,450
Monaco Monaco 2,410
Madrid Spain 2,310
Berlin Germany 2,250
Rome Italy 2,200
London United Kingdom 2,170
Ottawa Canada 2,140
San Salvador El Salvador 2,140
Guatemala City Guatemala 2,020
Dublin Ireland 1,970
Kuwait City Kuwait 1,890
Moscow Russia 1,890
San Marino San Marino 1,800
Vienna Austria 1,750
Beijing China 1,690
Buenos Aires Argentina 1,670
Stockholm Sweden 1,630
Auckland New Zealand 1,570
Athens Greece 1,550
Bangkok Thailand 1,540
Delhi India 1,510
TLFeBOOK
208 Brunn
Copyright © 2005, Idea Group Inc. Copying or distributing in print or electronic forms without written
permission of Idea Group Inc. is prohibited.
Each of the 24 capitals in the second category had between 1.0-1.9 million references
(Figure 1). It included a mix of cities in different parts of the world, but especially in
Europe. Vienna, Brussels, Stockholm, and Dublin were included, as were Kuwait City,
Baghdad, and Djibouti. In this category were also Beijing, Moscow, Bangkok, and
Canberra, as well as Buenos Aires, Auckland, San Marino, the Vatican, and Bissau.
The third category included 22 capitals which had between 500,000-999,999 hyperlinks
each. Most of these cities were in the Caribbean, including Kingston, Santo Domingo,
Havana, Port au Prince, and Port of Spain. Another cluster was in eastern Europe: Prague,
Budapest, Warsaw, and Kiev. Lisbon was the only southern European city in this
Figure 1. Total number of URL references or hyperlinks of capital cities in the world’s
political states
TLFeBOOK
An E-Classification of the World’s Capital Cities 209
Copyright © 2005, Idea Group Inc. Copying or distributing in print or electronic forms without written
permission of Idea Group Inc. is prohibited.
category and Cairo the only one in Africa. Seoul, Jakarta, and Kuala Lumpur were also
in this category.
Category four included 67 cities which had between 100,000-499,000 references. There
were capitals in most world regions, but most notably in Southwest Asia (Damascus,
Doha, Beirut, Tbilisi, and Dubai), South Central Asia (Kathmandu, Colombo, Tashkent,
and Karachi), and East Africa (Dar es Salaam, Nairobi, Addis Ababa, and Lusaka).
The fifth category included those 71 capitals, each with fewer than 100,000 hyperlinks.
There were cities in more than a dozen regions, with most being in West Africa (12), the
Pacific Islands (10), East Africa (10), and the Caribbean (eight). Examples of cities were:
Niamey, Freetown, Ouagadougou, Conarky, and Nouckehott in West Africa; Yaren,
Palikir, and Apia in the Pacific; Maputo (Mozambique), Asmara (Eritrea), Moroni
(Comoros), Lilongwe (Malawi), and Mogadishu (Somalia) in East Africa; and Castries (St.
Lucia), Willemstad (Curaçao), St. George’s (Grenada), and Plymouth in the Caribbean.
Thirteen national capitals had fewer than 15,000 references. Five had fewer than 6,000
each: Thimpu (Bhutan) 5,290, Palikir (Micronesia) 4,110, Nuku’alofa (Tonga) 3,940, Port
Louis (Mauritius) 3,860, and Yaren (Nauru) 3,550.
Additional insights into the importance of capital cities in an electronic world are gained
by examining the absolute number of URL references of some cities compared to the
combined totals of other cities or entire regions. For example, Singapore, with more than
6.6 million hyperlinks, had a higher total than all capital cities in Western, Central, and
North Africa combined. The nine capital cities in Western Europe (15.2 million total
hyperlinks) had almost as many as the combined number of those 13 capitals in South
America and eight in Central America. The combined totals of Washington, D.C. and
Ottawa (7.2 million) were more than all capital cities in West, Central, Southern, and
Northern Africa. The combined total of all the 12 capital cities in the island Pacific (the
region with the fewest capital city references) was less than the total number of references
for Sofia, Nairobi, San José, Hanoi, or Ankara. Moscow’s total was similar to that of
Kuwait City (about 1.9 million). Auckland, New Delhi, Athens, and Bangkok had about
the same number (1.5 million references).
Hyperlinks Per Capita
In regards to the number of hyperlinks per capita for the world’s capital city residents,
there was also wide variation. They ranged from 1,629 per capita for the Vatican City to
.012 for Abidjan, Côte d’Ivoire, .016 for Ulan Bator, Mongolia and .017 for Dhaka,
Bangladesh (Figure 2). There were 48 capital cities with more hyperlinks than residents,
including 18 with more than five hyperlinks per capita. The highest figures were for highly
specialized small city states with dominant economies including: finance (Vaduz,
Liechtenstein), telecommunications and communications (Singapore), religious head-
quarters (Vatican City), administration (Brussels, Belgium; Luxembourg, Luxembourg;
Washington, D.C., Canberra, and Ottawa), and tourism (Monaco; Yaren, Nauru; Valletta,
Malta; Plymouth, Montserrat, and Victoria, Seychelles).
The first category of 48 capitals includes those with .01 - .09 hyperlinks per capita (Figure
2). In the main, these were capitals in very poor countries and those with closed or
TLFeBOOK