Global Economic Prospects Realizing the Development Promise of the Doha Agenda phần 5 ppsx
Bạn đang xem bản rút gọn của tài liệu. Xem và tải ngay bản đầy đủ của tài liệu tại đây (284.79 KB, 33 trang )
GLOBAL ECONOMIC PROSPECTS 2004
100
_____. 2000. “The Tyranny of Concepts: CUDIE (Cu-
mulated, Depreciated Investment Effort) Is Not
Capital.” Journal of Economic Growth 5: 361–84.
______. 2001. “Where Has All the Education Gone?”
World Bank Economic Review 15 (3): 367–91.
Redding, Stephen, and Anthony Venables. 2001. “Eco-
nomic Geography and International Inequality.”
CEP Working Paper 495. London School of Eco-
nomics, London.
Schott, P. 2001. “Do Rich and Poor Countries Special-
ize in a Different Mix of Goods? Evidence from
Product-Level U.S. Trade Data.” Working Paper
8492. National Bureau of Economic Research,
Cambridge, Mass.
_____. 2002. “Across-Product Versions Within-Product
Specialization in International Trade.” Mimeo.
Yale School of Management, New Haven, Conn.
_____. 2003. “One Size Fits All? Heckscher-Ohlin Spe-
cialization in Global Production.” American Eco-
nomic Review 93(3): 686–708.
Stawowy, Wojciech. 2001. “Calculation of Ad Valorem
Equivalents of Non-Ad Valorem Tariffs.” Mimeo,
UNCTAD, October.
Todaro, M. 1994. Economic Development. New York:
Longman.
World Bank. 2000. Global Economic Prospects 2001.
Washington, D.C.
World Bank. 2002. Global Economic Prospects 2003.
Washington, D.C.
World Bank. 2003. World Development Indicators.
Washington, D.C.
WTO. 2001. “Ministerial Declaration.” Document WT/
MIN(01)/DEC/1, November 20.
WTO. 2003a. “Draft Elements of Modalities for Ne-
gotiations on Non-Agricultural Products.” World
Trade Organization, Negotiating Group on Mar-
ket Access, TN/MA/W/35, Geneva.
WTO. 2003b. Formula Approaches to Tariff Nego-
tiations: Note by the Secretariat.” Document TN/
MA/S/Rev 2, April 11.
WTO. 2003c. “Negotiations on Agriculture: First
Draft of Modalities for the Further Comments.”
Document TN/AG/W/1/Rev. 1, March 18.
Yang, Y., W. Martin, and K. Yanagishima. 1997.
“Evaluating the Benefits of Abolishing the MFA
in the Uruguay Round Package.” In T. Herteb,
ed., Global Trade Analysis: Modeling and Appli-
cations. Cambridge, Mass.: Cambridge University
Press.
world’s poor—
Agriculture is the largest employer in low-
income countries, accounting for about 60 per-
cent of the labor force and producing about 25
percent of GDP. Even in middle-income coun-
tries, where agriculture’s share of GDP is only
about 15 percent, the sector still accounts for
more than 25 percent of employment. When
coupled with agro-related industries and food-
related services, its share, even among middle-
income countries, is typically 25 to 40 percent
of GDP. About 73 percent of the poor in de-
veloping countries live in rural areas. Rural
development, therefore, is central to alleviating
poverty.
Government policy has heavily distorted
agricultural performance in both developing
and developed countries. Until the 1990s, in-
dustrial countries generally protected agricul-
ture, whereas developing countries generally
taxed it (Schiff and Valdes 1992). Industrial
countries supported their agricultural sectors
through subsidies to producers, high tariffs,
and other nontariff measures such as import
restrictions and quotas.
—but agricultural policies have often
worked to the detriment of the poor
Most of the developing countries generated
the bulk of their agricultural GDP in lower-
efficiency production for the domestic market,
supplying the world market with tropical com-
modities that could not easily be produced in
the industrial countries. In products for which
they competed with industrial countries, such
as sugar and beef, some countries could export
limited amounts under preferential-access pro-
grams. In an effort to generate public revenues
from commercialized export activities, govern-
ments levied export taxes on agricultural prod-
ucts while protecting manufacturing through
high import tariffs and other import restric-
tions. Even for agricultural products that were
not exported, price controls, exchange rate
policies, and other restrictions kept prices low
for urban consumption.
In the last decade, developing countries
shifted from taxing agriculture to protecting it.
Import restrictions on manufactured products
have declined dramatically, exchange rates have
been devalued, multiple-exchange-rate systems
penalizing agriculture have been abandoned,
and export taxes have effectively disappeared
(World Bank 2000; Jansen, Robinson, and Tarp
2002; Quiroz and Opazo 2000). Meanwhile,
reforms in most industrial countries, including
many of the successful middle-income coun-
tries, have been modest—despite the inclusion
of agriculture under the World Trade Organi-
zation (WTO) in the Uruguay Round of inter-
national trade negotiations. The result of these
policies has been overproduction and price de-
clines in many commodities, reducing opportu-
nities for many developing countries to expand
exports and penalizing the world’s poor.
Consequently, although developing coun-
tries have almost doubled their share of world
103
Agricultural Policies
and Trade
3
trade in manufactures over the last two
decades, their share in agricultural trade has
been stuck at around 30 percent. During the
1990s, the growth of developing-country agri-
cultural exports to industrial countries slowed
as exports to other developing countries ac-
celerated. During this period, 56 percent of
the growth of developing-country agricultural
trade was accounted for by sales to other de-
veloping countries and 44 percent by sales to
industrial countries. The middle-income coun-
tries have managed to increase global market
share, principally by entering into other devel-
oping countries’ markets and by aggressively
diversifying into nontraditional exports, such
as seafood products, fruits, vegetables, cut
flowers, and processed foods. Growth of these
nontraditional exports has outpaced growth
of traditional commodities by three to one.
Meanwhile, many low-income countries, ex-
cept for China, have had less success—their
share of world agricultural trade has declined.
High border protection in rich countries
frustrates development
These patterns reflect—among other things—
the structure of global protection. Border pro-
tection in rich countries continues to be high,
nontransparent, and antidevelopment. Average
agricultural tariffs in industrial countries,
when they can be measured, are two to four
times higher than manufacturing tariffs. In ad-
dition, about 28 percent of domestic produc-
tion in countries belonging to the Organisation
for Economic Co-operation and Development
(OECD) is protected by tariff rate quotas
(TRQs). More than 40 percent of the tariff
lines in the European Union (EU) and United
States contain specific duties, which make it
difficult to calculate average tariffs and ob-
scure actual levels of protection. Tariff peaks
as high as 500 percent confront imports from
developing countries. Tariffs also increase by
degree of processing, creating a highly esca-
lating tariff structure that limits access for
processed foods. Preferences do not compen-
sate for these high levels. In the United States,
only 34 percent of agricultural imports from
countries covered by the Generalized System of
Preferences (GSP) were eligible for preferences,
and 26 percent of imports received them. De-
veloping countries, too, have maintained high
border protection and, on average, have higher
agricultural tariffs than industrial countries.
However, direct comparisons are difficult be-
cause of the complex nature of protection in
industrial countries.
Within OECD countries, budget subsidies
and transfers from consumers (from high tar-
iffs and quantitative restrictions on domestic
production of selected commodities) amounted
to about $250 billion in 1999–2001. This pro-
tection decreased from 62 percent of farm
revenues in 1986–88 to 49 percent in 1999–
2001—still a very high percentage. Of this sup-
port, 70 percent came from consumers via
higher prices associated with border protection
and 30 percent from direct subsidies. In devel-
oping countries, almost all support is gener-
ated by border barriers. A silver lining to this
dark cloud is that some developed-country
subsidies have been at least partially delinked
from levels of production, lowering the incen-
tive to overproduce. These partially decoupled
subsidies increased from 9 percent of total sub-
sidies in 1996–98 to more than 20 percent in
1999–01.
Although official export subsidies may be
small and shrinking, effective export subsidies
created by domestic support are increasing,
lending unfair advantage to industrial coun-
try producers. Currently, cotton is not classi-
fied as receiving export subsidies. Its domes-
tic and export prices in the United States and
the European Union are the same—and those
prices are less than half the cost of production.
Similar differences exist in many other prod-
ucts, a gap that will increase as industrial
countries move from protection through bor-
der barriers to support through coupled or
partially decoupled subsidies.
Success in the Doha Round requires
reductions in agricultural protection
To be meaningful for the world’s poor, the
Doha Round must bring reductions in agricul-
GLOBAL ECONOMIC PROSPECTS 2004
104
tural protection around the world. The benefits
of global liberalization in agriculture—elimina-
tion of all border barriers and subsidies—are
estimated to be very large for industrial and de-
veloping countries alike, topping $350 billion
for the world. With liberalization, agricultural
production would marginally shift from North
to South, and the highly depressed world prices
for many commodities would increase: 10–20
percent for cotton, 20–40 percent for dairy
products, 10–20 percent for groundnuts, 33–90
percent for rice, and 20–40 percent for sugar
(Beghin and Aksoy 2003). The impact of these
price changes on low-income net importers
would be small and manageable. To date, how-
ever, many of the proposals designed to elicit
consensus on agricultural reform are modest.
The average applied tariffs in the Quad coun-
tries would be halved at best under such pro-
posals. Tariff peaks would remain above 100
percent for many countries. The outcomes for
developing countries are even less significant.
For most of them, the cuts required by one
prominent proposal would leave their bound
tariffs above their current applied rates, and tar-
iff escalation and peaks would still be very high.
A serious agreement to reduce border pro-
tections would produce benefits for the
world’s poor that far exceed those that can be
anticipated from present levels of develop-
ment assistance. A first order of business is to
create a more transparent and simpler trade
regime in all countries by converting specific
tariffs to ad valorem tariffs, eliminating mini-
mum price regulations, cutting peak tariffs,
changing the structure of TRQs so they in-
crease over time, and introducing a transpar-
ent system of reallocation to more efficient
producers. Rich countries should phase out
export subsidies and subsidies that encourage
overproduction, both of which are directly
prejudicial to poor farmers around the world.
These reforms would also make the agri-
culture in industrial countries more efficient,
environmentally sustainable, and more sup-
portive of the small family farms. The experi-
ence of New Zealand, the only OECD country
to reform fully, clearly demonstrates that agri-
culture without support can be more dynamic
and efficient.
Finally, along with greater market access,
low-income countries need help in eliminating
behind-the-border barriers, especially the seg-
mentation of their rural markets. Those mar-
kets should be linked to wider markets at
home and abroad (box 3.1).
Poverty, rural households,
and trade in agriculture
Agriculture is the livelihood of the
world’s poor
Growth in agriculture has a disproportionate
effect on poverty because more than half of
the population in developing countries resides
in rural areas.
1
Some 57 percent of the devel-
oping world’s rural population live in lower-
middle-income countries; 15 percent in the
least developed countries (LDCs).
2
Although
most of the world’s poor countries are in Sub-
Saharan Africa, they account for about only
12 percent of developing world’s rural popu-
lation, whereas Asia accounts for 65 percent.
Using the $1-a-day measure of poverty,
most of the world’s poor live in India, China,
and other lower-middle-income countries
(table 3.1). National poverty data—which
allow separation of rural and urban household
information but are not available for all coun-
tries—yield results that are very similar to
those obtained using the $1-a-day measure.
They show that four countries—India, Bangla-
desh, China, and Indonesia—account for 75
percent of the world’s rural poor. It is in Asia,
therefore, that rural income growth will have
the greatest impact on rural poverty.
Poverty is more common in rural areas
In countries for which separate rural and
urban income data are available, 63 percent
of the population, and 73 percent of the poor,
live in rural areas. This is true for all regions.
A high incidence of rural poverty is found in
all developing countries, whatever their level of
income. More of the population is poor in low-
AGRICULTURAL POLICIES AND TRADE
105
income countries, however, and in the LDCs
the poverty rate for rural households reaches
almost 82 percent (table 3.2). The rural share
of the total number of poor households is de-
clining with urbanization. Still, with current
trends, the rural share of the global number of
poor will not fall below 50 percent before
2035 (Ravallion 2000).
Most poor countries are very dependent
on agriculture for household income. In Ethio-
pia and Malawi, for example, about three-
quarters of household income is derived from
agricultural activities, mainly subsistence farm-
ing. But cash income is also crucial (table 3.3).
Whether derived from cash (export) crops or
other sources, cash income allows farmers to
GLOBAL ECONOMIC PROSPECTS 2004
106
Table 3.1 Most of the world’s poor live in rural areas outside the least developed countries
Distribution of poor in developing countries (1999)
Percentage Poverty headcount,
Population in millions (2001) of world’s under $1/day in 1999
Percent rural
National Rural Urban rural population (percent) (millions)
Least developed
countries 596 443 153 74 15 49 292
Other low income 839 501 338 60 17 26 218
Middle income
a
1,435 478 957 33 16 8 114
China 1,272 805 467 63 27 18 226
India 1,032 745 288 72 25 35 358
Total 5,175 2,972 2,203 57 100 23 1,209
a. Excluding China and India.
Source: World Bank data.
P
overty in rural areas of low-income countries is
closely correlated with distance to local and na-
tional markets. In addition to geographic distance,
the concept of distance to market includes various
costs of moving goods to and from markets.
Case studies in Armenia, Malawi, and Nepal
show that reductions in transportation costs bring
strong gains in household welfare for individual
farmers. Among these households, the poorer ones
benefit disproportionately because transportation
costs make up a larger percentage of their household
expenditures.
Case studies in Ethiopia and Guinea reveal that
many of the poor will be left behind by trade reform
if no improvements are made in domestic markets.
In Ethiopia, for example, 80 percent of the poor
would benefit from freer trade under conditions of
full market participation and price transmission, but
Box 3.1 The impact of national trade integration and
reform on poverty
only 55 percent would benefit without these condi-
tions. Without improvements in the functioning of
local and national markets, economic gains for the
poor may reach only one-fourth of their potential.
A case study in Madagascar illustrates that
improvements in trade policies may not be sufficient
to restore sustained growth in the agricultural sector
without better transport infrastructure and other re-
forms. In Madagascar, where poverty is closely related
to remoteness, defined to include lack of infrastructure
and access to basic services, integrating the poor into
regional markets and the national economy will make
a real contribution to increasing their incomes. In the
absence of integration, economic growth will tend to
benefit those who are already favored.
Source: Kudat, Ajwad, and Sivri (2003).
buy inputs—such as fertilizers—that increase
food-crop yields, lowering the incidence of
poverty and malnutrition.
The share of nonfarm income in rural
households increases with a country’s level
of development. In Mexico, for example, the
share of farm income in total rural income is
much lower than in Ethiopia and Malawi. In-
comes from farming are complemented by
other sources, so that the direct impact of agri-
cultural price and output variations have a
much smaller impact on rural households. In
industrial countries, when a broad definition
of farm households is adopted, the share of
farm income declines even further. Other
sources of income include salaries and wages
from other activities; investment income such
as interest, dividends, and rents; and social
transfers from health, pension, unemployment,
and child-allowance schemes.
Farmers in industrial countries earn
above-average incomes
In many industrial countries, the average in-
comes of farmers are higher than the national
average, reaching almost 250 percent of aver-
age income for the Netherlands, 175 percent
for Denmark, 160 percent for France, and 110
percent for the United States and Japan. In
most other countries, the level of income is
either equal to or marginally lower than the
average income (OECD 2002d). In lower in-
come OECD countries such as Greece, Korea,
and Turkey, rural incomes are lower—around
75–80 percent of urban incomes.
As countries become wealthier, the share of
rural household income from nonfarm sources
rises. Off-farm income for major field crops in
the United States, for example, is more than ten
times greater than farm income and eight times
greater than government payments (table 3.4)
Government payments exceed what U.S. farm-
ers make from the market in farming. In fact,
most farms lose money from farming alone.
3
Of agricultural subsidies, only half reaches
farmers, and most goes to the richest
Agricultural protection in industrial countries
helps the relatively better-off rural house-
holds—and it does so very inefficiently.
4
Ac-
AGRICULTURAL POLICIES AND TRADE
107
Table 3.3 Even in subsistence economies,
cash is important
Percentage of total household income derived from various
sources in rural areas, 1990s
Ethiopia Malawi Mexico
Total agricultural income 77 76 24
Agricultural cash income 18 16 21
Subsistence farming 59 60 3
Transfers 16 7 13
Wages 3 8 42
Other 4 9 21
Total 100 100 100
Source: World Bank household data.
Table 3.2 Rural poverty is higher in poorer
countries
Share of national population and of poor living in rural areas
(percent)
Sample
a
All developing
Share of rural
countries
Rural dwellers who Rural
dwellers are poor dwellers
Upper middle
income 19 37 22
Lower middle
income 64 72 61
Low income 65 74 60
Least developed 76 82 68
All developing
countries 63 73 56
a. Sample consists of 52 countries for which separate rural
and urban income data are available.
Source: World Bank data.
Table 3.4 U.S. farmers earn less from
farming than from other sources
Shares of U.S. farmers’ income from various sources
(billions of dollars)
Income source Value
Farming 11.6
Government payments 14.7
Off-farm activities 122.7
Source: USDA, “Agricultural Income and Finance Outlook,”
September 26, 2002.
cording to OECD estimates, agricultural sup-
port policies deliver additional income to farm
households at a rate of 50 percent or less of the
amounts transferred from consumers and tax-
payers for support purposes (OECD 2002e).
In the case of market price support and defi-
ciency payments, the share is one-fourth or
less; for input subsidies, less than one-fifth.
Only one-quarter of every dollar of producer
support actually finds its way into the pro-
ducer’s pocket—the rest goes to input suppliers
and owners of other factors of production
(OECD 1999, De Gorter 2003). The most im-
portant outcome of these programs is that they
lead to much higher land prices.
The largest farm operations, which gen-
erally are also the most profitable and the
wealthiest, receive most of the benefits of sup-
port systems. In the United States, the largest
25 percent of farms have average gross farm re-
ceipts of more than $275,000 and average farm
net worth of more than $780,000. They receive
89 percent of all support—in part because they
produce a similar share of output. The remain-
ing 1.6 million U.S. farms on average receive
little support. Through the lens of household
income surveys, the story is similar: At one ex-
treme, farm households with an average in-
come of $275,000 received payments averaging
$32,000. At the other end of the spectrum,
farm households with incomes averaging
$13,000 received $2,200 in program payments.
In the European Union, where farm num-
bers and structures differ somewhat, the distri-
bution of support is not markedly different.
The largest 25 percent of farms have average
gross farm receipts of more than €180,000 and
average farm net worth of almost €500,000.
They produce 73 percent of farm output and
receive 70 percent of support. Farms of the
next largest size have much smaller gross farm
receipts, averaging just over €43,000, and av-
erage farm net worth of about €230,000. They
produce 17 percent of output and receive 19
percent of support payments. The remaining 2
million EU farms produce little, receive little
support, but have a sizeable average farm net
worth. In Japan and Canada, the largest 25
percent of farms receive 68 percent and 70 per-
cent of support payments, respectively.
In short, the subsidy programs prominent in
current food and agriculture policy are not tar-
geted to keeping small, struggling family farms
in business but instead provide hefty rents
to large farmers. Nor are current production-
based policies effective in achieving their vari-
ous other objectives (such as environmental
sustainability and rural development). By in-
creasing land prices they also lead to the
creation of larger farms and the elimination of
small family farms. Meanwhile, their unin-
tended spillover effects on global markets, and
on other countries, are large and negative.
At the most general level, it is probable that
agricultural protection in rich countries wors-
ens global income distribution. First, farmers
in the North earn more on average than their
own national averages. Second, the lion’s share
of farm aid goes to the largest and wealthiest
farmers. At the other end of the global distribu-
tion spectrum, more of the poor tend to live in
rural areas, and protection in rich countries
tends to depress prices and demand for their
goods.
International markets are important to
sustained income growth in developing
countries
When subsidies depress prices the impacts in
poor countries can be severe. To illustrate the
impact of commodity price changes, Minot
and Daniels (2002) used household income
data to estimate the potential impact of cotton
price declines in Benin and tobacco price de-
clines in Malawi, the major export crops of
those two countries. Cotton prices have de-
clined by almost 40 percent over the last few
years. In Benin, a poor country, the impact of
this decline in world cotton prices, if it were
fully passed on to farmers, would reduce over-
all welfare in rural areas by 6–7 percent and
that of cotton farmers by about 19 percent.
The richest quintile of households, meanwhile,
would experience a decline in income of 4 per-
GLOBAL ECONOMIC PROSPECTS 2004
108
cent. Thus this price change alone would in-
crease the poverty rate in Benin by up to 8 per-
centage points (depending on the simulations),
from 40 percent to 48 percent.
Tobacco constitutes about 80 percent of
Malawi’s exports. A 30 percent decrease in
world tobacco prices over the last few years
has reduced the income of small growers by an
average of 8 percent. The poorest quintile has
lost about 13 percent, the richest 7 percent.
For a typical farmer, the annual net returns
from tobacco, the country’s most profitable
crop, declined from $108 to $26 (Integrated
Framework 2003). These rough estimates un-
derstate the overall impact of the price de-
clines, however, because cash incomes allow
farmers to purchase inputs, such as fertilizer
and pesticides, that increase the yields for their
subsistence crops and have a significant impact
on their levels of poverty and malnutrition.
The importance of the global market goes
beyond price changes. For countries with a rel-
atively small urban population, agricultural ex-
ports can produce faster growth than can do-
mestic market demand—however fast domestic
demand might be growing. In such cases, the
international market provides growth opportu-
nities without the constraint of sharply lower
prices, which often accompany an increase in
agricultural production. Although food pro-
duction for home consumption and the domes-
tic market accounts for most agricultural pro-
duction in the developing world, agricultural
exports and domestic food production are
closely related. Export growth contributes sig-
nificantly to the growth of nonexport agricul-
ture by providing cash income that can be used
to modernize farming practices. For those leav-
ing the farm, growth and modernization of
agriculture create jobs in agricultural process-
ing and marketing.
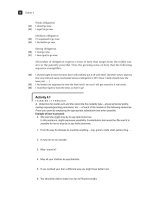
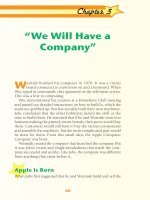
On balance, cash-crop income complements
and enhances food production, particularly in
poorer countries where opportunities to earn
nonfarm income are more limited (figure 3.1)
(Watkins 2003; Von Braun and Kennedy 1994;
Minot and others 2000).
Trade and export growth
in agriculture
T
he last two decades were periods of very
rapid growth in exports from developing
countries to other developing countries and to
the industrialized world (table 3.5). Growth in
the world economy accounts for some of this
export growth, but lower trade barriers, im-
proved supply capabilities, and increases in
specialization are more important. The rapid
growth in exports was true both in manufac-
turing, where levels of protection have been
reduced significantly, and in agriculture,
where significant protection remains. Never-
theless, manufacturing export growth rates
were much higher.
Agricultural trade makes up a growing
share of trade among developing
countries, but agricultural export shares
to rich countries are stable
Although developing countries’ exports accel-
erated during the 1990s, agricultural exports
AGRICULTURAL POLICIES AND TRADE
109
Figure 3.1 Countries that produce more
cash crops also produce more food
Annual growth rates of food and cash crop production in
25 countries having agricultural output equal to at least
15 percent of GNP, 1980–2001 (percent)
0
–.05 0 .05
Cash crop production growth rate
.1 .15
.02
.04
.06
nga
ben
tgo
chd
ida
ind
civ
kny
mdg
myr
sen
car
cam mlw
npl
bng
gmb
tnz
mli
ngr
zmb
zmb
pak
bfa
gha
did not keep pace with manufactured exports,
largely because agricultural export growth ac-
celerated only to the other developing coun-
tries (table 3.6).
5
Developing countries increased their share
of global manufacturing exports from 19 per-
cent in 1980–81 to 33 percent in 2000–01. Ex-
panding trade among developing countries
contributed to the gain in share, but higher
exports to industrial countries also played a
significant part. In agriculture, by contrast, the
developing countries maintained, but did not
expand, their one-third share of world agri-
cultural trade over the last two decades. The
steady decline in the developing countries’ share
of agricultural exports to industrial countries
over the period was counterbalanced by an in-
crease in their share of exports to other devel-
oping countries. In other words, the significant
deceleration of nominal import growth in in-
dustrial countries, from 5.4 percent annually
during the 1980s to 1.9 percent in the 1990s,
was offset by the increase in import growth in
developing countries, which increased from 3
percent annually to 6 percent.
Product trends differ
What accounts for the shift in markets for the
agricultural exports of developing countries?
Price changes alone do not appear to explain
it (box 3.2). Static markets in industrial coun-
tries for traditional developing-country prod-
ucts such as coffee and tea probably contri-
buted to declining import growth rates, as did
the decline in GDP growth rates, combined
with low elasticity of demand.
6
To explore the phenomenon further, we sep-
arated agricultural exports into four sub-
groups. The first consists of mostly tropical,
developing-country products such as coffee,
GLOBAL ECONOMIC PROSPECTS 2004
110
Table 3.6 South-South exports in agriculture are rising as South-North export shares fall
Share of global agricultural and manufacturing exports by source and destination, 1980–2001 (percent)
Developing countries Industrialized countries
1980–81 1990–91 2000–01 1980–81 1990–91 2000–01
Agriculture exports 35.9 32.9 36.9 64.1 67.1 63.1
To developing 9.9 9.2 13.7 15.3 11.9 14.7
To industrialized 26.0 23.7 23.2 48.8 55.3 48.4
Manufacturing exports 19.3 22.7 33.4 80.7 77.3 66.6
To developing 6.6 7.5 12.3 21.7 15.2 19.0
To industrialized 12.7 15.2 21.1 59.0 62.1 47.6
Source: COMTRADE.
Table 3.5 Manufacturing exports grew much faster than agricultural exports
Export growth rates (percent)
Developing countries’ export growth rates
World export growth rates Total Developing to developing Developing to industrialized
1980–81 to 1990–91 to 1980–81 to 1990–91 to 1980–81 to 1990–91 to 1980–81 to 1990–91 to
1990–91 2000–01 1990–91 2000–01 1990–91 2000–01 1990–91 2000–01
Agriculture 4.3 3.6 3.4 4.8 3.6 7.8 3.4 3.3
Manufacturing 5.9 4.8 7.6 8.9 7.3 10.0 7.8 8.3
Note: Manufacturing exports are deflated by the U.S. purchasing parity index (PPI) for finished goods less food and energy. Agri-
culture exports are deflated by the U.S. PPI for farm products.
Source: COMTRADE.
cocoa, tea, nuts, spices, textile fibers, and sugar
and confectionary products. The second is
made up of temperate products highly pro-
tected in industrial countries—meats, milk and
products, grains, animal feed, and edible oil
and oilseeds. The third category is the dynamic
nontraditional products: seafood, fruits, veg-
etables, and cut flowers. The last category in-
cludes other processed agricultural products,
such as tobacco and cigarettes, beverages, and
other processed foods.
Import growth rates in industrial countries
declined across all groups, while the opposite oc-
curred in developing countries (figure 3.2). But
changes in demand are only part of the picture.
In attributing causes to differential growth
rates, it is important to consider the relative
roles of demand growth and market-share
gains in export growth. When growth in ex-
ports of manufactures (including processed
food) to industrial countries is decomposed be-
tween demand and market share, only 21 per-
cent of developing countries’ export growth
appears to have been caused by demand in-
creases. The other 79 percent was caused by
changes in market share (box 3.3). Limited
raw-commodity information collected by
OECD does not show any significant change in
import-penetration ratios in OECD countries
over the last decade (OECD 2001). Mean-
while, the developing countries gained market
share in every manufacturing subsector—ex-
cept food processing. The protection rates for
food processing in industrial countries are ex-
tremely high—far above those of any other
manufacturing subsector.
AGRICULTURAL POLICIES AND TRADE
111
I
n nominal terms, export growth in agricultural
products decelerated significantly during the
1990s. Can the slowdown be attributed to the price
declines observed in the late 1990s? The existing
price series for agricultural commodities have certain
limitations. Most of the standard series are based on
raw commodities that constitute a much smaller per-
centage of the global trade flows. In most cases they
exclude seafood, fruits, and vegetables—now the
largest trade items. For the purposes of this chapter
Box 3.2 Did agricultural exports slow down solely
because of falling prices?
the authors tried several alternatives to compensate
for these limitations. The unit-value indices from
trade data gave inconsistent results and were elimi-
nated, leaving three series, one from the U.S. pur-
chasing parity index (PPI) series for farm products,
which includes all products, and two from raw com-
modity indices. One of the latter uses world trade
weights; the other, developing-country export
weights. The behavior of the three indices over the
last two decades is shown in the table below.
1980–81 to 1990–91 1990–91 to 2000–01
U.S. farm products PPI 4.7 –6.8
Raw commodities (world trade weights) –8.3 –6.6
Raw commodities (developing countries’ weights) –22.7 –15.2
If the U.S. PPI is used, a small fraction of the
nominal changes in trade flows in the 1990s can be
attributed to price declines in the 1990s. Raw com-
modity indices show that the price declines were
greater in the 1980s, and if they are used to deflate
the nominal exports, the deceleration would be ac-
centuated. For that reason, the U.S. food products
PPI was used to deflate aggregate exports.
The evolving structure of trade: toward
nontraditional products with lower rates
of protection
World trade has moved away from traditional
export commodities to other categories of
goods. This is true of both developing and in-
dustrial countries. The product groups that
gained significantly between 1980–81 and
2000–01 are fruits, vegetables, and cut flowers
(19 percent); fish and seafood (12.4 percent);
and alcoholic and nonalcoholic drinks (8.7
percent). Although products in these categories
tend to have high income elasticities, they also
enjoy lower rates of protection in industrial
and large developing countries. Product groups
that showed significant declines during the pe-
riod were grains (14.3 to 9.5 percent); coffee,
cocoa, and tea; sugar and sugar products; and
textile fibers—all of which are among the tra-
ditional exports of developing countries. The
declines were caused by a combination of price
declines, low demand elasticities, and—in the
case of sugar, grains, meats, and milk—high
rates of protection and expanded production
in industrial countries.
While moving away from traditional ex-
ports and into expanding subsectors, develop-
ing countries also have marginally expanded
their exports of temperate products (grains,
meats, and milk)—but mostly to other devel-
oping rather than industrial countries. These
important developments will require changes
in how developing countries’ agricultural trade
is conceived and analyzed (figure 3.3).
Their trade gains have brought more devel-
oping countries up against rising food safety
standards in the developed world. Meeting
such standards has a cost—not just in compli-
ance, but also in documenting that compliance.
This cost can be repaid in the form of higher
trade. Various mechanisms exist to help devel-
oping countries rise to the standards (box 3.4).
Industrial-country export structures also
have changed. Exports of protected products
have declined, whereas those of beverages,
fruits, and vegetables have grown. These
changes are discernible despite the fact that
intra-EU trade is included in the global export
data. One cause of the change is that greater
domestic production of protected products
has made many industrial countries more self-
sufficient in those products, reducing trade.
As a group, developing countries lost ex-
port market share during the 1980s, but
GLOBAL ECONOMIC PROSPECTS 2004
112
Figure 3.2 Import growth rates of nontraditional export commodities decreased in industrial
countries but increased in developing countries
a. Industrial countries
Import growth rates (nominal USD, percent per annum)
b. Developing countries
Import growth rates (nominal USD, percent per annum)
Tropical
products
Temperate
products
Seafood,
fruits,
vegetables,
and flowers
Other
processed
products
Total Tropical
products
Temperate
products
Seafood,
fruits,
vegetables,
and flowers
Other
processed
products
Total
0
1981–1991
1981–1991
1991–2001
ᮡ
ᮡ
ᮡ
ᮡ
1991–2001
1
2
3
4
5
6
7
8
9
10
0
1
2
3
4
5
6
7
8
9
10
Source: COMTRADE.
AGRICULTURAL POLICIES AND TRADE
113
M
ost market-share analysis has not looked into
the shares of exports from developing coun-
tries in the consumption of industrial countries.
Below are estimates of developing-country exports in
the domestic consumption and production of
Canada, Germany, Japan, and the United States,
which together absorb about 70 percent of develop-
ing countries’ manufactured exports to industrial
countries.
The table below shows the shares of exports
from developing countries in the four countries’
total absorption (demand) and the growth of exports
from developing countries. Absorption is estimated
as gross production minus exports, plus imports.
Box 3.3 Decomposing export growth in manufacturing
Gross production data in the three non-U.S. coun-
tries have been converted to U.S. dollars at current
exchange rates. Because the U.S. dollar appreciated
significantly against the currencies of the other three
countries in the late 1990s, this conversion underesti-
mates domestic production and demand growth. It
also overestimates the share of imports, which are
denominated in U.S. dollars.
Demand change is estimated assuming a constant
share of exports in domestic demand between the two
time periods; that is, market shares do not change.
The market share changes are then estimated as the
difference between the actual export growth and the
export growth under a constant market share.
Developing countries increased their share of industrial countries’ manufacturing imports—
largely by increasing their market share, 1991–99 (percent)
Share of developing countries’
Export growth due to
exports in domestic demand
Growth in exports Change in Change in
1991 1999 from developing countries demand market share
Canada 4.51 7.64 117.25 28.16 89.08
Japan 2.24 4.38 95.04 –0.25 95.29
United States 5.10 9.04 169.42 51.99 117.43
Germany 7.44 8.91 18.31 –1.22 19.53
Total 4.46 7.63 110.90 23.38 87.52
Sources: UNIDO, COMTRADE. Using UNIDO and COMTRADE data, UNCTAD estimated these ratios until
1995. UNIDO’s coverage in terms of gross production has become more limited since 1995.
The relationship between domestic demand
growth in industrial countries and export growth
from developing countries is relatively weak. Market
share gains caused by the restructuring of global
production are a much more powerful factor.
Between 1991 and 1999, exports of manufac-
tures from developing countries to these four coun-
tries increased by about 139 percent, compared to
about 60 percent for world trade, while the total
increase in domestic demand was only 29 percent.
The rest of the export growth was a result of the
increases in market shares of developing country
exports in industrial-country markets. A change of
one percentage point in absorption shares during
the decade would increase exports from developing
countries by approximately 28 percentage points,
equal to the total absorption growth over the decade.
The same conclusion holds true for the 15
three-digit ISIC subsectors that range from very cap-
ital intensive (rubber and glass) to very labor inten-
sive (garments and footwear).
The only subsector in which demand growth
was greater than the market share gains, and in
which the developing countries lost market share,
was food processing. In that subsector, the market
share of developing countries declined from 2.42
percent in 1991 to 2.40 percent in 1999. Why?
Food processing enjoyed the greatest protection of
any subsector, and protection did not decline over
the last decade. Because a large portion of agricul-
tural exports are classified under food processing,
protection of the subsector explains part of the de-
celeration of agricultural exports from developing to
industrial countries during the 1990s.
Source: Aksoy, Ersel, and Sivri (2003).
reversed that trend in the 1990s (table 3.7).
Modest expansion in the 1990s brought them
back to where they had been in the early
1980s. Global gains were made by middle- and
low-income countries, mostly to other devel-
oping countries. China is an exception to this
trend, having increased its export shares in all
markets. Even in the 1990s low-income coun-
tries continued to lose market share in their
exports to industrial countries, making up
the loss by expanding their export shares in
developing-country markets. In tropical prod-
ucts, where global shares declined, low-income
countries increased their shares to the other
developing countries.
The LDCs lost export market share in both
markets during both decades. Unlike other de-
veloping countries, they have not been able to
make up their market-share losses in tropical
products by expanding their shares in the
growing subsectors: seafood and fruits and
vegetables. Their only gains have come in sea-
food, and much of the expansion has come
from industrial-country vessels fishing in their
waters. In highly protected products, South-
South trade has expanded, possibly as a result
of regional trading arrangements.
Global agricultural protection:
The bias against development
Progress in the Uruguay Round was more
formal than real
Since the 1980s, two important developments
have occurred in agricultural trade policy.
First, most developing and a few industrial
countries have made major reforms in their
protection regimes involving unilateral and re-
gional reductions in tariffs and quotas. For
example, unilateral reforms in the 1990s ef-
fectively eliminated export taxation in most
developing countries. Average tariffs have
declined rapidly, while other import restric-
tions, such as foreign exchange allocations for
imports, have effectively disappeared (World
Bank 2001). Manufacturing tariffs dropped
more than agricultural tariffs. In at least one
way, agricultural protection expanded: Many
middle-income countries began subsidizing
their agricultural products.
Second, the Uruguay Round Agreement
on Agriculture brought agricultural trade into
WTO disciplines. Before Uruguay, agricultural
products had no bound tariffs, and tariffs often
were supplemented by nontariff measures such
GLOBAL ECONOMIC PROSPECTS 2004
114
Figure 3.3 Developing countries’ exports of nontraditional products have surged, but
industrial countries’ exports have changed little
a. Developing countries
Percent of developing country exports
b. Industrial countries
Percent of developing country exports
Tropical
products
Temperate
products
Seafood,
fruits,
vegetables,
and flowers
Other
processed
products
Tropical
products
Temperate
products
Seafood,
fruits,
vegetables,
and flowers
Other
processed
products
Source: COMTRADE.
0
10
20
30
40
50
60
1981
1991
2001
ᮡ
ᮡ
ᮡ
0
10
20
30
40
50
60
1981
1991
2001
ᮡ
ᮡ
ᮡ
AGRICULTURAL POLICIES AND TRADE
115
A
gricultural trade is shifting toward high-value,
perishable commodities such as fresh fruits, veg-
etables, meats, and fish. With this change have come
consumer concerns over food safety. In response,
governments and private companies have developed
a growing array of rules, regulations, and standards.
Some fear that these standards will be used by high-
income countries as a tool of trade protection.
Some developing countries have risen to the
higher standards. Kenya’s exporters send fresh veg-
etables and salad greens by air freight to major
European supermarket chains. In that industry, food
safety standards have accelerated the adoption of
modern supply-management techniques and stimu-
lated public-private collaboration (Jaffee 2003).
Many developing-country suppliers, however, will
not be able to meet the more stringent standards
without technical advice, upgraded production and
processing facilities, better enforcement of standards,
and closer working relationships with importers in
high-income countries.
Box 3.4 Food safety standards: From barriers
to opportunities
Nearly all of the cases of allegedly protectionist
use of food safety measures brought before the WTO
have involved trade between developed countries
over issues such as hormone residues in meat and ge-
netically modified foods. Although some food-import
bans have been heavily publicized, their application
against developing countries is quite rare and typi-
cally has involved complementary rather than com-
petitive products. However, some evidence suggests
that developing countries employ safety regulations
as a protectionist measure against other developing
countries.
The available evidence suggests that most food-
safety-related problems that developing-country ex-
porters encounter are well within their capacities to
resolve. According to data from the U.S. Food and
Drug Administration, most detentions of developing-
country food products involve labeling violations or
very basic problems of food hygiene—and thus of
quality assurance (see table). No firm can operate
long without addressing such problems.
Even for more complex food safety issues, de-
veloping countries have room to maneuver. An array
of strategies exists to help them meet product and
process standards for international markets. Espe-
cially in middle-income countries, the good manu-
facturing practices and good agricultural practices
long demanded by overseas customers and con-
sumers are now being demanded by discerning
domestic consumers as well. They are well within
producers’ reach.
The European Union lays down harmonized
hygiene requirements governing the catching, pro-
Detentions by U.S. Food and Drug Administration of imports from developing
countries 1997 and 2001 (percent)
Latin America and Asia India
Reasons for contravention the Caribbean 1996–97 1996–97 2001
Food additives 1.4 7.4 7.4
Pesticide residues 20.6 0.4 1.9
Heavy metals 10.7 1.5 0.6
Mold 11.9 0.8 0.4
Microbiological contamination 6.2 15.5 15.3
Decomposition 5.2 11.5 0.3
Filth 31.4 35.2 26.4
Low acid canned food 3.6 14.3 4.1
Labeling 5.0 10.8 15.7
Other 1.7 2.6 27.8
Total 100.0 100.0 100.0
Total number 3,985 5,784 2,148
Source: USFDA.
(Continues on next page)
GLOBAL ECONOMIC PROSPECTS 2004
116
cessing, transportation, and storage of fish and fish-
ery products. Processing facilities must be inspected
and approved by a specified authority in the country
of origin. Countries whose local requirements have
been found by the Commission to be at least as strin-
gent as those in the European Union and for which
specific import requirements have been established
are placed on “List I” and enjoy reduced physical in-
spection at the border.
Between 1997 and October 2002, the number of
countries achieving List 1 status increased from 27 to
72. More than half are low-income or lower middle-
income countries; half of these are low-income
African countries. Another 35 countries are on List
II, including the United States (Henson and Mitullah
2003).
Food safety compliance costs can include the
cost of adjusting production and processing facilities;
the recurrent costs to implement food safety manage-
ment systems; and the costs of certification, monitor-
ing, and enforcement. Relatively few estimates are
available on the magnitude of these costs. When a
country is already exporting high-valued foods, com-
pliance may require only incremental production
changes and public-sector oversight. However, for
other suppliers the costs of reaching internationally
competitive levels may be high. The Bangladeshi
shrimp industry invested an estimated $18 million
in the latter half of the 1990s to upgrade fish-
processing facilities and product-testing laboratories,
and to make other changes in response to repeated
quality and safety detentions on exports to the Euro-
pean Union and the United States. However, these
expenditures have been rewarded with rapidly in-
creasing (and better priced) shrimp exports—which
totaled $296 million in 2000 (Cato and others
2000).
Standards can also be a barrier to trade. Con-
sider the case of camel milk cheese exports to the EU.
Tiviski SARL, a dairy processor in Nouakchott, Mau-
ritania, developed a technology to produce “pate
molle” cheese from camel milk. It obtained the milk
from nomad milk producers who were very poor. In
return, Tiviski provided the producers with cheap ac-
Box 3.4 (continued)
cess to credit and vaccinated their animals to ensure a
supply of healthy milk. The camel cheese, after trans-
port and production costs, was priced at $10 per
kilogram in the EU. After winning a prize at a trade
fair, the cheese soon found its way into elite stores
like Harrods in London and Fauchon in Paris. How-
ever, it proved to be difficult to find the correct tar-
iff line for the product, and grouping it with “other
dairy, cheese” exposed it to a much higher tariff than
regular cheese. To make matters worse, the EU soon
decided to abolish imports of camel cheese from
Mauritania, arguing that the presence of “hoof and
mouth” disease in Mauritania could be transmitted
from camels to other livestock, even though there is
no real evidence that camels are capable of spreading
the disease. The EU then imposed another restriction:
camel cheese could indeed be imported—but only if
mechanical methods were used to obtain milk used
in its production—an unworkable proposal for the
low-income milk producers who were located miles
away from major ports. Mauritania did not dispute
this case at the WTO because of the sheer costs in-
volved—costs that were not justified for exports of
$3 million to $5 million worth of cheese per year.
Catfish producers in Vietnam have had similar
difficulties accessing the American market, initially
because of labeling rulings (and then later because
of anti-dumping judgments; see box in Chapter 2).
The emerging set of international and developed-
country food safety standards present challenges for
many exporters in developing countries. Concerted ef-
forts to address basic hygiene and quality-assurance
requirements and to provide relatively simple train-
ing for farmers could go a long way in ensuring com-
pliance with most official food safety standards. In
circumstances where compliance requires greater in-
vestment—both by the public and private sectors—
partnerships between developed and developing coun-
tries and among developing countries may fill the bill.
Beyond this, the public has to remain vigilant that
standards do not become misused as instruments of
protection.
Source: World Bank staff.
as import quotas or bans, quantitative restric-
tions, variable levies, and monopoly purchas-
ing by state-owned or other companies. Import
barriers were coupled with the widespread use
of production-related subsidies, such as price
supports, which often led (and still leads) to
increases in production above the level of mar-
ket equilibrium. Excess production had to be
stockpiled or exported, sometimes with the
help of further subsidies. With the intention of
aligning agricultural trade rules with those ap-
plying to trade in other goods, the Uruguay
Round negotiators agreed that all import barri-
ers, other than those in place for health and
safety reasons, should take the form of transpar-
ent tariffs. Before agreeing on tariff reductions,
all border measures had to be converted into
their tariff equivalents—a process known as
“tariffication.”
The conversion of nontariff measures into
tariffs was generally done using the price-gap
method—the gap being the difference between
domestic and world market prices. After es-
tablishing the tariff equivalent of an import re-
striction, reductions were applied from bound
tariffs. Developed countries reduced their tar-
iffs by an average of 36 percent and a mini-
mum of 15 percent over six years; developing
countries by an average of 20 percent and a
minimum of 10 percent over ten years. The
agreed reductions were simple averages, not
weighted for the volume of trade, so some
countries made large reductions in tariffs that
were already low—for example, achieving a
50 percent reduction by dropping a tariff from
2 percent to 1 percent—or in areas of low sen-
sitivity, while making only the minimum re-
duction in sensitive product areas. The Round
offered limited opportunities to make mini-
mum import commitments for certain prod-
ucts instead of adopting tariffs on them. The
minimum import option was taken by Japan,
Korea, and the Philippines for rice, and by Is-
rael for certain sheep and dairy products. (Ja-
pan has since tariffied rice imports.)
Once a tariff was established, bindings and
reductions were negotiated. In cases where
tariffs were high, or where quotas had been al-
lowed in some imports, minimum and current
market-access opportunities were also negoti-
ated. The typical result was the establishment
of a minimal tariff rate for a limited volume of
imports—called a tariff rate quota (TRQ).
With the removal of nontariff measures,
some countries worried that they would not be
able to prevent surges in import volumes or
falling import prices. To allay these concerns,
negotiators agreed that a special agricultural
safeguard could be applied to certain products.
The Uruguay Round yielded no meaningful
reduction in protection in industrial countries.
In many cases, in fact, protection may have in-
creased as a result of so-called dirty tariffica-
tion (Nogues 2002, Ingco 1997). Continued
protection has led to greater import substitu-
tion, while the geographical restructuring of
production that occurred in manufacturing
did not occur—at least not to the same de-
AGRICULTURAL POLICIES AND TRADE
117
Table 3.7 Developing countries have shared unequally in export market gains
Export shares of food and agricultural products by income level (as percentage of total world trade)
Exports to industrial countries Exports to developing countries Total exports
Income level 1980–81 1990–91 2000–01 1980–81 1990–91 2000–01 1980–81 1990–91 2000–01
Industrial 48.8 55.3 48.4 15.3 11.9 14.7 64.1 67.1 63.1
Middle-income* 19.6 18.4 17.0 7.3 6.4 9.8 26.9 24.8 26.8
Low-income 5.2 3.4 3.4 1.4 1.3 2.0 6.5 4.8 5.4
of which LDCs 1.6 0.8 0.7 0.7 0.4 0.5 2.3 1.3 1.1
China 0.7 1.3 2.1 0.9 1.2 1.4 1.7 2.5 3.5
India 0.5 0.5 0.6 0.3 0.3 0.5 0.8 0.8 1.1
Total 74.9 78.9 71.6 25.1 21.1 28.4 100.0 100.0 100.0
* Excluding India and China.
Source: COMTRADE.
gree—in agriculture. Review of the experience
to date with the new rules on market access,
export subsidies, and domestic support indi-
cates that the effects of implementation of the
Uruguay Round Agricultural Agreement have
been modest. The reasons include weaknesses
in specific aspects of the agreement, such as
high baseline support levels from which re-
ductions were made. In some countries, in-
cluding the United States, reforms undertaken
before the negotiations were adequate to ful-
fill the new rules on reducing domestic sup-
port (OECD 2001).
Today, protection in agriculture takes dif-
ferent forms—tariff protection, subsidies, tar-
iff peaks, TRQs, tariff escalation, and opaque
tariffs. In reviewing these forms, the following
section makes two fundamental points:
• First, the various forms of protection are
often linked. For example, goods pro-
duced behind high tariff walls and with
production subsidies often require export
subsidies to be sold in the world market.
That said, border barriers are more im-
portant than subsidies.
• Second, virtually the entire interlinked
system of protection, even when used by
other developing countries, is heavily bi-
ased against developing countries—and
against the world’s poor.
Import barriers are the most important
instrument of protection
Although the conversion of nontariff barri-
ers to tariffs during the Uruguay Round was
an important step forward, average agricul-
tural tariffs in most industrial and developing
countries were and remain much higher than
tariffs for nonagricultural products.
This section evaluates the agricultural trade
regimes of the Quad countries (Canada, Euro-
pean Union, Japan, United States) and 25
developing countries in light of the Uruguay
Round’s objectives. Eight of the developing
countries in the sample are large middle-
income countries with significant agricultural
sectors. Eight more middle-income countries
are included to ensure regional balance. Eight
lower-income countries round out the sample.
Emphasis has been placed on the nature of
tariffs because a key objective of the Uruguay
Round was to lower tariffs and make them
more transparent.
The tariff data in table 3.8 underestimate
actual border protection. First, specific duties,
which generally are higher than ad valorem
rates, are not fully reflected in the simple av-
GLOBAL ECONOMIC PROSPECTS 2004
118
Table 3.8 Agricultural tariffs are higher than manufacturing tariffs in both rich and poor
countries
Most-favored-nation, applied, ad valorem, out-of-quota duties (percent)
Percentage of lines
Agriculture Manufacturing covered in agriculture
Quad countries 10.7 4.0 86.7
Canada (2001) 3.8 3.6 76.0
European Union (1999) 19.0 4.2 85.9
Japan (2001) 10.3 3.7 85.5
United States (2001) 9.5 4.6 99.3
Large middle-income countries
a
26.6 13.1 91.3
Other middle-income countries
b
35.4 12.7 97.7
Lower-income countries
c
16.6 13.2 99.8
a. Brazil (2001), China (2001), India (2000), Korea (2001), Mexico (2001), Russian Federation (2001), South Africa (2001), and
Turkey (2001).
b. Bulgaria (2001), Costa Rica (2001), Hungary (2001), Jordan (2000), Malaysia (2001), Morocco (1997), Philippines (2001),
and Romania (1999).
c. Bangladesh (1999), Guatemala (1999), Indonesia (1999), Kenya (2001), Malawi (2000), Togo (2001), Uganda (2001), and
Zimbabwe (2001).
Source: WTO Integrated Database.
erages. Second, many products are subject to
nontariff restrictions.
Because ad valorem equivalents of specific
and other duties, where available, are much
higher than the ad valorem rates, and assum-
ing that the same tariff structure applies to
Canada and Japan, which use non–ad valorem
(NAV) rates on 25 percent and 15 percent of
their tariff lines, the average tariffs for the two
countries are seriously underestimated, lower-
ing the Quad average. To show the degree of
bias, the third column in tables 3.8 and 3.9
shows the proportion of tariff lines to which
the averages apply.
7
Excluding Canada, which has a large pro-
portion of agricultural NAV tariffs without
equivalents, average tariffs in agriculture are
much higher than in manufacturing. The differ-
ence is especially pronounced in the European
Union—19 percent in agriculture versus only
4.2 percent in manufacturing. Among the devel-
oping countries, the results are very similar, with
a few exceptions, such as Brazil and Malaysia,
where manufacturing tariffs are higher.
The developing countries in the sample have
higher tariffs than the industrial countries, the
highest being Morocco (64 percent), Korea (42
percent), and Turkey (49.5 percent). Indonesia
(8.5 percent) and Malaysia (2.8 percent) have
the lowest. Again, the average tariffs of coun-
tries that have a high percentage of NAV lines
(Bulgaria, Russian Federation, South Africa,
and Turkey) are seriously underestimated.
Tariffs are widely dispersed and have very
high peaks. Industrial-country tariffs, although
lower on average than those of developing
countries, show significant tariff peaks, indi-
cating high protection for specific products.
The peaks reach almost 1,000 percent in the
Republic of Korea, 506 percent in the Euro-
pean Union, and 350 percent in the United
States.
8
Tariffs in many low-income countries
have lower peaks and show less variance than
those in many of the middle-income countries.
Compared to the slow reform in OECD
countries, the changes in protection in devel-
oping countries were significant in the 1990s
(figure 3.4). The average agricultural tariff
declined from almost 30 percent in 1990 to
about 18 percent in 2000, a decline of 35 per-
cent. (The rates shown in the figure are simple
averages of the average tariffs of about 50
developing countries.) Those reductions were
complemented by the elimination of most ex-
AGRICULTURAL POLICIES AND TRADE
119
Table 3.9 Agricultural tariffs: High peaks
and deep valleys
Tariff peaks and variance in selected countries; MFN, out of
quota, applied duties (percent and standard deviation)
Percentage
Average Maximum Standard of lines
tariff tariff deviation covered
Canada 3.8 238.0 12.9 76.0
European Union 19.0 506.3 27.3 85.9
Japan 10.3 50.0 10.0 85.5
United States 9.5 350.0 26.2 99.3
Korea, Rep. of 42.2 917.0 119.2 98.0
Brazil 12.4 55.0 5.9 100.0
Costa Rica 13.2 154.0 17.4 100.0
Indonesia 8.5 170.0 24.1 100.0
Malawi 15.3 25.0 9.1 100.0
Morocco 63.9 376.5 68.2 100.0
Togo 14.7 20.0 6.5 99.9
Uganda 12.9 15.0 3.7 100.0
Source: WTO Integrated Database.
Figure 3.4 Developing countries lowered
tariffs on manufactured products more
than on agricultural products
1990
1995
2000
ᮡ
ᮡ
ᮡ
0
Agricultural
products
Manufacturing
products
5
10
15
20
25
30
35
Average applied tariffs for agricultural and manufacturing
products in developing countries, 1990, 1995, and 2000
(percent)
Source: TRAINS.
port taxes as well as import licensing and
many other quantitative restrictions (World
Bank 2001). Average tariffs in agriculture re-
main much higher than those in manufactur-
ing, however, indicating that the general ten-
dency in the 1980s—to protect the industrial
sector—no longer holds. In their study of 15
developing countries, Jensen, Robinson, and
Tarp (2002) concluded that the bias against
agriculture in the 1980s no longer exists. The
economy-wide system of indirect taxes, in-
cluding tariffs and export taxes, significantly
discriminated against agriculture in only one
country. It was largely neutral in five, pro-
vided a moderate subsidy to agriculture in
four, and strongly favored agriculture in five.
Subsidies underpin the system
of border protection
An extensive network of subsidies has evolved
to support agriculture, particularly in the rich
countries. Protection takes three major forms.
• Border barriers such as tariffs and quan-
titative restrictions, designed to support
prices in domestic markets, account for
about 70 percent of total protection in
the OECD countries.
• Production-related subsidies given to
farmers under different schemes, called
“direct support,” usually take the form
of direct budget transfers.
• General support for agriculture—through
research, training, marketing, and infra-
structure programs—usually is not included
in the estimates of producer supports.
In addition, many countries have subsidies
for their consumers, but generally these do not
affect production and thus are not included in
producer-support estimates.
The support accorded to OECD-country
producers through higher domestic prices and
direct production subsidies was $248 billion in
1999–2001 (table 3.10). Some two-thirds of
the total—$160 billion—came from the bor-
der barriers described above or from market
price support mechanisms. The remainder
came in the form of direct subsidies to farmers.
Another $80 billion in subsidies came from
GLOBAL ECONOMIC PROSPECTS 2004
120
Table 3.10 Most subsidies go to producers—and come from border protection
Agricultural support in the OECD countries, 1999–2001 (billions of dollars)
European
Union Other
United European Emerging accession OECD Total
States Union Japan supporters
a
countries
b
countries OECD
Where total support goes
Consumers 21.4 3.8 0.1 0.7 0.0 0.2 26.2
General services 22.8 9.6 12.7 7.1 0.6 2.3 55.1
Producers 51.3 99.3 52.0 30.4 3.0 12.3 248.3
Total 95.5 112.7 64.8 38.2 3.6 14.9 329.6
Where producer support goes
Corn 8.3 2.7 N
c
1.7 –0.1 0.2 12.9
Meat
c
2.6 34.0 4.1 3.4 0.5 2.8 47.3
Milk 12.4 16.7 4.9 2.7 0.7 4.7 42.1
Rice 0.7 0.2 18.0 7.6 N
c
–0.2 26.4
Wheat 4.9 9.5 0.8 0.9 0.3 0.9 17.3
Other 22.3 36.2 24.1 14.1 1.9 3.6 102.2
Where producer support comes from
Domestic measures
d
32.6 38.5 5.0 4.4 1.4 6.3 88.2
Border measures
e
18.7 60.9 47.0 26.0 2.0 5.7 160.1
a. Includes Korea, Turkey, and Mexico.
b. Includes Czech Republic, Hungary, Poland, and Slovak Republic.
c. Beef and pork.
d. Direct payments to producers.
e. Tariffs and tariff equivalents of other border measures.
Sources: OECD (2002) and authors’ calculations.
programs (such as food stamps) that directly
benefit consumers ($26 billion) and from gen-
eral services to agriculture ($55 billion), such
as public investments in agricultural research
and extension.
Of the subsidies, the share linked to income
rather than production (known as “partially
decoupled subsidies”) increased from approxi-
mately 9 percent of total protection in 1986–88
to 21 percent in 2001. Major products that ac-
count for the bulk of support are grains, meats,
milk, and sugar.
Protection rates for producers in the OECD
decreased from 62.5 percent in 1986–88 to 49
percent in 1999–01, measured as a percentage
of gross agricultural output at world prices. The
contribution of border barriers to total protec-
tion fell from 77 percent in 1986–88 to about
65 percent in 1999–01. After decreasing rapidly
from 1986, overall protection rose again after
1997 in response to declines in world agricul-
tural prices. Support to agricultural producers
from border protection and direct subsidies in-
creased farm-gate revenues in the OECD coun-
tries by almost 50 percent in 1999–2001 (table
3.11). But the persistence of high tariffs reduces
the incentives to eliminate production subsidies
and various inefficiencies globally.
Agricultural support tends to be counter-
cyclical in rich countries, pushing price adjust-
ments into the global market and accentuating
price drops. The countercyclical movement
of protection reflects the specific duties and
TRQs that are triggered when prices fall.
The European Union and United States
have reduced their overall levels of agricultural
support. For example, in the European Union
farmers’ prices were 65 percent higher than
international prices in 1986–88; this ratio
decreased to 34 percent in 1999–01. During
the same period, however, direct production-
related payments to farmers increased from
10.5 percent to 21.7 percent, partially com-
pensating for the decline in border barriers.
Similarly, in the United States, domestic prices,
relative to international prices, declined from
16 percent to 10.8 percent.
Aggregate support levels vary significantly
among the OECD countries. Some (Iceland,
Norway, and Switzerland) have very high lev-
els of support. Australia and New Zealand
have very low support levels. The European
Union (on the high end) and Canada (on the
low end) fall between these extremes.
The Eastern European countries made the
most significant reductions in protection be-
tween 1986 and 2001—from 63.6 percent to
17.9 percent. Korea’s protection levels have re-
mained very high, with small variations. Mex-
ico and Turkey, which started with low pro-
AGRICULTURAL POLICIES AND TRADE
121
Table 3.11 Subsidies account for a large share of farmers’ revenues
Percentage of farm-gate prices attributable to border protection and direct subsidies, 1986–2001
Market price support
(border protection)
a
Direct subsidies
a
Total producer support (estimate)
a
Area 1986–88 1995–97 1999–2001 1986–88 1995–97 1999–2001 1986–88 1995–97 1999–2001
OECD 48.2 28.2 31.3 14.3 13.3 17.2 62.5 41.5 48.5
European Union 65.3 28.3 34.3 10.5 20.4 21.7 75.8 48.8 56.0
Japan 145.4 131.7 138.1 16.8 13.0 14.7 162.1 144.7 152.9
United States 16.0 7.5 10.8 18.3 7.4 18.8 34.3 14.9 29.6
Eastern Europe 45.2 8.7 10.4 18.3 4.8 7.5 63.6 13.5 17.9
Australia and
New Zealand 4.2 2.8 0.6 6.4 3.9 3.4 10.6 6.8 4.0
Other countries 53.1 42.6 46.3 11.1 12.8 12.2 64.2 55.4 58.5
Other industrial
b
165.9 108.1 113.0 72.2 81.9 106.7 238.1 190.0 219.7
Other developing
c
31.4 38.1 42.9 6.4 8.0 7.3 37.8 46.1 50.2
a. The denominator is total value of production at farm gate less market price support (both estimated at world prices).
b. Includes Norway, Switzerland, and Iceland.
c. Includes Korea, Turkey, and Mexico.
Source: OECD.
tection, increased it over this period, mainly
through higher border protection.
The high domestic price differentials in
table 3.11 indicate that domestic production is
protected much more significantly than the un-
weighted average tariff rates shown in table
3.8 would imply. In Japan, for example, border
protection raises market prices by some 138
percent, whereas the average tariff is just 10
percent and the maximum ad valorem tariff is
only 50 percent. The difference can only be at-
tributed to specific duties and TRQs, which are
not included in the data set. For the European
Union, the situation is similar. Border protec-
tion raises prices by more than 34 percent, well
above the average tariff of 19 percent. In both
areas, tariffs on many local specialties are very
high. For example, in the European Union the
average tariffs for grains, meats, and milk and
milk products are 34.6 percent, 32.5 percent,
and 54.6 percent respectively.
Specific duties produce hidden tariff
increases in downturns
The Uruguay Round objective of providing
greater transparency of protection levels
through tariffication has not been fully realized,
especially in the key industrial and some
middle-income countries. First, many agricul-
tural tariffs are still specific, compound, or
mixed. In such cases it is almost impossible to
estimate the real level of protection because it
may change over time and with the relative
price of imports. Even more important are the
cyclical implications of such tariff structures:
protection from specific duties rises as prices de-
cline in the world markets; protection will be
higher for lower-priced products from the de-
veloping countries.
9
The proportion of agricultural tariff lines
that carry specific, compound, and mixed duties
is much higher in rich countries than in de-
veloping countries (figure 3.5).
10
This means,
among other things, that the transparency of
agricultural tariffs in developing countries is
higher than in industrial countries—and signifi-
cantly higher than in manufacturing. Of the 24
developing countries included in this sample, 11
have no NAV rates, 5 have them in fewer than
1 percent of their tariff lines, and 4 in fewer
than 5 percent of tariff lines. Only 4 countries,
all middle income, have a higher proportion of
tariff lines with NAV rates. Within the Quad,
Japan has specific, compound, or mixed rates in
15 percent of its tariff lines; Canada in 24 per-
cent; the United States in 40 percent; and the Eu-
ropean Union in 44 percent. The United States
and European Union also have duties that vary
according to the content of the products in 1
percent and 4 percent, respectively, of their tar-
iff lines. Thus the difference in the transparency
of tariff rates is consistent for most developing
and industrial countries, and the biggest prob-
lem with nontransparency lies with the indus-
trial and a few middle-income countries.
11
Within the Quad, tariff structures show
some differences. In the United States, almost all
categories of products have NAV rates between
30 and 60 percent. In the European Union, cer-
tain product groups—such as beverages, grains,
milk and milk products, and sugar and sugar
products—have more than 90 percent of tariff
lines under NAV. In many developing countries,
NAV rates are clustered within a few product
GLOBAL ECONOMIC PROSPECTS 2004
122
Figure 3.5 Rich countries use non–ad
valorem tariffs more often than do
developing countries
Tariff lines containing specific, compound, or mixed duties,
for agriculture and manufacturing by class of country
(as percentage of all lines)
Quad Large
middle
income
Other
middle
income
Lower
income
0
5
10
15
20
25
30
35
Agriculture
Manufacturing
ᮡ
ᮡ
Source: WTO IDB.
groups. For example, in Malaysia NAV rates
apply to tobacco and alcohol products; in Mex-
ico on chocolate and confectionary products;
and in Korea on nuts, spices, and sugar.
Only four countries in the sample report
the ad valorem equivalents of their NAV rates
(table 3.12). For those four, the average equiv-
alents are much higher than the average ad
valorem rates, suggesting that average duties
for countries with a large proportion of NAV
duties are seriously underestimated.
The specific duties are being used primarily
as an instrument of disguised protection. First,
as shown in table 3.12, the ad valorem equiva-
lents of specific duties, where known, are higher
than the ad valorem rates. Second, the propor-
tion of specific duties increases with the degree
of processing (figure 3.6). They are found most
frequently in lines covering final products—
those classified under food processing.
Tariff escalation is particularly harmful
to development
Tariff codes that apply higher tariffs to semi-
processed and fully processed raw materials
are strikingly antidevelopment. By hindering
AGRICULTURAL POLICIES AND TRADE
123
Table 3.12 Specific tariffs are higher than ad valorem rates
Average applied, out-of quota, ad valorem and ad valorem equivalents of non–ad valorem tariffs in areas for which equivalents
are reported (percent)
Average ad valorem Percentage of lines
Average ad valorem tariff equivalent of NAV rates containing NAV rates
Australia 1.2 5.0 0.9
European Union 10.6 35.2 43.6
Jordan 21.6 58.0 0.8
United States 8.1 11.7 40.4
Source: WTO Integrated Database (IDB).
Figure 3.6 Throughout the world, tariff rates escalate with degree of processing
Note: a. Bangladesh (1999), Guatemala (1999), Indonesia (1999), Kenya (2001), Malawi (2000), Togo (2001), Uganda (2001), and
Zimbabwe (2001).
b. Brazil (2001), China (2001), India (2000), Korea (2001), Mexico (2001), Russian Federation (2001), South Africa (2001),
and Turkey (2001).
c. Bulgaria (2001), Costa Rica (2001), Hungary (2001), Jordan (2000), Malaysia (2001), Morocco (1997), Philippines (2001),
and Romania (1999).
Source: WTO Integrated Database (IDB).
Tariff rates by area and stage of processing (percent)
Quad Canada Japan United States European
Union
Lower
income
Large middle
income
Other middle
income
Raw
Intermediate
Final
10
0
20
30
40
50
60
ᮡ
ᮡ
ᮡ
ab c
diversification into value-added and processed
products, areas in which trade is expanding
rapidly, such escalation directly penalizes in-
vestors in developing countries who seek to
add value to production for export.
Tariff escalation has long been a feature of
agricultural and food-processing trade and con-
tinues to be so (Golub and Finger 1979, Lind-
land 1997, and Gallezot 2003). Protection es-
calates with the level of processing in almost all
countries and across all products (table 3.13).
Almost all groups of countries have highly es-
calating tariffs (see figure 3.6), and the manu-
facturing component of agriculture and food
processing has very high protection, explaining
the developing countries’ lack of penetration in
food processing in industrial countries. Devel-
oping economies also apply systematic tariff es-
calation and high tariffs to the final stage of
processing, suggesting potentially large gains if
escalation were removed by developing econo-
mies (Rae and Josling 2003).
Tariff escalation is common in both tradi-
tional and new products. For traditional prod-
ucts (except sugar), raw stages are accorded
extremely low tariffs, whereas extremely high
tariffs apply to the final stages. A similar pat-
tern appears in fruits and vegetables, for which
the developing countries have found expanding
markets and trade barriers are generally lower.
The averages reported in table 3.13 mask very
high peaks on individual products. In the
United States, for example, the maximum tariff
on final fruit products is 136 percent; on cocoa
products it is 186 percent. In the European
Union the maximum rates on processed fruits
and vegetables are 98 percent and 146 percent;
on cocoa products, 63 percent.
GLOBAL ECONOMIC PROSPECTS 2004
124
Table 3.13 Tariffs rise with level of processing
Tariff escalations in selected product groups (percent)
European Union United States Korea Japan
Tropical products
Coffee
Raw 7.3 0.1 5.2 6.0
Final 12.1 10.1 8.0 18.8
Cocoa
Raw 0.5 0.0 5.0 0.0
Intermediate 9.7 0.2 5.0 7.0
Final 30.6 15.3 12.3 21.7
Sugar
Raw 18.9 2.0 a 25.5
Intermediate 30.4 13.8 19.3 11.6
b
Final 36.4 20.1 50.0 a
Expanding commodities
Fruits
Raw 9.2 4.6 49.6 8.7
Intermediate 13.3 5.5 30.0 13.2
Final 22.5 10.2 41.9 16.7
Vegetables
Raw 9.9 4.4 135.4 5.0
Intermediate 18.5 4.4 52.2 10.6
Final 18.0 6.5 34.1 11.6
Seafood
Raw 11.5 0.6 15.6 4.9
Intermediate 5.1 3.2 5.8 4.3
Final 16.2 3.5 20.0 9.1
a. All lines are specific.
b. 56 percent of lines are specific.
Source: WTO Integrated Database.