Phần 17 KHÓA ĐÀO TẠO TÍNH TOÁN ỔN ĐỊNH VÀ ỨNG DỤNG TRÊN PHẦN MỀM PSSE CHO KỸ SƯ HỆ THỐNG ĐIỆN (Ứng dụng tính toán Ổn định điện áp trên Phần mềm PSSE)
Bạn đang xem bản rút gọn của tài liệu. Xem và tải ngay bản đầy đủ của tài liệu tại đây (4.17 MB, 70 trang )
TRANSMISSION &
DISTRIBUTION
A Division of Global Power
POWER SYSTEM STABILITY CALCULATION TRAINING
D
8
A li ti f V lt St bilit
D
ay
8
–
A
pp
li
ca
ti
on o
f
V
o
lt
age
St
a
bilit
y
July 15, 2013Prepared by: Frida Ceja-Gomez
eBook for You
2
OUTLINE
•
PV Simulation Setup
PV
Simulation
Setup
• PV Analysis
• Exporting the Results to MS-Excel
• Implementing a Specific PV Transfer
•
QV Simulation Setup
QV
Simulation
Setup
• QV Analysis
eBook for You
3
EXAMPLE 1
–
PV SIMULATION
EXAMPLE
1
–
PV
SIMULATION
SETUP
eBook for You
PV Analysis Applications
4
PV SIMULATION SETUP
PV
Analysis
Applications
• What can we do with PV analysis results?
• Identify the low voltage transfer limit
D t i th i t f lt ll
•
D
e
t
erm
i
ne
th
e po
i
n
t
o
f
vo
lt
age co
ll
apse
eBook for You
PV Analysis in PSS®E
5
PV SIMULATION SETUP
PV
Analysis
in
PSS®E
•
The purpose of this analysis is to identify the
•
The
purpose
of
this
analysis
is
to
identify
the
maximum power transfer without causing a voltage
collapse
• This situation can be analyzed as a steady-state
problem (dynamic analysis is not necessary)
• The analysis is power flow based and it is used to
assess voltage variations due to active power
changes
• For these reason, we will use the non-converted
saved case file: Day5_savnw.sav
eBook for You
Test System
6
PV SIMULATION SETUP
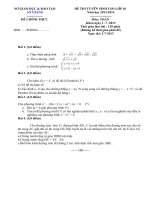
Test
System
•
Recall that our test
Recall
that
our
test
system is divided in 3
areas
• As determined before,
Area 1 exports power
to the other two areas
• Therefore, in this case
we will perform PV
lifth
ana
l
ys
i
s
f
or
th
e power
transfer between Area 1
and Area 5
eBook for You
Distribution Factor Data File
7
PV SIMULATION SETUP
Distribution
Factor
Data
File
• In order to carry out a PV analysis, first we need to build
a distribution factor data file
a
distribution
factor
data
file
• This file takes the contents of a set of linear network
analysis data files in preparation for a variety of
analyses, including PV and QV analyses
• The input required for the process of creating the
Distribution Factor file is contained in three data files:
Distribution
Factor
file
is
contained
in
three
data
files:
• Subsystem description data file
• Monitored element data file
• Contingency description data file
eBook for You
Special Data Records
8
PV SIMULATION SETUP
Special
Data
Records
• The record types shown below are allowed in all three of
the linear network analysis data files mentioned above
the
linear
network
analysis
data
files
mentioned
above
• TRACE: When enabled, each line read from the input
file is written to the Progress tab or the user
specified output file
• ECHO file: Write each input line to the designated file
• COM: Comment line that is ignored during input
processing
• END: End of block structure or end of data input
Note that blank lines are ignored during the input file processing
eBook for You
File Notational Conventions
9
PV SIMULATION SETUP
File
Notational
Conventions
• CAPITALS Indicates a keyword that must be specified exactly as
shown
shown
• [ … ] Optional keywords or values
A|B
S if f th li t t d l d b ti l
•
A|B
S
pec
if
y one
f
rom
th
e
li
s
t
separa
t
e
d
or enc
l
ose
d
b
y ver
ti
ca
l
bars
• bsid Bus identifier (number or name depending on which input
option is in effect, can be changed by activity OPTN)
• ckid One or two character circuit identifier
• mcid One or two character machine identifier
• file A filename
• label A 12-character label identifier
eBook for You
Subsystem File
10
PV SIMULATION SETUP
Subsystem
File
• In this file we need to s
p
ecif
y
the different
py
subsystems of the working case that we wish to
monitor and manipulate
• The following structure should be followed:
SUBSYSTEM|SYSTEM [label]
(
subs
y
stem s
p
ecification data record
)
(y p )
.
.
.
(subsystem specification data record)
END
eBook for You
Subsystem File
11
PV SIMULATION SETUP
Subsystem
File
• The subsystem specification data records should be
written as follows:
BUS bsid
BUSES bsid bsid
AREA i
AREAS i i
ZONE
i
These are used to define ranges,
so for example:
ZONE
i
ZONES i i
OWNER i
OWNERS
i
i
AREAS 5 8 will include in the
subsystem areas 5, 6, 7, 8
OWNERS
i
i
KV r
KVRANGE r r
Note that:
• i represents an integer
•
r refers to a floating point value the decimal
•
r
refers
to
a
floating
point
value
,
the
decimal
point is optional for a whole number
eBook for You
Subsystem File
12
PV SIMULATION SETUP
Subsystem
File
• The join structure shown below is used to specify a
group of buses through the logical anding of two or
more of the five selection criteria described on the
previous slide:
JOIN [label]
(subsystem specification data record)
.
.
.
(subsystem specification data record)
END
•
In the above structure the subsystem specification data
In
the
above
structure
,
the
subsystem
specification
data
record is one of the simple record types (BUS, AREA,
ZONE, OWNER, KV, or the range of records)
• Note that the JOIN label is optional and not preserved in
the .dfax file
eBook for You
Subsystem File for our PV Simulation
13
PV SIMULATION SETUP
Subsystem
File
for
our
PV
Simulation
•
PV Analysis serves to study the effect on voltages
PV
Analysis
serves
to
study
the
effect
on
voltages
of varying power transfers from one point to
another
• Therefore, it is necessary to define the source
subsystem, which is the one from which power is
exported
• We also need to specify the sink subsystem, which
is the one to which we wish to transfer power
• Let us open a text file and begin writing this file
•
Name the file PV Area1to5 sub
•
Name
the
file
PV
_
Area1to5
.
sub
eBook for You
Subsystem File for our PV Simulation
14
PV SIMULATION SETUP
Subsystem
File
for
our
PV
Simulation
• The first three lines are simply comments
(preceded by COM) to remind us the names and
(preceded
by
COM)
to
remind
us
the
names
and
numbers of the existing areas
• We define the first subsystem and call it
FLAPCO1 hi h i l d ll l t i A 1
FLAPCO1
, w
hi
c
h
i
nc
l
u
d
es a
ll
e
l
emen
t
s
i
n
A
rea
1
• The second subsystem is called WORLD1 and
comprises all elements in Area 5
• The third and fourth subsystems only include
elements in the specified area with a voltage
range between 230 and 500kV
range
between
230
and
500kV
• Note that when multiple different commands are
used within a subsystem (AREA, ZONE,
KVRANGE) we need to use the JOIN structure
KVRANGE)
,
we
need
to
use
the
JOIN
structure
eBook for You
Monitored Element Data File
15
PV SIMULATION SETUP
Monitored
Element
Data
File
• This file identifies the elements and buses that are to be monitored for
flow or voltage violations, respectively
flow
or
voltage
violations,
respectively
• The different structures for flow monitoring records are shown below
Individual branch:
[MONITOR] |BRANCH| FROM BUS bsid TO BUS bsid |CIRCUIT| ckid
|LINE| |CKT|
A
ll branches in an Area
,
Zone
,
Owner
,
KV ran
g
e or Subs
y
stem:
,, , g y
[MONITOR] |BRANCHES| IN |AREA i|
|LINES| |KV r|
|BREAKERS| |SUBSYSTEM label|
All ties from a specified subsystem or a pair of subsystems:
[MONITOR] TIES FROM |AREA i| TO |AREA i|
|KV r| |KV r|
|
SUBSYSTEM label
|
|
SUBSYSTEM label
|
||||
eBook for You
Monitored Element Data File
16
PV SIMULATION SETUP
Monitored
Element
Data
File
• It is also possible to define an interface using the following block
structure:
structure:
[MONITOR] INTERFACE label
(
branch s
p
ecification record
)
(p )
.
.
.
(
branch s
p
ecification record
)
(p )
END
• In the above structure, the branch specification record may
specify sets of tie lines or individual branches, as shown in the
previous slide
eBook for You
Monitored Element Data File
17
PV SIMULATION SETUP
Monitored
Element
Data
File
• The different structures for voltage monitoring records are shown below
Set of buses outside a voltage band (r r define the upper and lower limits
of the band):
[MONITOR] VOLTAGE RANGE |ALL BUSES| r r
|AREA i|
|KV r|
|KV
r|
|SUBSYSTEM label|
Set of buses to be monitored for voltage limit violations (the voltage limit
definition is made at results post
-
processing stage:
definition
is
made
at
results
post
processing
stage:
[MONITOR] VOLTAGE LIMIT |ALL BUSES|
|AREA i|
|KV r|
|SUBSYSTEM label|
Set of buses having a given voltage drop and rise deviation thresholds
(the first r is the value of the voltage drop in per unit):
[MONITOR] VOLTAGE DEVIATION |ALL BUSES| r r
|AREA
i
|
|AREA
i
|
|KV r|
|SUBSYSTEM label|
eBook for You
Monitor File for our PV Analysis
18
PV SIMULATION SETUP
Monitor
File
for
our
PV
Analysis
• Open a text file and save
it with extension
mon
it
with
extension
.
mon
• Note that this file refers
to the subsystems we
defined in the .sub file
• In this case we are
monitoring the branches
monitoring
the
branches
and buses of each area
with a voltage between
230 and 500kV
• We also created an interface that monitors the ties
between Area 1 and Area 5
eBook for You
Contingency Description Data File
19
PV SIMULATION SETUP
Contingency
Description
Data
File
• This file is used to define the contingencies we wish to study
• The contingency case block structure to use is shown below
CONTINGENCY label [r r]
(contingency event specification record)
(contingency
event
specification
record)
.
.
.
(contingency event specification record)
(contingency
event
specification
record)
END
• The first r value re
p
resents the fre
q
uenc
y
in occurrence/
y
ear
pqy y
and the second r value represents duration in hours
• The occurrence and duration are used for probabilistic
reliability assessment
reliability
assessment
eBook for You
Contingency Description Data File
20
PV SIMULATION SETUP
Contingency
Description
Data
File
•
In the above structure, the following contingency event
In
the
above
structure,
the
following
contingency
event
specification records can be used
Outaging an in-service non-transformer branch or two-winding
transformer branch:
transformer
branch:
|DISCONNECT| |BRANCH| FROM BUS bsid TO BUS bsid |CIRCUIT| ckid
|OPEN| |LINE| |CKT|
|TRIP|
Putting in-service an out-of-service non-transformer branch or two-
winding transformer:
CLOSE |BRANCH| FROM BUS bsid TO BUS bsid |CIRCUIT| ckid
|LINE| |CKT|
Outaging all in-service non-transformer branch or two-winding
transformer branch in one subsystem:
SINGLE |BRANCH| IN SUBSYSTEM |SUBSYSTEM label|
SINGLE
|BRANCH|
IN
SUBSYSTEM
|SUBSYSTEM
label|
|LINE|
eBook for You
Contingency File for our
21
PV SIMULATION SETUP
Contingency
File
for
our
PV Analysis
• Open a text file and save it with
extension .con
•
In this
case we are defining
Case 1
•
In
this
case
we
are
defining
two contingencies, as shown
to the right
Case 2
eBook for You
22
EXAMPLE 1
–
PV ANALYSIS IN
EXAMPLE
1
–
PV
ANALYSIS
IN
PSS®E
eBook for You
Opening the PV Analysis window
23
PV ANALYSIS IN PSS®E
Opening
the
PV
Analysis
window
• Click on the PV
button (shown to
the right)
•
You can also
You
can
also
access this
window in the
Power Flow
menu; option
menu;
option
Contingency,
Reliability, PV/QV
Analysis
• The PV Analysis
window should
pop up
eBook for You
PV Analysis window
24
PV ANALYSIS IN PSS®E
PV
Analysis
window
• Enable all
switched shunts
(only if these are
dld tl
mo
d
e
l
e
d
correc
tl
y
• Select full
Newton-Raphson
as the solution
method
•
Check the non
-
Check
the
non
divergent solution
box (this option
allows the
program to
program
to
decrease the
steps in order to
find a solution
when it
when
it
encounters a
problem)
eBook for You
PV Analysis window options
25
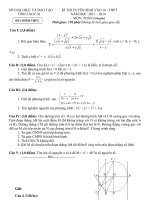
PV ANALYSIS IN PSS®E
PV
Analysis
window
options
• Set the initial
transfer increment
to a small value
(10MW)
• Set the maximum
incremental
transfer to a large
value so that the
p
ro
g
ram does not
pg
stop before finding
the maximum
power transfer
• In the generation
limits section,
select Honor
machine active
machine
active
power limits
eBook for You