CORRELATING IRINOTECAN AND CAPECITABINE TREATMENT FOR COLORECTAL CANCER TO GENE EXPRESSION, POLYMORPHISMS, AND CLINICAL OUTCOMES
Bạn đang xem bản rút gọn của tài liệu. Xem và tải ngay bản đầy đủ của tài liệu tại đây (1.35 MB, 50 trang )
CORRELATING IRINOTECAN AND CAPECITABINE TREATMENT FOR
COLORECTAL CANCER TO GENE EXPRESSION, POLYMORPHISMS, AND
CLINICAL OUTCOMES
David T. Hinkle IV
Submitted to the faculty of the University Graduate School
in partial fulfillment of the requirements
for the degree
Master of Science
in the Department of Biochemistry and Molecular Biology,
Indiana University
December 2010
ii
Accepted by the Faculty of Indiana University, in partial
fulfillment of the requirements for the degree of Master of Science.
Maureen A. Harrington, Ph.D., Chair
Elena G. Chiorean, M.D.
Master’s Thesis
Committee
Sonal P. Sanghani, Ph.D.
iii
ACKNOWLEDGEMENTS
I would like to thank my committee members for all their contributions and assistance.
Thank you.
Sonal P. Sanghani, Ph.D.
Elena G. Chiorean, M.D.
Maureen A. Harrington, Ph.D.
iv
ABSTRACT
David T. Hinkle IV
CORRELATING IRINOTECAN AND CAPECITABINE TREATMENT FOR
COLORECTAL CANCER TO GENE EXPRESSION, POLYMORPHISMS, AND
CLINICAL OUTCOMES
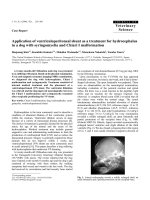
Colorectal cancer is the third most common type of cancer and the third most common
cause of cancer-related mortality. There are three types of treatment available to patients,
either individually or in combination. Treatments are radiation, chemotherapy, and
surgery. In a Phase II clinical trial at IUSM, a multimodality approach was chosen. The
patients with locally advanced rectal cancer received preoperative treatment with
capecitabine and irinotecan (CPT-11) combination followed by chemoradiation with
capecitabine and finally surgery to improve response and decrease local recurrence.
Irinotecan and Capecitabine are both prodrugs activated in vivo to SN-38 and 5-FU,
respectively. Identification of the molecular markers for 5-FU and Irinotecan efficacy and
toxicity is important for the development of more efficient and less toxic treatment
strategies for patients with colorectal cancer. The goal of this study was to determine the
expression levels of the genes involved in activation and metabolism of capecitabine and
irinotecan in pre and post treatment specimens from these patients. The genes quantitated
by real-time PCR were carboxylesterase 1 and 2 (CES1 and CES2), thymidylate synthase
(TS), β-glucoronidase (β-GUS), thymidine phosphorylase (TP), dihydropyrimidine
dehydrogenase (DPD) and topoisomerase I (Topo I). The UGT1A1*28 polymorphism in
v
UDP glucuronosyltransferase 1 is associated with SN-38 toxicity. Therefore, the
UGT1A1*28 polymorphism status in patients was determined by PCR-sequencing.
Correlative analysis of gene expression and UGT1A1*28 mutation with clinical outcome
in this Phase II study was completed.
Maureen A. Harrington, Ph.D., Chair
vi
TABLE OF CONTENTS
LIST OF TABLES viii
LIST OF FIGURES ix
INTRODUCTION
I. Colorectal Cancer 1
II. Treatment for Colorectal Cancer 2
III. Clinical Trial 4
IV. Capecitabine and Irinotecan 5
V. Carboxylesterases 8
VI. Significance of UGT1A1 8
VII. Biotechniques Utilized 9
VIII. Hypothesis 10
METHODS
I. Materials 12
II. Sequencing of UGT1A1 Region 12
III. Gene Expression in Samples 13
IV. Patient Data 16
V. Correlative Analysis 16
vii
RESULTS
I. Analysis of Isolated DNA 17
II. Analysis of Isolated RNA 18
III. Real-Time PCR 20
IV. Clinical Trial Outcome Data 23
V. Sequencing of UGT1A1 Region 23
VI. Gene Expression Analysis 26
DISCUSSION
I. Gene Expression in Paired Normal and Tumor Samples 29
II. Gene Expression in Baseline and Surgical Samples 32
III. Correlation of Gene Expression and Therapeutic Response 32
IV. Hypothesis 33
REFERENCES 34
CURRICULUM VITAE
viii
LIST OF TABLES
1. TNM System 1
2. Staging of Colon Cancer 2
3. Forward and Reverse Primers for Real-Time PCR 15
4. Summary of Isolated DNA Data from Normal and Tumor Samples 17
5. Summary of Isolated RNA Data from Normal and Tumor Samples 19
6. Gene Expression in Baseline Normal Samples 21
7. Gene Expression in Baseline Tumor Samples 22
8. Standard Curve Equations for Real-Time PCR Assays 23
9. Summary of Clinical Trial Data 23
10. UGT1A1*28 Polymorphism Status in Patients 24
11. Summary of p Values in Paired Samples 26
ix
LIST OF FIGURES
1. Clinical Trial Schema 4
2. Molecular Structure of Irinotecan 5
3. Irinotecan (CPT-11) Metabolism 6
4. Molecular Structure of Capecitabine 7
5. Metabolism of Capecitabine 7
6. Example of Typical DNA Spectrophotometric Analysis 18
7. Example of Typical RNA Spectrophotometric Analysis 19
8. Example of Degraded RNA Spectrophotometric Analysis 20
9. Real-Time PCR Standard Curve 20
10. Wild-Type UGT1A1 (TA)
6
TAA/(TA)
6
TAA (6/6) Chromatogram 24
11. Heterozygous (TA)
6
TAA/(TA)
7
TAA (6/7) Chromatogram 25
12. Homozygous (TA)
7
TAA/(TA)
7
TAA (7/7) Chromatogram 25
13. Comparisons of CES2 Expression 27
14. Comparisons of TP Expression 28
1
INTRODUCTION
I. Colorectal Cancer
Colorectal cancer is the third most common type of cancer and the third most common
cause of cancer related mortality. Although incidence has been steadily decreasing, the
NIH estimated colorectal cancer to cause 49,960 deaths in 2008 (1). Colorectal cancer is
an uncontrolled proliferation of cells in the largest part of the large intestine, the colon or
rectum. Most colorectal cancers are adenocarcinomas, meaning they originate from the
glandular cells that line the intestine (2).
Staging is the categorization of cancer according to the extent that it spreads. It is used
for diagnostic, therapeutic, and prognostic purposes. There are several staging systems,
but the most common system is the American Joint Committee on Cancer (AJCC)
system, also called the TNM system. This system uses Roman Numerals I-IV to describe
the extent of the primary Tumor (T), the absence or presence of metastasis to nearby
lymph Nodes (N), and the absence or presence of distant Metastasis (M) (3).
Tumor
T1: Tumor invades submucosa
T2: Tumor invades muscularis
T3: Tumor invades serosa
T4: Tumor invades other organs/structures
Node
N0: No regional lymph node invasion
N1: Metastasis in 1-3 regional lymph nodes
N2: Metastasis in 4 or more regional nodes
Metastasis
M0: No distant metastasis
M1: Distant metastasis present
Table 1: TNM System: (American Cancer Society. Detailed Guide: Colon and
Rectum Cancer, How is Colorectal Cancer Staged).
2
Stage I: T1 N0 M0; T2 N0 M0.
Cancer is contained to inner lining.
Stage II: T3 N0 M0; T4 N0 M0.
Cancer has spread to other nearby organs, but not
reached lymph nodes.
Stage III: any T, N1-2, M0.
Cancer has spread to lymph nodes, but has not
been carried to distant parts of the body
Stage IV: any T, any N, M1.
Cancer has been carried through the lymph
system to distant parts of the body. The most
likely organs are the lungs and liver
Table 2: Staging of Colon Cancer (American Cancer Society. Detailed Guide: Colon
and Rectum Cancer, How is Colorectal Cancer Staged).
II. Treatment for Colorectal Cancer
There are three types of treatment available for patients with colorectal cancer. They are
Primary Surgical Therapy, Adjuvant Chemotherapy, and Adjuvant Radiation Therapy
(4). The route of therapy chosen is selected according to the stage of the disease.
Primary Surgical Therapy
Surgery is often the main treatment for colorectal cancer. It is often the best choice,
when the cancer has not metastasized. Surgery may be used alone, or it may be
employed with other options, such as chemotherapy or radiation therapy. Advanced
techniques have greatly improved cure rates and reduced the level of damage to normal
tissue (5).
3
Radiation Therapy
Radiation therapy is one of the most common forms of treatment for cancer. It uses high-
energy particles to attack the cancer cells. It may be used by itself, or in conjunction with
another form of treatment (6). Unlike Chemotherapy, radiation is localized to the area of
the tumor.
Chemotherapy
Chemotherapy is a common method of cancer treatment. It employs the use of
chemical/biological compounds to destroy cancer cells. These drugs may be used alone,
or in combination with other drugs. And unlike surgery and radiation therapy,
chemotherapy is a primarily systemic treatment (7). This means the drugs are not
localized to a specific region. Rather, they are administered to the patient in such a way
that would allow them to travel throughout the body, reaching the cancer cells wherever
they may have spread.
Chemotherapy Options for Colorectal Cancer
A variety of drugs are available for patients with colorectal cancer. The most common
drug is 5-Fluorouracil (5-FU). 5-FU may be administered intravenously or orally, along
with Leucovorin. It is frequently given with another drug, such as Camptosar
(irinotecan) or oxaliplatin, or with targeted therapies, that involve the use of monoclonal
antibodies for specific proteins. These monoclonal antibodies may include Bevacizumab
(Avastin), which targets vascular endothelial growth factor (VEGF), or Cetuximab
(Erbitux) and Panitumumab (Vectibix), which target epidermal growth factor receptor
4
(EGFR) (8). Capecitabine, a prodrug of 5-FU, is increasingly used, as it is an oral drug
and has minimal side effects.
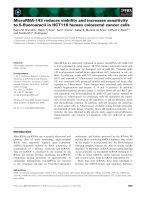
III. Clinical Trial
This study was part of a Phase II clinical trial conducted at the Indiana University School
of Medicine, Indianapolis. Patients were selected according to colorectal cancer staging,
using endoscopic ultrasound (EUS). Those with T3/T4 or ≥ N1 rectal cancer were
treated with capecitabine 1000 mg/m
2
twice daily for days 1-14 and irinotecan 200
mg/m
2
IV on the first of every 21 days for 2 cycles. This was followed by capecitabine
825 mg/m
2
twice daily days 1-5 weekly with concurrent radiotherapy 50.4 Gy in 28 1.8-
Gy fractions. Baseline tumor biopsies were tested for correlative studies of genes
expression with clinical endpoints 4-6 weeks after completion of preoperative therapy.
The objectives of this trial were to assess pathological success rate, toxicity, rate of
recurrence, clinical response to induction chemotherapy, and perform biological
correlative studies of the enzymes involved in capecitabine and irinotecan metabolism.
Figure 1. Clinical Trial Schema
5
IV. Capecitabine and Irinotecan
The first-line treatment of metastatic colorectal cancer is typically Irinotecan, used in
conjunction with Capecitabine. As carbamate prodrugs, both require in vivo activation by
carboxylesterases (9).
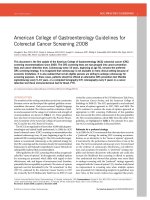
Irinotecan: Structure and Function
Irinotecan (Figure 2) is a semisynthetic, water-soluble derivative of the natural alkaloid,
camptothecin, and is a carbamate ester prodrug of SN-38 (7-12). It works by inhibiting
DNA Topoisomerase I, which is encoded by the gene TOPO I (9). Topo I is a nuclear
enzyme involved in DNA replication, transcription, and DNA repair and recombination.
During DNA replication, topoisomerase works by breaking one DNA strand and
covalently binding to the 3’-phosphoryl end. Irinotecan prevents ligation of the nicked
strand by stabilizing the DNA-topoisomerase I complex. This eventually leads to a
double-strand break and results in apoptosis (10).
Figure 2. Molecular Structure of Irinotecan
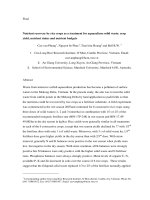
Metabolism of Irinotecan
Irinotecan exists in two forms, an active lactone form and an inactive carboxylate form,
that exist in a pH-dependent equilibrium (9). Irinotecan is converted to several different
6
metabolites by various enzymes. It is converted by carboxylesterases to its active form
SN-38, and by the cytochrome CYP3A4 to form the compounds NPC and APC. APC is
not further metabolized, but NPC is also converted by carboxylesterases to yield SN-38.
(10). SN-38 then undergoes glucuronidation by UGT1A/7 to yield the inactive SN-38G.
Various bacteria produce the enzyme β-glucuronidase (β-GUS), which then converts SN-
38G back to the active metabolite, SN-38 (Figure 3) (9-14).
Figure 3. Irinotecan (CPT-11) Metabolism
Irinotecan exists in two forms, an active lactone form and an inactive carboxylate form,
that exist in a pH-dependent equilibrium. Irinotecan is converted to several different
metabolites by various enzymes. It is converted by esterases to form SN-38, and by
CYP3A4 to form the compounds NPC and APC. APC is not further metabolized, but
NPC is also converted by carboxylases to yield SN-38. SN-38 then undergoes
glucuronidation by UGT1A/7 to yield the inactive SN-38G. Various bacteria produce the
enzyme β-glucuronidase, which then converts SN-38G back to the active metabolite, SN-
38.
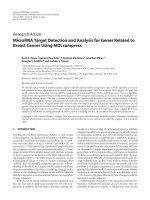
Capecitabine: Structure and Function
Capecitabine (Figure 4) is an orally administered prodrug of the pyrimidine analog 5-
fluorouracil (5-FU). 5-FU inhibits the production of the nucleotide thymidine by
inhibiting the enzyme thymidylate synthase (TS) (9-14).
7
Figure 4. Molecular Structure of Capecitabine
Metabolism of Capecitabine
Capecitabine is first converted to 5'-deoxy-5-fluorocytidine (5'-DFCR) by
carboxylesterases. 5'-DFCR is then converted to 5'-deoxy-5-fluorouridine (5'-DFUR) by
cytidine deaminase. Next, thymidine phosphorylase (TP) converts 5'-DFUR to 5-FU. 5-
FU inhibits the production of the nucleotide thymidine by inhibiting the enzyme
thymidylate synthase (TS). 5-FU, however, is inactivated by the enzyme
dihydropyrimidine dehydrogenase (DPD) (Figure 5) (15).
Figure 5. Metabolism of Capecitabine
8
V. Carboxylesterases
Classification and Function
Carboxylesterases (CES) are members of the α/β hydrolase fold family and are a group of
enzymes that function in the metabolism of ester and amide prodrugs (16). They are
ubiquitously expressed, but levels are highest in the small intestine, liver, and lungs.
There are five genes of carboxylesterases reported in humans, named CES1-CES5. The
vast majority are members of the CES1 or CES2 families. CES1 substrates generally
contain a large acyl and a small alcohol group, while substrates for CES2 contain a small
acyl and a large alcohol moiety (17).
Relationship to Irinotecan and Capecitabine
Irinotecan and Capecitabine are carbamate prodrugs, which require in vivo activation.
Irinotecan activation is accomplished by CES2, and to a lesser extent, CES1. However,
Capecitabine is activated by both CES1 and CES2. Irinotecan is converted to SN-38,
while Capecitabine is converted to 5'-deoxy-5-fluorocytidine (5'-DFCR).
VI. Significance of UGT1A1
UDP glucuronosyltransferase 1 family, polypeptide A1 (UGT1A) encodes a specific
UDP-glucuronosyltransferase (UGT) in the glucuronidation pathway. UGT1A1 also
glucuronidates SN-38, converting it to SN-38G, and renders it inactive. However,
glucuronidase activity is significantly decreased by the presence of additional TA repeats
in the TATA sequence of the promoter region. Patients with a UGT1A1*28
polymorphism are more likely to experience severe adverse reactions to Irinotecan, such
9
as severe neutropenia and even potentially fatal diarrhea, due to their lower capacity to
inactivate SN-38 to its glucuronide (10). There are several possible UGT1A1 (TA)
n
polymorphisms, the most common being variations of (TA)
6
and (TA)
7
(18).
VII. Biotechniques Utilized
There were several biotechniques employed in this study. DNA and RNA isolation,
Real-Time PCR, DNA sequencing, and the use of enzyme activity assays were all
employed. Nucleic Acid (NA) isolation was performed on tissues obtained during
biopsy. Samples were immediately frozen, upon procurement, to prevent RNA
degradation. Samples were then placed in a buffer, homogenized, and purified NAs were
obtained with Qiagen kits. RNA integrity was determined using the 2100 bioanalyzer
(Agilent) and the RNA integrity number was determined using pico chip. This
technology uses picogram quantities of RNAs to determine the RNA integrity and
quantity. To quantify gene expression, RNA samples were reverse-transcribed and
cDNA was used for real-time PCR. Real-time PCR differs from traditional PCR in that it
allows for the detection of amplicon during the initial, exponential phase of amplification,
whereas traditional PCR measures amplicon produced in the final, plateau phase. This
allows for earlier and more dependable quantitation of gene expression. DNA
sequencing was performed on an automated instrument, using a chain-termination
method. This method utilizes dideoxynucleotide triphosphates (ddNTPs) as DNA chain
terminators. Samples are separated into four reactions, each using all four standard
deoxynucleotides (dATP, dGTP, dCTP and dTTP). To each reaction is added only one
of the four dideoxynucleotides (ddATP, ddGTP, ddCTP, or ddTTP) (19). When these
10
labeled nucleotides are incorporated, elongation ceases. This produces DNA fragments
of varying lengths. DNA fragments are denatured and resolved by size. The differences
in length are used to determine the sequence of the DNA (20).
VIII. Hypothesis
It was our hypothesis that higher CES2 expression in tumor tissue would result in better
patient response, due to localized activation of irinotecan to SN-38. Also, higher CES2
expression in normal tissue may be the cause of severe drug related gastrointestinal
toxicity.
11
AIMS of Thesis
1. The Primary aim of this study was to evaluate the expression levels of the genes
responsible for the metabolism of capecitabine and irinotecan in baseline and post-
treatment normal and tumor paired samples obtained from colorectal cancer patients
enrolled in the Phase II trial.
2. The second aim was to conduct correlative analyses of gene expression in normal and
tumor paired samples, and gene expression and clinical outcome.
12
METHODS
I. Materials
QiaShreddars, Allprep DNA/RNA kits, RNeasy Plus Mini Kits, and QIAquick PCR
Purification Kit were purchased from Qiagen (Valencia, CA). Disposable mortars and
pestles were purchased from Kontes. SYBR Green kits and GeneAmp Gold RNA PCR
kits were obtained from Applied Biosystems (Foster City, CA). All primers were ordered
from Integrated DNA Technologies (Coralville, IA).
II. Sequencing of UGT1A1 Region
DNA extraction
Normal tissue samples were used for UGT1A1 sequencing. Tissues were excised,
immediately placed in liquid nitrogen, and stored at -70°C for further use. Less than 20
mg of tissue was placed in 350 µL Buffer RLT (Qiagen) and disrupted with disposable
mortars and pestles (Kontes). Lysates were homogenized with Qiashredder spin columns
(Qiagen) and purified with AllPrep DNA spin columns (Qiagen). DNA was eluted in 50
µL Buffer EB (Qiagen).
DNA sequencing
Approximately 400 ng of DNA from normal biopsy tissue was used as a template for
amplifying a 255 bp region flanking the promoter region of the UGT1A1 gene. The
forward primer was 5’-AAGTGAACTCCCTGCTACCTT-3’and the reverse primer was
5’-CCACTGGGATCAACAGTATCT -3. Reactions were performed in volumes of 50
13
µL with 1x buffer, 1.75mM MgCl
2
, 0.8mM of each dNTP, 0.25 M of each primer, and
0.05U/L AmpliTaq Gold (Applied Biosystems). PCR conditions were based on those
of Monaghan et al. (21). Reactions began at 95°C for 10 minutes, followed by 40 cycles
of 95°C for 30 s, 58°C for 40 s, and 72°C for 40s. PCR products were electrophoresed on
1 percent agarose gels (Sigma) and bands were excised under UV light. Excised DNA
bands were purified with the QIAquick Gel Extraction Kit and sequenced using the
forward primer. Chromatograms were used to identify the number of TA repeats in the
TATA box region of the promoter in comparison to the normal promoter sequence
TATATATATATATAA (18).
III. Gene Expression in Samples
RNA extraction and quantitation
Both normal and tumor samples were collected and processed in a manner similar to the
one described above. Tissues were excised, immediately placed in liquid nitrogen, and
stored at -70°C for further use. Less than 20 mg of tissue was placed in 350 µL Buffer
RLT (Qiagen) and disrupted with disposable mortars and pestles (Kontes). Lysates were
homogenized with Qiashredder spin columns (Qiagen) and purified with AllPrep
RNA/DNA spin columns (Qiagen). Flowthrough was collected, combined with an equal
volume of 70% ethanol, and purified with RNeasy spin columns (Qiagen). RNA was
eluted in 30 µL RNase-free water and quantitated using the ND-1000 (Nanodrop).
14
Reverse transcription and real-time PCR
Gene expression was evaluated using a two-step RT-PCR. Reverse transcription was
performed with the GeneAmp Gold RNA PCR kit (Applied Biosystems) “Protocol for
Two-Step RNA PCR”. Reverse Transcriptions were set up in 50 µL reactions containing
1g of total RNA, 0.75U/µL MultiScribe reverse transcriptase, 0.5U/ µL RNase inhibitor,
1.25 µM oligodeoxythymidylic acid primer, 250 µM of each dNTP, and 2.5mM MgCl
2
.
Reactions were performed on the GeneAmp PCR System 2700 (Applied Biosystems).
RT conditions were 25°C for 10 minutes, 42°C for 60 minutes, 68°C for 10 minutes, 95°C
for 5 minutes, and 40°C hold. Success of all reverse transcription reactions was verified
by amplifying a portion of the β-Actin gene, using the GeneAmp Gold RNA PCR kit
(Applied Biosystems) and primers for β-Actin. The forward primer was 5’-
GAAGATCAAGATCATTGCTCCTCC-3’and the reverse primer was 5’-
TTTTCTGCGCAAGTTAGGTTTTGTG -3’. PCR parameters were 95°C for 10
minutes; followed by 35 cycles of 95°C for 30 seconds, 65°C for 30 seconds, and 72°C
for 1 minute; 72°C for 5 minutes, and holding at 40°C. PCR products were
electrophoresed on 1% agarose gels (Sigma).
For real-time PCR, cDNA equivalent to 20 ng of RNA was added to each 25 l PCR
reaction. RT was performed using the same conditions described above. This created the
cDNA that was subsequently used for the quantitative real-time PCR assays. PCR was
performed on the Eppendorf Realplex instrument (Eppendorf) and standard curves were
evaluated using the program’s software. Standards for each gene were created from
15
recombinant vectors constructed in our laboratory and were diluted to concentrations of 3
copies/ml, 30 copies/mL, 300 copies/mL, 3000 copies/mL, 3E4 copies/mL, 3E5
copies/mL, and 3E6 copies/mL. Standards and samples were tested in triplicate. The
concentration of primers and the reaction conditions were established to ascertain
minimal primer dimer and/or non specific product formation and hence increase the
specificity of the real-time PCR.
Gene
Primers
Conc.
primer
(µM)
Melting
time
at 95°C
(sec)
Annealing
time
at 65°C
(sec)
Extention
time
at 72°C
(sec)
CES2
F 5’-CCATGGTGATGAGCTTCCTTTTGT-3’
0.5
30
30
60
R 5’-AGGTATTGCTCCTCCTGGTCGAA-3’
CES1
F 5’- AGAGGAGCTCTTGGAGACGACAT-3’
0.2
30
30
60
R 5’- ACTCCTGCTTGTTAATTCCGACC-3’
TOPO I
F 5’-CGTTCTACCAGGCAAATTCACTGT-3’
0.3
20
15
40
R 5’-TGAAATGGGAGAGAGGGAAGGGA-3’
β-GUS
F 5’-TCAACAAGCATGAGGATGCGGAC-3’
0.3
30
30
60
R 5’-TACGCACCACTTCTTCCATCACC-3’
TP
F 5’-AATGTCATCCAGAGCCCAGAGCA-3’
0.5
30
30
60
R 5-GAACTTAACGTCCACCACCAGAG-3’
TS
F 5’-TTTACCTGAATCACATCGAGCCAC-3’
0.5
30
30
20
R 5’-GACTGACAATATCCTTCAAGCTCC-3’
DPD
F 5’-GGTCTTCAGTTTCTCCATAGTGGT-3’
0.5
20
20
45
R 5’-GACTCTGTCCATCCCAGTCTTGT-3’
Table 3. Forward (F) and Reverse (R) Primers for Real-Time PCR: Reaction
parameters were 50°C for 2 min, 95°C for 10 min, followed by 40 cycles PCR with the
temperature and times listed in the table.
16
IV. Patient Data
There were 22 patients enrolled in the study. Ages ranged from 36-67, with the median
age being 54 years. Samples were obtained for 21 patients. Of these patients, high-
quality RNA was obtained from 18 samples.
V. Correlative Analysis
Correlative analysis was done using graphpad prizm. Data was analyzed using Wilcoxin
matched paired t-test for comparing normal and tumor paired samples. The entire group
of patients was analyzed as a single group. In addition, post-treatment surgical samples
were obtained from some patients and the gene expression levels were compared before
and after treatment. Unpaired t-test analysis of samples was also done, based on patient
response.