TRANSCRIPTIONAL REGULATION OF THE HUMAN ALCOHOL DEHYDROGENASES AND ALCOHOLISM
Bạn đang xem bản rút gọn của tài liệu. Xem và tải ngay bản đầy đủ của tài liệu tại đây (1.9 MB, 215 trang )
TRANSCRIPTIONAL REGULATION OF THE HUMAN
ALCOHOL DEHYDROGENASES AND ALCOHOLISM
Sirisha Pochareddy
Submitted to the faculty of the University Graduate School
in partial fulfillment of the requirements
for the degree
Doctor of Philosophy
in the Department of Biochemistry and Molecular Biology,
Indiana University
September 2010
ii
Accepted by the Faculty of Indiana University, in partial
fulfillment of the requirements for the degree of Doctor of Philosophy.
Howard J. Edenberg, Ph.D., Chair
Maureen A. Harrington, Ph.D.
Doctoral Committee
David G. Skalnik, Ph.D.
Ann Roman, Ph.D.
July 30, 2010
iii
This work is dedicated to my parents and my brother for their unwavering support
and unconditional love.
iv
ACKNOWLEDGEMENTS
I would like to sincerely thank my mentor Dr. Howard Edenberg, for his
guidance, support throughout the five years of my research in his lab. It has been
an amazing learning experience working with him and I am confident this training
will help all through my research career.
I would like to thank members of my research committee, Dr. Maureen
Harrington, Dr. David Skalnik and Dr. Ann Roman. I am grateful to them for their
guidance, encouraging comments, time and effort. I greatly appreciate Dr.
Harrington’s questions during the committee meeting that helped me think
broadly about my area of research. I am very thankful to Dr. Skalnik for reading
through my manuscript and giving his valuable comments. My special thanks to
Dr. Ann Roman for staying on my committee even after her retirement.
I am also thankful to Dr. Jeanette McClintick for her patience in answering
my never ending list of questions about the microarray analysis. She also had
been a great support during the tough times in the lab. I would like to thank her
making an effort to remember birthdays of all lab members and baking her
awesome brownies.
I would like to thank other lab members, Ron Jerome, Jun Wang and
Sowmya Jairam. It was a great pleasure to know Ron during the last year of my
stay. He made the toughest years of Ph.D. less stressful and more fun. Jun was
always helpful in the lab. I am also thankful to Sowmya for sharing her ideas with
me and helping me think more about ADH transcriptional regulation. I would also
like to thank Dr. Xiaoling Xuei and Dr. Yunlong Liu for all their help.
v
I would like to thank my best friends, Dr. Sirisha Asuri and Dr. Raji
Muthukrishnan for their beautiful, unconditional friendship. I am also thankful to
my other friends Sulo, Aditi, Heather, and Chandra for all the fun.
Finally, I would like to thank my family members. My mom Prabhavathy
and my dad P.S. Reddy have been there for me always, supporting all my
decisions. They have been with me through the highs and the lows and always
made me believe that everything is going to be fine. My dream of doing research
and getting a Ph.D. would not have been possible without their strong emotional
support. Another pillar of support in my life is my brother Subhash. He is my
guide, teacher, friend, brother and has been a great source of strength in the
most difficult times. Anna, thank you so much for everything. I would also like to
thank my sister-in-law, Jhansi for being a sister I never had and a great friend.
Lastly, I would like to thank cute little ones - my nephew Arjun, my niece Megha,
Nishant, Niha and Charan, for lifting my spirits with their innocent smiles.
vi
ABSTRACT
Sirisha Pochareddy
TRANSCRIPTIONAL REGULATION OF THE HUMAN ALCOHOL
DEHYDROGENASES AND ALCOHOLISM
Alcohol dehydrogenase (ADH) genes encode proteins that metabolize
ethanol to acetaldehyde. Humans have seven ADH genes in a cluster. The
hypothesis of this study was that by controlling the levels of ADH enzymes, cis-
regulatory regions could affect the risk for alcoholism. The goal was thus to
identify distal regulatory regions of ADHs. To achieve this, sequence
conservation across 220 kb of the ADH cluster was examined. An enhancer (4E)
was identified upstream of ADH4. In HepG2 human hepatoma cells, 4E
increased the activity of an ADH4 basal promoter by 50-fold. 4E was cell specific,
as no enhancer activity was detected in a human lung cell line, H1299. The
enhancer activity was located in a 565 bp region (4E3). Four FOXA and one
HNF-1A protein binding sites were shown to be functional in the 4E3 region. To
test if this region could affect the risk for alcoholism, the effect of variations in
4E3 on enhancer activity was tested. Two variations had a significant effect on
enhancer activity, decreasing the activity to 0.6-fold. A third variation had a small
but significant effect. The effect of variations in the ADH1B proximal promoter
was also tested. At SNP rs1229982, the C allele had 30% lower activity than the
A allele.
vii
In addition to studying the regulatory regions of ADH genes, the effects of
alcohol on liver-derived cells (HepG2) were also explored. Liver is the primary
site of alcohol metabolism, and is highly vulnerable to injuries due to chronic
alcohol abuse. To identify the effects of long term ethanol exposure on global
gene expression and alternative splicing, HepG2 cells were cultured in 75 mM
ethanol for nine days. Global gene expression changes and alternative splicing
were measured using Affymetrix GeneChip® Human Exon 1.0 ST Arrays. At the
level of gene expression, genes involved in stress response pathways, metabolic
pathways (including carbohydrate and lipid metabolism) and chromatin regulation
were affected. Alcohol effects were also observed on alternative transcript
isoforms of some genes.
Howard J. Edenberg, Ph.D.
Committee Chair.
viii
TABLE OF CONTENTS
LIST OF TABLES xii
LIST OF FIGURES xiii
ABBREVIATIONS xiv
I. INTRODUCTION 1
1. Alcohol dehydrogenases 1
2. Human ADH cluster 5
3. Additional pathways of alcohol metabolism 6
4. Alcoholism 7
5. ADHs and alcoholism 9
6. Transcriptional regulation of ADHs 11
7. Identification of cis-regulatory regions 17
8. Transcription factors 18
8.a. FoxA family 19
8.b. HNF-1A 20
9. Alcohol and the liver 21
10. Alternative transcript isoforms and diseases 24
11. Global transcriptional profiling 27
12. Research objectives 32
ix
II. MATERIALS AND METHODS 34
1. Identification of putative distal regulatory elements 34
2. Cloning of test fragments 34
3. Transient transfections and reporter gene assays 38
4. Electrophoretic mobility shift assays (EMSA) 40
5. Site directed mutagenesis 42
6. Generation of the 4E haplotypes 42
7. Long-term treatment of HepG2 cells with ethanol 44
8. RNA extraction, labeling and hybridization 44
9. Exon array data analysis 45
10. Validation of differential gene expression by qRT-PCR 51
11. Validation of alternative splicing by qRT-PCR 52
III. RESULTS 54
1. Identification of an enhancer in the ADH cluster 54
2. Characterization of the enhancer element 4E 58
2.a. Effect of 4E on heterologous promoters 58
2.b. Function of 4E in non-hepatoma cells 58
2.c. Localization of sequences required for 4E enhancer activity 59
2.d. Identification of potential protein binding sites in 4E 61
2.e. Effect of mutations on enhancer activity 66
x
3. Effects of regulatory variations on gene expression 68
3.a. Effects of natural variations on 4E3 enhancer activity 68
3.b. Effects of polymorphisms on ADH1B promoter activity 71
4. Effects of alcohol on gene expression 77
4.a. Validation of differential gene expression results by qRT-PCR 106
5. Effects of chronic alcohol exposure on RNA splicing 108
5.a. Validation of differential alternative splicing 127
IV.DISCUSSION 130
1. Regulation of ADHs by distal cis-regulatory regions 130
2. Regulatory variations and effects on function 133
3. Effects of alcohol on gene expression 136
3.a. Acute phase response 137
3.b. Nrf2 oxidative stress response pathway 139
3.c. Amino acid metabolism 141
3.d. Carbohydrate metabolism 142
3.e. Lipid metabolism 143
3.f. Genes involved in chromatin regulation 146
3.g. Genes associated with alcoholism 147
4. Effects of alcohol on alternative splicing 147
5. Future directions 150
xi
APPENDIX 153
REFERENCES 176
CURRICULUM VITAE
xii
LIST OF TABLES
Table 1. Tissue distribution and substrate specificity of human ADH isozymes. 3
Table 2. Primers used to clone test fragments. 36
Table 3. Putative distal regulatory elements. 37
Table 4. Oligonucleotides used in EMSA. 41
Table 5. Primers used in site-directed mutagenesis. 43
Table 6. Primers used for validation of alternative splicing. 53
Table 7. Cell specific activity of 4E. 59
Table 8. Allele and genotype frequencies of SNPs in the 4E3 region. 69
Table 9. Allele and genotype frequencies for two SNPs in the ADH1B
proximal promoter region. 72
Table 10. Tested haplotypes of the ADH1B proximal promoter. 74
Table 11. Effects of ethanol on gene expression at different false discovery
rates. 79
Table 12. Pathways affected by chronic ethanol exposure. 84
Table 13. Differentially expressed genes within pathways that were
significantly affected by chronic alcohol exposure. 105
Table 14. Effects of chronic ethanol exposure on splicing at different false
discovery rates. 108
Table 15. Probe sets probably differentially alternatively spliced in response
to chronic ethanol treatment. 126
xiii
LIST OF FIGURES
Figure 1. The primary pathway of alcohol metabolism. 1
Figure 2. Diagram of the human ADH cluster. 5
Figure 3. Schematic representation of cis-acting elements in the proximal
promoters of ADH genes. 13
Figure 4. Generation of alternative transcript isoforms. 26
Figure 5. Exon array data analysis. 50
Figure 6. Location of the tested putative regulatory regions. 55
Figure 7. Six putative regulatory regions decrease transcription. 56
Figure 8. 4E enhances the activity of the ADH4 promoter. 57
Figure 9. The enhancer function of 4E is located in a 565 bp region. 60
Figure 10. Annotated genomic sequence of the 4E3 region. 62
Figure 11. FOXA proteins bind to putative sites in 4E3. 63
Figure 12. HNF-1A competitor increases FOXA binding. 65
Figure 13. Effects of site-directed mutations on enhancer function. 67
Figure 14. Effects of polymorphisms on enhancer function. 70
Figure 15. Variations in the ADH1B proximal promoter region. 74
Figure 16. Variations in the ADH1B promoter affect activity. 76
Figure 17. Distribution of fold changes of differentially expressed genes. 79
Figure 18. qRT-PCR validation of differential gene expression. 107
Figure 19. 5’ and 3’ edge effects in exon array data. 111
Figure 20. Examples of different groups of alternatively spliced genes. 114
Figure 21. Detection of alternative isoforms for validation. 129
xiv
ABBREVIATIONS
µg microgram
µl microliter
µM micromolar
0
C
degree centigrade
1Basal
ADH1B proximal promoter
4Basal
ADH4 proximal promoter
ADH
alcohol dehydrogenase
ALDH
aldehyde dehydrogenase
ANOVA
analysis of variance
AP-1
activator protein-1
Arg
arginine
bp
base pair
C/EBP
CCAAT/ enhancer binding protein
cDNA
complementary DNA
CDS
coding sequence
ChIP
chromatin immunoprecipitation
cm
centimeter
cRNA
complementary RNA
Ct
cycle threshold
CTF
CCAAT transcription factor
CYP2E1
cytochrome P450 2E1
xv
Cys
cysteine
DBP
albumin D-site binding protein
DNA
deoxyribo nucleic acid
DNase
deoxyribonuclease
DSM
diagnostic and statistical manual of mental disorders
DTT
dithiothreitol
ECM
extra cellular matrix
EDTA
ethylene diamine tetraacetic acid
EMSA
electrophoretic mobility shift assay
EST
express sequence tag
FB1
factor binds to the inducer of short transcript of Human
Immunodeficiency virus-1
FBS
fetal bovine serum
FDR
false discovery rate
FoxA
forkhead box protein A
GI
gastrointestinal
Gln
glutamine
GRE
glucocorticoid response element
GSH
reduced glutathione
GSNO
S-nitrosoglutathione
h
hour(s)
Hap
haplotype
His
histidine
xvi
HMGSH
S-(hydroxymethyl) glutathione
HNF-1A
hepatocyte nuclear factor 1 alpha
ICD
international classification of diseases
IgG
immunoglobulin G
Ile
isoleucine
kb
kilo base pair
kDa
kilodalton
LCR
locus control region
M
molar
MEM
minimum essential medium
min
minute(s)
ml
milliliter
mM
millimolar
mRNA
messenger RNA
NaCl
sodium chloride
NAD
+
nicotinamide adenine dinucleotide, oxidized
NADH
nicotinamide adenine dinucleotide, reduced
ng
nanogram
nm
nanometer
PBS
phosphate buffered saline
PCR
polymerase chain reaction
PLIER
probe logarithmic intensity error
pmol
picomoles
xvii
qRT-PCR
quantitative reverse transcription polymerase chain reaction
RIN
RNA integrity number
RMA
robust multi-array analysis
RNA
ribonucleic acid
s
second(s)
SNP
single nucleotide polymorphism
Sp1
specificity protein 1
SV40Basal
SV40 promoter
TBE
tris-borate EDTA buffer
TCA
tricarboxylic acid
TSS
transcription start site
UCSC
University of California, Santa Cruz
USF
upstream stimulatory factor
Val
valine
1
I. INTRODUCTION
1. Alcohol dehydrogenases
Medium-chain alcohol dehydrogenases (ADH) catalyze the reversible
oxidation of ethanol and other alcohols to acetaldehyde (Edenberg and Bosron,
1997; Zakhari, 2006). ADHs are dimeric proteins that utilize NAD
+
as the
coenzyme. Each ADH subunit is 40 kDa, binds two zinc ions and has catalytic
and coenzyme binding domains (Hurley et al., 2002).
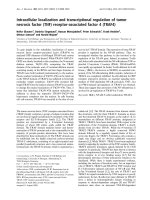
Figure 1. The primary pathway of alcohol metabolism. ADH, alcohol
dehydrogenase; ALDH, aldehyde dehydrogenase
Based on their sequence homology and kinetic properties, ADHs have
been classified into different classes. In vertebrates, eight classes (I to VIII) have
been identified, with no species encoding all eight classes (Duester et al., 1999;
Peralba et al., 1999). Enzymes in classes I to V are present in multiple species
including humans. Class VI is found only in rats and the deer mouse (Hoog and
Brandt, 1995; Zheng et al., 1993). Classes VII and VIII are found in the chicken,
and the amphibians, respectively (Kedishvili et al., 1997; Peralba et al., 1999).
Less than 70% sequence homology has been observed between different
classes, and only proteins within a class form dimers. The class III enzyme is the
only ADH enzyme seen in invertebrates and thus is considered the ancestral
Ethanol Acetaldehyde Acetate
NAD
+
NADH
NAD
+
NADH
ADH ALDH
2
form that gave rise to other isozymes (Cederlund et al., 1991; Danielsson and
Jornvall, 1992).
In humans there are seven ADH isozymes including three class I proteins.
Class I proteins α, β and γ share greater than 90% similarity and can form homo-
or heterodimers (Edenberg, 2000). The Class II ADH includes the π polypeptide;
the class III includes the χ polypeptide; the Class IV, has the σ polypeptide
isozyme, and no endogenous protein has been reported for class V.
3
Table 1. Tissue distribution and substrate specificity of human ADH
isozymes. HMGSH is S-(hydroxymethyl) glutathione and GSNO is S-
nitrosoglutathione
1
(Smith et al., 1971)
2
(Smith et al., 1972)
3
(Smith, 1986)
4
(Duley et al., 1985)
5
(Allali-Hassani et al., 1997)
6
(Estonius et al., 1996)
7
(Yin et al., 1990)
8
(Yokoyama et al., 1995)
9
(Zgombic-Knight et al., 1995)
10
(Dong et al., 1996)
11
(Yin et al., 1993)
12
(Edenberg and Bosron, 1997)
13
(Yang et al., 1994)
14
(Kaiser et al., 1991)
15
(Koivusalo and Uotila, 1991)
16
(Staab et al., 2008)
Class
Gene
Protein
Tissue distribution
Common substrates
I
ADH1A
α
fetal and adult liver
1,2
,
adult kidney
3
, adrenal
gland
6
ethanol
12
, retinol
13
I
ADH1B
β
fetal and adult liver
1,2
,
adult kidney
1,4
, lung
1,4
,
blood vessels
5
, adrenal
gland
6
ethanol
12
, retinol
13
I
ADH1C
γ
adult liver
2
, fetal
kidney
1
, adrenal gland
6
ethanol
12
, retinol
13
II
ADH4
π
fetal and adult liver
1,6
,
stomach
6
, intestine
6
,
pancreas
6
ethanol
12
, retinol
13
III
ADH5
χ
ubiquitous in adult
4
,
6
and fetus
6
HMGSH
14,15
, GSNO
16
IV
ADH7
σ
adult stomach
7,8
, upper
GI tract
10,11
, fetal liver
6
retinol
13
, ethanol
12
V
ADH6
None
as mRNA in fetal and
adult liver
6
ethanol
12
4
The seven ADH isozymes have overlapping substrate specificities (Table
1). All isozymes are active with ethanol, albeit with different Vmax and Km values
(Edenberg and Bosron, 1997; Hurley et al., 2002). Class I enzymes have the
lowest Km for ethanol and account for approximately 70% of alcohol metabolism
in the liver (Hurley et al., 2002). Class II π- ADH, which has a Km of 34 mM for
ethanol, contributes to most of the remaining 30% of alcohol metabolism in the
liver (Hurley et al., 2002; Li et al., 1977). Class IV ADH has an intermediate Km
value but the highest Vmax for ethanol (Kedishvili et al., 1995). It contributes
mostly to alcohol metabolism in the stomach, where it is present at maximum
concentration (Yin et al., 1990; Yokoyama et al., 1995). Class III ADH is a
glutathione-dependent formaldehyde dehydrogenase that metabolizes
glutathione adducts such as S-(hydroxymethyl) glutathione (HMGSH) and S-
nitrosoglutathione (GSNO) more efficiently than primary alcohols and aldehydes
(Kaiser et al., 1991; Koivusalo and Uotila, 1991; Staab et al., 2008).
In addition to dietary alcohol, other physiological substrates of ADH
enzymes have been identified. One important substrate is retinol (vitamin A).
Class I, II, and IV enzymes catalyze the oxidation of retinol to retinaldehyde, the
first step in the synthesis of retinoic acid (Yang et al., 1994). Class IV ADH is the
most active form of retinol dehydrogenase (Zgombic-Knight et al., 1995). Gene
deletion studies in mice have shown that the Class IV ADH is protective against
retinol deficiencies in the diet (Deltour et al., 1999; Molotkov et al., 2002). Other
physiological substrates of ADHs include cytotoxic aldehydes generated during
lipid peroxidation (Boleda et al., 1993), ω-hydroxy fatty acids (Boleda et al.,
5
1993), 3β-hydroxy-5β steroids (McEvily et al., 1988), 4-hydroxy-3methoxyphenyl
ethanol (Mardh and Vallee, 1986) and 4-hydroxy-3methoxyphenyl glycol (Mardh
et al., 1986; Mardh et al., 1985).
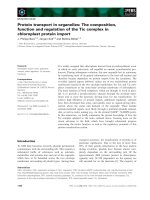
2. Human ADH cluster
In humans the seven ADH isozymes are encoded by seven genes
ADH1A (encodes α), ADH1B (β), ADH1C (γ), ADH4 (π), ADH5 ( χ), ADH6 (no
protein; only mRNA), ADH7 (σ) (Table 1 ). The seven genes are present as a
cluster spanning approximately 365 kb on chromosome 4q23 (Figure 2); a similar
clustering of ADH genes is also observed in other mammals. In humans, all the
seven genes have nine exons and eight introns (Edenberg, 2000). The direction
of transcription is also the same and is from qter to pter (shown in the reverse
orientation in Figure 2).
Figure 2. Diagram of the human ADH cluster. Seven alcohol dehydrogenase
genes are shown in their transcriptional orientation (they are oriented on the
chromosome 4q in the opposite direction). Arrows mark the genes and depict the
direction of transcription. The genes range in size from 14.5 kb to 23 kb;
intergenic distances are given in kb.
6
All ADH genes except ADH7 are expressed at the highest levels in the
liver; ADH7 is highly expressed in the stomach and the upper gastrointestinal
tract (Edenberg, 2000). In other tissues they are expressed to lower levels and
each class has a distinct pattern of expression. ADH5 is ubiquitously expressed
and thus is the only ADH present in the brain. Tissue distribution of ADHs is
summarized in Table 1.
With the exception of ADH1C, all ADHs are detected in fetal liver
(Estonius et al., 1996). Class I ADHs exhibit temporal expression patterns during
development. ADH1A and ADH1B are expressed in early (second trimester) and
late (third trimester) fetal liver, respectively (Smith et al., 1971, 1972). Expression
of ADH1C is observed only after birth (Smith et al., 1972). Once expressed,
ADHs are expressed constitutively in adult organisms.
3. Additional pathways of alcohol metabolism
In humans, alcohol is metabolized predominantly in the liver by ADHs.
Besides ADHs, oxidative metabolism of alcohol is also catalyzed by cytochrome
P450 enzymes including (CYP2E1, CYP1A2 and CYP3A4) and hydrogen
peroxide-dependent catalase (Handler et al., 1986; Handler and Thurman, 1988;
Lieber, 2004; Lieber and DeCarli, 1968; Salmela et al., 1998; Zakhari, 2006).
These three enzyme systems are localized to different sites within a cell; ADHs
are present in the cytosol. CYP2E1 and catalase are present in microsomes and
peroxisomes, respectively (Handler and Thurman, 1988; Lieber, 2004; Zakhari,
2006). The contribution of CYP2E1 to alcohol metabolism is minor because
7
CYP2E1 is induced only at elevated concentrations (Badger et al., 1993; Zakhari,
2006). Catalase also has a small role as it is limited by the availability of
hydrogen peroxide (Lieber, 1984; Zakhari, 2006). Acetaldehyde generated from
alcohol by any of these enzymes is further metabolized to acetate by aldehyde
dehydrogenases (ALDH) (Hurley et al., 2002).
4. Alcoholism
Alcoholism is a complex disease affecting millions in the world, including 4
to 5% of the population in the United States at any given time (Li et al., 2007).
Chronic alcohol abuse is associated with numerous health risks such as liver
cirrhosis, cancer and cardiovascular disease (Cargiulo, 2007; Rehm et al., 2003).
In addition, it has undesirable social consequences: traffic accidents, domestic
violence, sexual assault and child malnutrition; it is the third leading cause of
preventable deaths in the United States (Mokdad et al., 2004).
Diagnostic criteria for alcoholism have been defined in Diagnostic and
Statistical Manual of Mental Disorders (DSM) and International Classification of
diseases (ICD). According to the most recent DSM criteria (DSM-IV), a person is
said to be alcohol dependent if he or she exhibits a maladaptive pattern of
drinking with three or more of the following symptoms occurring at any time in a
period of one year: tolerance, withdrawal, impaired control, neglect of activities,
excessive time spent in alcohol-related activity and/or continued use despite
knowledge of the problem (Grant, 1996; Hasin, 2003).
8
Alcoholism is influenced by both genetic and environmental factors.
Evidence for genetic risk was obtained from family, twin and adoption studies
(Birley et al., 2005; Goodwin et al., 1973; Goodwin et al., 1974; Kendler et al.,
1997; Mayfield et al., 2008; McGue, 1997; McGue, 1999; Nurnberger et al., 2004;
Prescott et al., 1999; Prescott and Kendler, 1999). Monozygotic twins of
alcoholics exhibit greater risk for alcoholism whereas dizygotic twins of alcoholics
are at approximately the same risk as full siblings (Kendler et al., 1997; Prescott
et al., 1999). Children adopted away from alcoholic parents exhibit the same risk
as the children brought up by their biological parents, further supporting the role
of genetics in the risk for alcoholism (Goodwin et al., 1973; Goodwin et al., 1974).
Together these studies suggest that greater than 50% of the risk for the disease
is from genetic factors.
Several studies have been carried out to identify genes associated with
the risk for alcoholism. ADH and ALDH were the first genes to be associated with
alcoholism (Bosron and Li, 1986). Gamma-aminobutyric acid A receptor, alpha 2
(GABRA2) (Edenberg et al., 2004), cholinergic receptor, muscarinic 2 (CHRM2)
(Luo et al., 2005; Wang et al., 2004), cholinergic receptor, nicotinic, alpha 5
(CHRNA5) (Wang et al., 2009), opioid receptor, kappa 1 (OPRK1) (Edenberg et
al., 2008a; Xuei et al., 2007; Zhang et al., 2008a), nuclear factor of kappa light
polypeptide gene enhancer in B-cells 1 (NFKB1) (Edenberg et al., 2008b) are
some of the genes that have been reported recently in genome-wide association
studies.