Studying on the actual status of the vegetation cover and the process of natural forest recovery in Vi Xuyen district, Ha Giang province (Nghiên cứu hiện trạng thảm thực vật và quá trình phục hồi rừng tự nhiên ở huyện Vị Xuyên, tỉnh Hà Giang)
Bạn đang xem bản rút gọn của tài liệu. Xem và tải ngay bản đầy đủ của tài liệu tại đây (308.73 KB, 27 trang )
THE MINISTRY OF EDUCATION AND TRAINING
THAI NGUYEN UNIVERSITY
DO KHAC HUNG
STUDYING ON THE ACTUAL STATUS OF THE VEGETATION
COVER AND THE PROCESS OF NATURAL FOREST RECOVERY
IN VI XUYEN DISTRICT, HA GIANG PROVINCE
Speciality: ECOLOGY
Code: 62 42 01 20
ABSTRACT OF PH.D. DISSERTATION IN BIOLOGY
Thai Nguyen – 2014
The study has fulfilled at Thai Nguyen University of Education of
Thai Nguyen University
Scientific supervisors:
1. Assoc. Prof. Dr. Le Ngoc Cong
2. Prof. Dr. Sci. Tran Dinh Ly
Opponent 1:
Opponent 2:
Opponent 3:
The dissertation can be found at:
- The national library
- Leaning Resource Center of Thai Nguyen University
- The Library at University of Education of Thai Nguyen University
1
FOREWORDS
1. Reason for choosing the study
In the 21
st
century, human beings have witnessed the terrible
consequences caused by climate changes such warming phenomenon of
the earth, the rise and unusual appearance of storms, floods, land
degradation, epidemics, declining biodiversity, etc. They affect lives of
hundreds of millions of people on earth.
Being aware of serious harms caused by climate change, on the 17
th
August 2004, the Prime Minister has approved "Strategic Orientation for
Sustainable Development in Vietnam". It is until 2020, forest coverage
of our country will reach 45%.
Vi Xuyen district has a total large forest area. However, shifting
cultivation, nomadic life, deforestation for cultivation and exploitation of
forest resources make forest quality of serious deterioration.
Due to the above reasons, I choose the research thesis "Studying on the actual
status of the vegetation cover and the process of natural forest recovery
in Vi Xuyen district, Ha Giang province ".
2. The objectives of the study
It determines and analyzes several characteristics of the vegetation
cover types in Vi Xuyen district.
It clarifies the differences in physical, chemical and microbiological
properties and land animals of different vegetation types as a basis for
proposals of forest rehabilitation measures.
3. The research scope
- In term of plants and soil environment, broad-leaved vegetation
cover types on soil hills, higher vascular flora and soil environment
under the vegetation cover types are studied.
- In term of causes of forest degradation, it focuses on study activities
caused forest degradation.
- The studied selected site has similar characteristics such as topography,
climate, exposed direction, parent rock, impacts of human, etc.
- The dissertation is only to study the vegetation cover types that
trends of upward succession of natural forest recovery.
- Contains no climate research plant populations due to time and.
- The dissertation does not study the climate of plant populations
due to time and limitations of equipments.
2
4. The scientific meaning and practice of the dissertation
4.1. In term of theory,
With the scientific data, the regenerated law and upward succession of
natural forest recovery in Vi Xuyen district have shed light on
It contributes to clarify the relationship between vegetation cover
with soil environmental factors in the recovery process of natural forests
in Vi Xuyen district.
4.2. In terms of practice,
Some solutions are proposed to restore natural forests to reach high
efficiency in Vi Xuyen district, Ha Giang province.
The results of the dissertation provide the instruction material in
service of specialized teaching and research at universities and colleges.
5. Novel ccontribution of the dissertation
It studies systematically on the vegetation cover and flora in Vi
Xuyen district, Ha Giang province.
It provides the scientific material on the recovery process of
natural forests in Vi Xuyen district, Ha Giang province.
6. Structure of the dissertation
The dissertation consists of 127 pages. Apart from the foreword
part with 3 pages and two pages of conclusions and recommendations.
The main contents of the dissertation are presented in four chapters:
Chapter 1. Literature review includes 34 pages; Chapter 2. Objects of
contents and research methods consist of 8 pages; Chapter 3. Conditions
on nature, economic – society at studies area with 15 pages; Chapter 4
research results and discussion include 65 pages. There are 27 tables, 18
figures, annexes on component of regenerated plants composition of
regenerated plants and photos.
Chapter 1
LITERATURE REVIEW
To achieve the purpose of study and successful implementation of
research contents set forth, the dissertation refers to some concepts
related topics: vegetation, forest regeneration, forest secondary, etc.
There are 116 research literatures referred in the dissertation (103 Vietnamese
papers, 13 English papers) regarding the following major issues:
* The studies on vegetation classification
In the world and in Vietnam, the scientific research works on vegetation
are very abundant, including quantity of research papers as well as the
principles and methods of vegetation classification. Each classification system
also has advantages and disadvantages. In the dissertation, we select the
classified frame of UNESCO (1973) as a basis for classifying vegetation in
Vi Xuyen district, Ha Giang province.
3
* The studies related to regeneration, succession and forest regeneration
There are many research papers about the recovery process of natural
forest or the regeneration promoted process and succession process of forest
vegetations. Authors study process on regeneration, forest regeneration with
multiple objects of different vegetations (secondary forest, shrub vegetation,
grass vegetation) with methods abundant and suitable to each subject.
* The studies the interaction between vegetation and soil
In the world and in Vietnam, there are many scientific studies works on
the relationship between vegetation and soil environment. Authors’ results of
studies have confirmed that effects of the land reclamation vegetation are
very significant
Chapter 2
SUBJECTS, CONTENTS AND METHODS OF STUDY
2.1. Subjects of the study
The vegetation cover types of natural recovery in Vi Xuyen district, Ha
Giang province include: grass, low shrubs, high shrubs and secondary forests.
2.2. Research Contents
1. It is the current status of vegetation cover in Vi Xuyen district, Ha
Giang province
2. The changes of key elements in the process of upward succession
are from grass vegetation, low shrub vegetation, high shrub vegetation to the
secondary forest in Vi Xuyen district, Ha Giang province.
3. It is to evaluate possibility and propose some solutions to restore
of natural forests in Vi Xuyen district, Ha Giang province
2.3. Research duration
Duration is from 2011 to 2013
2.4. Research method
2.4.1. Methodology
2.4.2. Specific research methods
2.4.2.1. Survey Method
During the research process of data collection, we use the method
of survey routes and standard plots of Hoang Chung (2008) and Nguyen
Nghia Thin (2004).
* The method of survey routes (SR)
The first survey route is perpendicular to the fundamental contour
line. The following survey routes are parallel to the first survey route.
Total survey routes are 15.
* The method of standard plots (SP)
On each survey route, standard plots are created and distributed
evenly in each vegetation cover type. Total standard plots are 60
4
In each standard plot (SP) in the secondary forest, there are five slab
cells (SC) established and arranged at corners those are intersections of
two diagonals of standard plots.
Samples are collected in standard plots and slab cells. Method for
collection of samples is similar to that of survey routes. In addition, it
measures total tree height (TTH), diameter at breast height (DBH),
counts regenerating trees and evaluate the original source and quality of
regenerating trees.
* The method of positioned cells (PC)
In each vegetation cover type, some specific standard plots chosen to
use as positioned cells (PC). Total positioned cells chosen are 9.
2.4.2.2. Sampling Method
* Plant sampling: Data collection in survey routes and in standard plots (SP)
* Soil sampling: Digging soil profile, taken land for the analysis of
physical and chemical properties and microorganisms and sampling of
soil animals.
2.4.2.3. Methods of analysis and data processing
* Analysis of plant samples: Determination scientific names, local names
of the plant species.
* Analysis of soil samples
Description of soil profile under the method Le Van Khoa et al, 1998.
The analysis of physical and chemical properties and microorganisms and
soil animals at Institute of Chemistry, Institute of Biotechnology,
Institute of Ecology and Biological Resources (Vietnam Academy of
Science and Technology).
The analytical results are processed by biostatistical methods of
Microsoft Excel software of computer.
Chapter 3
NATURAL AND SCIO-ECONOMIC CONDITIONS
IN THE STUDY SITE
3.1. Natural conditions
Vi Xuyen district is the low mountainous district of Ha Giang
province with a forcefully divided and complex terrain. Its height above
mean sea level is 500 meters. Therefore, system of rivers and streams in
the district is rather dense. However, they are mostly small streams with
large slopes. There is only Lo River that is the largest river.
Vi Xuyen district’s climate is affected by climate of the Northeast
region. It is due to be located deeply inland; entire district is less affected by
rainstorms in summer and Northeast monsoon than the Northern Delta area.
5
3.2. Scio-economic conditions
Vi Xuyen district has a population of 100,800, accounting for
13.5% of the provincial population with average population density of
66.7 persons per km
2
. The structure is quite diverse nation, with more
than 20 ethnic groups living together: Tay, Kinh, Dao, Mong, Nung,
Giay, Pa Then, Hoa, Lo Lo, etc., of which, Tay ethnic group accounts for
the most proportion (36.1%). The ethnic groups have a unique cultural
identity, disparities on development level, education proficiency and
living standard.
Chapter 4
RESULTS AND DISCUSSION
4.1. Current status of vegetation covers in Vi Xuyen district, Ha
Giang province
4.1.1.
Current situation of use of forest land in Vi Xuyen district, Ha
Giang province
Table 4.1: Current status of forest land under 3 forest types of Vi Xuyen district
Soil type,
forest type
Production
forest (ha)
Protective
forests (ha)
Special use
forest (ha)
Total (ha)
Forest Land
65,708.56 27,688.20 25,294.60 118,691.36
1.
Land with forests 51,869.96 25,268.40 24,933.70 102,072.06
-
Natural forest 39,255.26 23,066.50 22,701.10 85,022.86
-
Planted forests 12,614.70 2,196.70 2,201.90 17,043.70
2.
Land without forests
13,838.60 2,419.80 360.90 16,619.30
(Source: Results of planning review of forest types in Vi Xuyen district, 2012)
The area of forest land of Vi Xuyen district is about 118,691.36 ha
and accounts for 79.2% of natural land area. Of which, forest land is
102.072,06 ha and accounts for about 86% of forest land area and accounts
for 68% of total natural land area; area without forest land proportion is
less than that of total area of forest land (about 14%). A large forest area is
a potential for developing forest economics (Table 4.1).
4.1.2. Current status of vegetation covers in Vi Xuyen district, Ha
Giang province
4.1.2.1. Vegetation cover types in Vi Xuyen district, Ha Giang province
According to the International Classification of Vegetation
(UNESCO 1973), in Vi Xuyen district there are following vegetation cover
types: closed forests, open forests, shrubs and grass vegetation covers.
6
4.1.2.2. Characteristics the flora in Vi Xuyen district, Ha Giang province
In the study area, the list of statistics is 557 species belonging to
393 genera, 114 families of five branches of vascular plants. Of 557
species in the study area, there are 33 rare and valuable plant species in
the Red Book of Vietnam and 7 species in ND 32/2006 ND-CP.
4.1.3. Causes of forest degradation in Vi Xuyen district, Ha Giang province
Forest area in Vi Xuyen district has been and exhaustedly exploited,
leading to serious forest degradation. The major causes of forest degradation
are logging activity, exploitation of non-timber forest products, forest fires, etc.
4.2. Changes of major factors in upward succession from grass
vegetation, low shrub vegetation, high shrub vegetation and
secondary forest in Vi Xuyen district, Ha Giang province
4.2.1. Characteristics of studied vegetation cover types
- Secondary forest (SF): It belongs to the closed forest formation
that is often green at the rainy season in low terrain and low mountains.
This vegetation type located in Trung Thanh commune had originated
after cultivating milpa with the recovery period of 25 years. The area of
forest is about 3 ha, 30
o
slope and 95-100% of land cover.
- The shrub vegetation cover (SV): it is shrub sub-formation
available timber trees distributed scattered. This vegetation type formed
on fallow and from 3 to 8 years in Dao Duc commune. Based on the
height of shrubs, we have chosen two states: high shrub vegetation (HSV)
and low shrub vegetation LSV).
- Grass vegetation cover (GV): the drought-tolerant grass formation
belongs to rice form in average of 0.5 -1 m with scattered timber trees
formed after cultivating milpa in Viet Lam commune. It has the recovery
time of from 2 to 3 years, with an area of 1.5 ha, 30
o
slope and 70-80% of
general coverage. The height of grass types is below 0.8m.
4.2.2. The change of the plant composition in types of vegetation covers
Table 4.10 Quantity of species, genera and families in vegetation
cover types
Species Genera Families Vegetation
cover types
Quant. Rate(%)
Quant.
Rate(%)
Quant. Rate(%)
GV 209 37.52 166 42.24 65 57.02
LSV 285 51.17 219 55.73 79 69.30
HSV 375 67.32 258 72.51 98 85.96
SF 343 61.58 245 62.34 88 77.19
Under the results
in Table
4.10,
the
composition of species in
high
shrub vegetation cover
is
the most abundant
(
375
species belonging to
258
genera and 98
families)
.
Then
, secondary forests and
low
shrub
7
vegetation and the lowest abundant grass vegetation
(
209
species
belonging to
166
genera and 65
families)
.
4.2.3. The change of quantity of tree species in vegetation cover types
Table 4.11: The change on quantity of tree species/standard plot
in vegetation cover types
Statistical criteria
Grass
vegetation
Low shrub
vegetation
High shrub
vegetation
Secondary
forest
Total species 45 50 58 79
Species/SP
32 3 41 4 47 4 60 5
Herbal stems
14 2 18 3 20 3 21 3
shrub stems
11 2 14 2 16 2 24 3
Climbing plants with
wood stems
2 1 3 1 3 1 5 1
Wood stems
5 1 6 1 8 2 10 2
Under the results at table 4.11, in the process of succession from
grass vegetation to secondary forest, the average total number of tree
species in each standard plot has increased gradually. Of that, in a
standard plot there are 45 species in grass vegetation, 50 species in low
shrub vegetation and 58 species in high shrub vegetation and 79 species
in secondary forest the most species.
According to the data at Table 4.12, we find that in the process of
succession there are 206 tree species weeded. Eliminated process takes
place the most strongly in secondary forests (133 species). In contrast
with the process of elimination, there are 340 added species, of which in
the stage of high shrub vegetation, there is the highest number of
additional tree species (151 species).
Table 4.12: Fluctuations in the number of species in vegetation cover types
Vegetation
types
Quantity of exis.
tree species
Quantity of tree
species weeded
Quantity of tree
species added
GV 209 - -
LSV 285 12 88
HSV 375 61 151
SF 343 133 101
Total 206 340
4.2.4. The change on density, quality and origin of regenerated plants
in vegetation cover types
4.2.4.1. The density of regenerated plants
The table 4.13 shows that the density of regenerated plants increases
rapidly in the stage of high shrub vegetation cover and secondary forests
8
(the higest density in secondary forest is 5612 tree per ha). The reason is
that in these two vegetation types, there is plentiful plant composition, a
plenty of plants providing varieties, soil in high moisture, seeds easy to
germinate and grow. So, quantity of regenerated plants is more numerous.
Table 4.13: Density, quality and origin of regenerated plants
in vegetation cover types
Quality (%) Original (%) Vegetation
cover types
Density
(tree/ha)
Good
Medium
Bad Seeds Buds
GV 3054 63.2 28.4 18.4 36.6 63.4
LSV 4057 64.7 25.7 19.6 43.5 56.5
HSV 5191 66.4 27.4 16.2 58.8 41.2
SF 5612 70.3 18.2 11.5 65.3 34.7
4.2.4.2. Quality of regenerated plants
Table 4.13 shows that rates of regenerated plants with good
quality, average quality and bad quality are from 63.2% to 70.3%, from
18.2% to 28.4% and from 11.5% to 19.6%, respectively. This is
necessary and convenient condition for faster recovered vegetation.
4.2.4.3. The origin regenerated plants
Regenerating trees originating from seeds in secondary forests and
shrub vegetation account for very high rates with a rate 65.3% and 58.8%
respectively. In contrast, those in grass vegetation cover and low shrub
vegetation account for high percentages with 56.5 % and 63.4% respectively.
4.2.5. The change of structure of formation in
vegetation cover types
4.2.5.1. The rule growing height
Table 4.14: The distribution of height H (m) of timber trees of
vegetation cover types (%)
Vegetation cover types
High levels
(m)
GV LSV HSV SF
Level I (<0.5) 42.87 14.34 8.95 2.61
Level II (0.5 -1.0) 28.57 16.09 10.44 6.80
Level III (1.0-1.5) 20.78 19.95 12.47 7.81
Level IV (1.5-2.0) 5.42 23.87 17.59 10.06
Level V (2.0-3.0) 2.36 15.06 25.11 17.22
Level VI (3.0-5.0) - 10.69 20.09 35.20
Level VII (>5.0) - - 5.35 20.3
9
(%)
0
10
20
30
40
50
I II III IV V VI VII
High level (m)
Grass vegetation
Low shrub vegetation
High shrub vegetation
Secondary forest
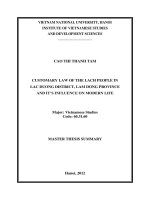
Figure 4.4: Distribution of timber trees under the high level in the
vegetation cover types
The data of Table 4.14 and Figure 4.4 shows that plant composition of
grass vegetation cover is mostly herbal plants, small shrub and timber
trees in few. However, at the low shrub vegetation, it appears some light
demanding pioneer species that grows rapidly. Then the light demanding
species are prevails and rapid development at high shrub vegetation.
Finally, at secondary forest, light demanding pioneer trees are replaced
by a combination of woody trees those are high, tall, slow-growing and
perennial.
Figure 4.4: The distribution of high level of timber trees of
secondary forest has one peak form with a distributed line shifting to the
right side.
4.2.5.2. The rule growing diameter
Table 4.15: The distribution of diameter level (D
1,3
) of timber trees of
vegetation cover types (%)
Vegetation cover types
Diameter level (cm)
GV LSV HSV SF
Level I (< 1.0) 44.37 16.43 7.98 4.59
Level II (1.0 – 1.5) 27.59 17.08 13.34 5.93
Level III (1.5 – 2.0) 19.74 27.01 17.47 10.81
Level IV (2.0 - 3.0) 5.82 19.15 30.87 18.06
Level V (3.0 – 4.0) 2.48 14.05 20.25 34.75
Level VI (> 4.0) 0 6.28 10.09 25.86
Total 100.00 100.00 100.00 100.00
10
(%)
0
10
20
30
40
50
I II III IV V VI
diameter level (cm)
Grass vegetation
Low shrub vegetation
High shrub vegetation
Secondary forest
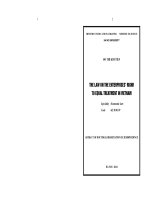
Figure 4. 5: The distribution of diameter level of timber trees of
vegetation cover types (%)
The data of Table 4.15 and Figure 4.4 shows that at grass vegetation
cover, it is mostly herbal plants, small shrub stems and timber trees with
small diameters. Therefore, the distribution of diameter is not significant.
However, there is a significant distribution of diameter with the peak
shifting to the right side.
4.2.6. The change in the growth rate of the main timber tree species
4.2.6.1. The change in height of the main timber tree species
Table 4.16: Growth rate of height of some main tree species
Duration of fieldwork
(month/year)
Ord.
Names of tree species
April 2010 Apr. 2011
Apr. 2012
H (m)
5,3 ± 0,3 5,7 ± 0,3 6,2 ± 0,4
1
Canarium
album
h (m/year)
- 0,4 ± 0,02 0,5 ± 0,03
H (m)
5,2 ± 0,3 5,6 ± 0,4 6,0 ± 0,3
2
Actinodaphne
cochinchinensis
h (m/ year)
- 0,4 ± 0,02 0,4 ± 0,02
H (m)
8,4 ± 0,4 8,8 ± 0,4 9,3 ± 0,5
3 Trevesia palmata
h (m/ year)
- 0,4 ± 0,04 0,5 ± 0,04
H (m)
10,9 ± 0,5 11,5 ± 0,5 12,1 ± 0,6
4
Styrax
tonkinensis
h (m/ year)
- 0,6 ± 0,05 0,6 ± 0,06
H (m)
9,2 ± 0,5 9,7 ± 0,5 10,2 ± 0,5
5
Pelthophorum
tonkinense
h (m/year)
- 0,5 ± 0,05 0,5 ± 0,05
H (m)
7,2 ± 0,4 7,6 ± 0,4 8,0 ± 0,5
6
Castanopsis
armata
h (m/year)
- 0,4 ± 0,03 0,4 ± 0,04
Notes. H: Height in average (m); h: the growth rate of height (m per year)
Total number trees per species measured height is n = 30 trees
11
The data in Table 4.16 shows that the growth of the average height
annually is 0.4 - 0.6m. Of which, the fastest growth is Styrax tonkinensis
(0.6m average annual growth), then Peltophorum tonkinense (0.5m per
year), Canarium album and Trevesia palmata (0.45m per year) and the
lowest growth such as Castanopsis armata and Actinodaphne
cochinchinensis (0.4 m per year).
4.2.6.2. The change in diameter of the main timber tree species
Table 4.17: Growth rate in diameter of the main timber tree species
Duration of fieldwork
(month/year)
Ord
Names of tree species
April 2010
April
2011
April
2012
D (cm)
9,1 ± 0,3 9,4 ± 0,3 9,7 ± 0,4
1
Canarium
album
d (cm/year)
- 0,3 ± 0,02 0,3 ± 0,02
D (cm)
10,7 ± 0,3 11,1 ± 0,3 11,5 ± 0,3
2
Actinodaphne
cochinchinensis
d (cm/ year)
- 0,4 ± 0,02 0,4 ± 0,03
D (cm)
16,5 ± 0,4 17,0 ± 0,4 17,5 ± 0,5
3
Trevesia
palmata
d (cm/ year)
- 0,5 ± 0,03 0,5 ± 0,04
D (cm)
18,8 ± 0,5 19,4 ± 0,5 20,0 ± 0,5
4
Styrax
tonkinensis
d (cm/ year)
- 0,6 ± 0,05 0,6 ± 0,05
D (cm)
9,6 ± 0,3 10,0 ± 0,3 10,3 ± 0,3
5
Pelthophorum
tonkinense
d (cm/ year)
- 0,4 ± 0,02 0,3 ± 0,02
D (cm)
12,7 ± 0,4 14,1 ± 0,4 14,6 ± 0,5
6
Castanopsis
armata
d (cm/ year)
- 0,4 ± 0,03 0,5 ± 0,03
Notes. D: Diameter in average (cm); d: the growth rate of diameter (m per year)
Total number trees per species measured diameter is n = 30 trees
The results in Table 4.17 shows that at the secondary forest, some
major timber tree species have from 9.1 cm to 20 cm in diameter and the
growth rate is low diameters (ranging 0.3 cm - 0.6 cm per year ). Of them,
Styrax tonkinensis is the fastest growing tree species. Therefore, their
diameters are usually larger than these other plants (20 cm) and Canarium
album that is the slowest growing tree species (0.3 cm per year in average).
4.2.7. The change of characteristics of soil profiles in the vegetation
cover types
- Of all four types of vegetation covers studied, soil profiles consist of 3
layers A, B and C. In the forest restoration process, the thickness of the
soil layers (A + B) has increased over the successional stages: the thicknesses
of soil layer in the grass vegetation cover, the low shrub vegetation, the
high shrub vegetation and the secondary forest are 60 cm, 68 cm, 72 cm
and 75 cm respectively. The secondary forest has the thickest soil layer.
12
Also, in the vegetation cover types, there is also a litter layer. However,
it is thin (1.0 cm – 4.0 cm).
- Through investigation by observing in the field with specific
colors of soil layers, it can confirm that the topsoil layer A in secondary
forest and high shrub vegetation cover has higher fertility than other
formations because it has a thicker litter layer (4.0 cm and 1.5 cm), with
grayish-brown soil, soil moisture, porosity, grain structure, etc.
4.2.8. Soil erosion level
Table 4.18: Soil erosion levels of vegetation cover types
Vegetation
types
Scattering
lam.
structure
(layer)
Thickness
of a litter
layer (cm)
Coverage
leve (%)
Soil erosion levels
GV 1 1.0 70 – 80
Light topsoil erosion
LSV 2 1.0 80 – 85
Light topsoil erosion
HSV 2 1.5 90 – 95
Not topso
il erosion
SF 3 4.0 95 – 100
Not topsoil erosion
Table 4.18 shows that, in the studied area, the grass vegetation
cover and the low shrub vegetation have low coverage (70-80%), simple
layer structure (1-2 layers) and a thin litter layer (1cm). Therefore, it
occurs light topsoil erosion. The high shrub vegetation cover and
secondary forestry have a larger coverage (90 - 100%), many layer
structure (2-3 layers), abandent species and a thicker litter layer (1.5-
4.0cm). Therefore, there is no signs of erosion.
4.2.9.The change on physic properties of soil in vegetation cover types
Table 4.19: Some
physic properties of soil in vegetation cover types
% Grain level qith
diametter (mm)
Vegetation
types
Average
(%)
Deepth
(cm)
Moi.
(%)
Porosity
(%)
0.2-0.
02
(Sand)
0.02 -0.002
(Limon)
<0.002
(Clay)
0 – 10 29.3
51.2 37.0 29.6 33.4
10-20 27.6
49.8 38.1 27.0 34.9
GV 70 - 80
20 – 30 27.0
46.5 35.9 26.1 38.0
0 – 10 35.4
54.6 29.0 34.9 36.1
10 – 20 31.7
52.4 29.9 34.4 35.7
LSV 80 - 85
20 – 30 30.1
50.8 29.1 33.2 37.7
0 – 10 58.6
58.5 27.0 35.7 37.3
10 – 20 55.0
55.2 30.6 32.9 36.5
HSV 90 - 95
20 – 30 50.3
52.0 28.1 33.8 38.1
0 – 10 65.5
65.4 24.0 29.9 46.1
10 – 20 62.7
60.4 23.3 31.1 45.6
SF 95 - 100
20 – 30 60.0
57.3 23.9 30.3 45.8
13
4.2.9.1. Soil humidity
Table 4:19 shows that moisture content of soil increases when
coverage rate and species composition increase. Specifically, the lowest
moisture content of soil in grass vegetation and the highest moisture
content of soil in secondary forest are 29.3% and 65.5% respectively.
In each vegetation cover type, the soil moisture content also
reduces over depth of soil profile, but this decrease is not significant.
4.2.9.2. The porosity
From 4.19 table shows the porosity of the soil in the vegetation
cover types increases gradually when coverage of the vegetation cover
increases. The lowest porosity of soil is grass vegetation (51.2%), that
increases in low shrub vegetation cover (54.6%) and high shrub
vegetation cover (58.5%) and the highest porosity is the secondary forest
soil (65.4%).
In each vegetation type, soil porosity is fluctuation under the rule
of decrease over depth of the soil profile.
4.2.9.3. Soil mechanical composition
The results of Table 4.19 shows that in the soil profile of the
vegetation type covers, contents of clay (<0.002 mm), limon (0.02 –
0.002 mm) and sand account from 33.4 to 46.1%, from 26.1 to 35.7%
and from 23.3 to 38.1% respectively. This demonstrates that all four
types of vegetation covers are a kind of light clay.
4.2.10.
The change on basic chemitry properties of soil in vegetation
cover types
4.2.10.1. Level pH
KCl
Soil in the studied vegetation cover types has relatively low value
of pH
KCl
ranging from 3.63 to 4.13. This demonstrates that soil in this
area is quite sour.
In the succession process of forest restoration, the pH
KCl
of
vegetation cover types also fluctuates with the general rule that the
pH
KCL
increases the level of vegetation cover increases. The pH
KCl
is the
lowest in the topsoil layer (0-10 cm) of grass vegetation cover (3.67),
then that of the low shrub vegetation (3.73) and high shrub vegetation
(3.75) and the highest pH
KCL
in the forest secondary is 4.13.
4.2.10.2. Total protein content (%)
Table 4.20 shows that the total protein content in the soil of
vegetation cover types are mostly concentrated in the topsoil (0-10 cm)
and tends to increase gradually through the stages of the succession
process. Soil in the grass vegetation cover contains the lowest protein
content (0.12%) and then that in the low and high shrub vegetation
covers has gradually increased 0.27% and 0.29% respectively, and soil in
the secondary forest is the highest protein content (0.42%). Total protein
14
content is fluctuated under the rule of gradual decrease with soil depth
and proportional to the level of coverage of vegetation cover.
Table 4.20: Some chemitry properties of soil in vegetation cover types
Indicators of analysis
Target
substances
(mg/100g)
Cation of
exchanges
(mg/100g)
Veg.
cover
types
Depth
(cm)
pH
KCl
Total
pro.
content
(%)
Humus
(%)
P
2
O
5
K
2
O
5
Ca
2+
Mg
2+
0-10 3.67 0.12 3.65 4.20
5.41 5.61 3.27
10-20 3.72 0.10 2.01 3.07
3.19 5.00 2.63
GV
20-30 3.63 0.09 1.80 2.97
2.97 4.87 2.62
0-10 3.73 0.27 3.80 4.72
8.74 5.72 3.57
10-20 3.76 0.27 2.67 4.30
3.84 3.86 3.50
LSV
20-30 3.70 0.20 2.02 3.08
3.65 4.45 3.09
0-10 3.75 0.29 4.13 6.50
9.86 11.24 4.40
10-20 3.91 0.20 3.12 5.20
5.18 9.14 3.49
HSV
20-30 4.06 0.15 2.78 5.01
4.63 10.02 2.67
0-10 4.13 0.42 4.86 8.58
11.20 11.36 4.42
10-20 4.11 0.30 4.02 6.50
6.02 9.04 4.36 SF
20-30 4.09 0.23 3.60 6.27
5.71 8.75 4.30
4.2.10.3. Total humus content (%)
Table 4.20 shows that the total humus content in the topsoil (0-10
cm) of vegetation cover types increase gradually through the stages of
the succession process of forest restoration. Humus contents in the grass
vegetation cover, the low shrub vegetation cover and high shrub
vegetation cover and secondary forest are 3.65%, 3.80%, 4.13% and
4.86% respectively. In the same vegetation cover type, the humus
content change under the rule of gradual decrease with depth of soil
profile.
4.2.10.4. Content of easily digestive phosphorus and potassium
* Content of easily digestive phosphorus
Table 4.20 shows that content of easily digestive phosphorus in
vegetation cover types studied is relatively high and tends to increase
gradually through the stages of the succession process. That in the
topsoil layer of the grass vegetation cover contains the most content of
easily digestive phosphorus (4.20mg/100g) and then that of the low and
high shrub vegetation covers has gradually increased 4.72mg/100g and
6.50mg/100g respectively, and that of the secondary forest is the highest
15
content (8.58mg/100g). Also, in each vegetation cover type, the content
of easily digestive phosphorus has also tended to decrease gradually with
soil depth.
* Content of easily digestive potassium
Table 4.20 shows that content of easily digestive accumulated
potassium increase through the stages of the succession process. At the
depth of the soil layer from 0 cm to 10 cm, soil in grass vegetation cover
is the lowest content of easily digestible potassium (5.41mg/100g) and
then that in low shrub and high shrub vegetation covers gradually
increased 8.74 mg/100g and 9.86 mg/100g respectively. The highest
content of easily digestible potassium in soil of the secondary forest
contains 11.20 mg/100g. In addition, content of easily digestive
potassium in the deep soil layer (10 – 30 cm) is not major changes, often
much lower than that in the topsoil layer (0 – 10 cm). This demonstrates
that easily digestive potassium depends greatly on the positive activities
of the microorganisms in the soil.
4.2.10.5. Content of Ca
2+
and Mg
2+
exchanges
* Content of Ca
2+
exchange
Content of Ca
2+
exchange of soil under vegetation cover types in
the studied area tends to reduce according to the depth of the soil layers
and increase when the level of vegetation cover increases. In soil of grass
vegetation cover, there is a low content of Ca
2+
exchange (5.61 mg/
100g) and the highest content of Ca
2+
exchange in soil of secondary
forests (11.36 mg/100g).
* Content of Mg
2+
exchange
The content of Mg
2+
exchange in soil of vegetation cover types has
similar rules to that of the content of Ca
2+
exchange. It is the lowest content
of Mg
2+
exchange in the grass vegetation (3.27 mg / 100g) and the highest
content of Mg
2+
exchange in the secondary forest (4.42 mg / 100g).
4.2.11. The change of soil microorganisms in the vegetation cover types
4.2.11.1. The change in the density of soil microorganisms in the
vegetation cover types
To see the change in density of the soil microorganism groups
under vegetation cover types, we conducted soil sampling twice at the
located plots and are arranged in each vegetation cover type (the first
time in April 2011 and at the 2
nd
time in April 2013). Results are
presented in Table 4.21 and Table 4.22.
16
Table 4.21: The change of quantity of groups of soil microorganisms in the vegetation cover types (2011 - 2013)
April 2011 April 2013
Ord
Veg. cover
types
Location
Bacteria
Antinobacteria
Microfungus
Bacteria
Antinobacteria
Microfungus
Hillside 1.6 x 10
5
1.4 x 10
3
1.7 x 10
3
2.7 x 10
7
2.7 x 10
5
1.2 x 10
4
1 GV
Hill base 2.2 x 10
6
2.9 x 10
3
2.3 x 10
4
3.8 x 10
7
3.1 x 10
5
2.2 x 10
5
Hillside 5.9 x 10
5
2.8 x 10
3
2.1 x 10
4
3.2 x 10
7
2.3 x 10
5
1.8 x 10
5
2 LSV
Hill base 6.3 x 10
6
3.7x 10
3
3.5 x 10
4
4.3 x 10
7
2.8 x 10
5
2.7 x 10
5
Hillside 4.2 x 10
6
4.1x 10
3
3.4 x 10
4
3.8 x 10
8
2.4 x 10
6
3.1 x 10
5
3 HSV
Hill base 5.4 x 10
7
5.2 x 10
4
4.7 x 10
4
5.1 x 10
8
3.4 x 10
6
4.2 x 10
5
Hillside 7.3 x 10
7
5.3 x 10
4
4.6 x 10
5
6.4 x 10
8
3.6 x 10
6
3.5 x 10
6
4 SF
Hill base 9 x 10
8
6.9 x 10
5
6.3 x 10
5
9.6 x 10
9
4.9 x 10
6
4.8 x 10
6
Table 4.22: The change of quantity of groups of soil microorganisms under function in the vegetation
cover types (2011 - 2013)
April 2011 April 2013
Ord
Veg. cover
types
Location
1 2 3 4 1 2 3 4
Hillside 1.7 x 10
3
1.6 x 10
4
1.4 x 10
3
1.8 x 10
3
1.6 x 10
4
1.4 x 10
5
1.8 x 10
4
1.7 x 10
4
1 GV
Hill base 2.1 x 10
3
1.9 x 10
5
2.0 x 10
3
2.2 x 10
4
1.9 x 10
4
3.2 x 10
6
3.1 x 10
4
3.5 x 10
5
Hillside 2.3 x 10
4
2.1 x 10
5
1.6 x 10
3
1.9 x 10
3
2.1 x 10
5
2.3 x 10
6
1.7 x 10
4
2.1 x 10
4
2 LSV
Hill base 3.3 x 10
4
2.4 x 10
5
2.3 x 10
3
2.5 x 10
4
2.8 x 10
5
4.6 x 10
7
3.4 x 10
4
3.9 x 10
5
Hillside 4.4 x 10
4
2.5 x 10
6
2.2 x 10
3
2.1 x 10
3
2.7 x 10
5
3.7 x 10
7
2.2 x 10
4
3.4 x 10
5
3 HSV
Hill base 5.6 x 10
4
2.7 x 10
6
2.8 x 10
3
3.1 x 10
4
3.6 x 10
5
5.8 x 10
8
4.7 x 10
4
4.1 x 10
5
Hillside 4.8 x 10
5
4.4 x 10
7
3.7 x 10
3
4.6 x 10
4
3.3 x 10
6
4.1 x 10
8
5.3 x 10
4
5.4 x 10
5
4 SF
Hill base 5.4 x 10
5
5.6 x 10
7
4.5 x 10
3
5.3 x 10
4
4.2 x 10
6
7.4 x 10
8
6.8 x 10
4
6.3 x 10
5
Note: 1. Microor. of phosphate resolution; 2. Microor. of cellulose resolution; 3. Microor.of nitrogen fixation; 4. Microor.
creating mucous membranes
17
From the results in Table 4.21, it can take the following
observations:
There are 3 important groups of microorganisms in soil under 4
vegetation cover types. They are soil bacteria, actinomycetes and fungi.
The density of the soil microbial groups increases with the recovery
process of vegetation covers. It is the lowest density of soil microorganisms in
the grass vegetation cover. The density of soil microorganisms in the low
and high shrub vegetation covers increases. It is the highest density of
soil microorganisms in the secondary forest. At the same time, the
density of soil microorganisms in hillsides are always lower than that in
foothills. This can be explained reason of the topsoil layer carrying
microorganisms washouted. On the other hand, moisture and organic
matter content in foothills are higher than those in hillsides. Thus, the
density of soil microorganisms in hillsides is higher than that in foothills.
There is a typical example on the group of aerobic bacteria. The densities
of bacteria on hillsides in the state of secondary forests and grass vegetation
cover are 7.3 x 10
7
CFU/g and 1.6 x 10
5
CFU/g, respectively; meanwhile,
those on foothills in secondary forests and grass vegetation cover are 9.0
x 10
8
CFU/g and 2.2 x 10
6
CFU/g respectively.
Due to the characteristics of forest soil where is a high cellulose
source (tree branches and dry leaves falling off). In addition to the group
of bacteria accounting for the highest percentage, that of microorganisms
breakdown of cellulose also accounts for a high percentage. They range
from 1.6 x 10
4
to 5.6 x 10
7
CFU/g (April 2011) and from 1.4 x 10
5
to 7.4
x 10
8
CFU/g (April 2013), depending on vegetation cover types and
terrain location of vegetation cover types (Table 4.22).
After 2 years of research, density of soil microorganisms in
locations of hillside and foothills of vegetation cover types. We see that
there is an increase in the density of the soil microorganism groups. The
increase is in accordance with the laws of nature. This is a typical
example. The density of microorganism in the hillsides and foothills
(April 2011) ranged from 1.6x10
5
to 9x10
8
, depending on the sampling
location. However, after 2 years (April 2013), the density of
microorganism has increased from 2.7x10
7
to 9.6 x10
9
, the density of
other microorganism groups also increases similarly.
4.2.11.2. Composition of groups of soil microorgarnism in forest soil in
Vi Xuyen district, Ha Giang province.
The results of analysis of soil samples in vegetation cover types in
Table 4.23 shows that the composition of soil microorganism groups
includes namely:
18
+ The group of bacteria includes 5 varieties such as Pseudomonas,
Agrobacterium, Bacillus, Azotobacter, Nitrobacter.
+ The group of antinobacteria has only Streptomyces.
+ The group of microfungus includes 4 varieties of filamentous
fungus such as Aspergillus, Mucor, Penicillium, Rhizopus and two
varieties of yeast such as Candida, Lipomyces.
Table 4.23: Composition of groups of soil microorgarnism in
vegetation cover types
Vegetation cover types Group of
Microbacteria
Composition
of varieties
GV LSV HSV SF
Pseudomonas ++ ++ +++ ++++
Agrobacterium
- + + ++
Bacillus ++ +++ ++++ ++++
Azotobacter ++ ++ +++ +++
Bacteria
Nitrobacter - - ++ ++++
Antinobacteria
Streptomyces + + ++ +++
Aspergillus +++ +++ ++++ ++++
Mucor - + ++ +++
Penicillium +++ +++ ++++ ++++
Rhizopus - - ++ ++
Candida + ++ ++ +++
Microfungus
Lipomyces - ++ ++ ++
Aspergillus +++ +++ ++++ ++++
Penicillium +++ +++ ++++ ++++
Pseudomonas ++ ++ +++ ++++
Agrobacterium
- + + ++
Microorganisms of
phosphate resolution
Bacillus ++ +++ ++++ ++++
Bacillus ++ +++ ++++ ++++
Aspergillus +++ +++ ++++ ++++
Mucor - + ++ +++
Microorganisms of
cellulose resolution
Penicillium +++ +++ ++++ ++++
Berjerinckia + + ++ +++
Microor.of nitrogen
fixation
Azotobacter ++ ++ +++ +++
Microor. creating
mucous membranes
Lipomyces - ++ ++ ++
Notes: ++++: Very plenty; +++: plenty; ++: medium; +: few; -: None
19
4.2.12
. Changes on components, quantity and distribution of soil animals
in the vegetation cover types.
4.2.12.1. Changes on components, quantity and distribution of species
earthworms
Table 4.24: Components of species and abundance of earthworms
in the vegetation cover types
GV LSV HSV SF
Ord
Species and subspecies
n% p% n% p% n% p% n% p%
Fam.GLOSSOSCOLECIDAE
(Michaelsen, 1900)
1
Pontoscolex corethrurus (Miller,
1856)
60.88
50.37
30.02
23.44
12.50
13.20
Fam. MEGASCOLECIDAE
(part Rosa, 1891)
2 Pheretima adexilis Thai, 1984 14.29
3.17
3 Ph. digna Chen, 1946 9.52
3.17
8.69
14.41
15.38
10.52
4 Ph. exigua exigua Gates, 1932
8.36
4.88
5 Ph. exigua austrina Gates, 1932
4.36
1.12
6.25
1.94
6 Ph. exilisaria exlisaria Thai, 1984
19.52
2.53
25.47
5.97
7 Ph. hiepcatana Do et Tran, 1994
3.22
1.21
8 Ph. infantiloides Chen, 1938 14.29
1.58
9 Ph. kinfunnontis Chen, 1946
3.13
1.94
10 Ph. lacertina Chen, 1946
3.13
4.50
11 Ph. leucocirca Chen, 1933
5.64
20.38
6.25
17.25
12
Ph. manicata manicata
Chen, 1946 4.76
47.53
4.35
1.76
9.38
7.76
13 Ph. Neoexilis Thai et Samphon, 1988 4.76
0.57
14 Ph. planata Gates, 1926 4.76
19.0
15 Ph. robusta Perrier, 1872
6.18
5.49
3.13
20.54
16 Ph. socsonensis Thai, 1984
3.13
0.6
17 Ph. vuongmontis Thai, 1984
3.34
7.12
18 Ph. wui Chen, 1935 4.76
2.35
6.25
11.97
Pheretima non 42.86
22.62
4.34
24.37
30.26
25.44
46.88
20.03
Total quantity (earthworms)
84
84
118
128
Total biomass (g)
12.62
12.62
48.67
61.9
Density in average (con/m
2
)
16.80
16.80
23.60
25.60
Biomass in average (g/m
2
)
2.52
2.52
9.73
12.38
Note: n%: abundance on quantity; p%: Abundance on biomass
- In terms of species composition, there is 18 species of earthworms
recognized. Of which, there are the most abundant earthworm species in
secondary forests. There are 9, 8, 5 and 7 earthworm species in secondary
forests, high shrub vegetation, low shrub vegetation and grass vegetation,
respectively.
20
- In terms of quantity, The number and biomass in average in 1m
2
of soil in secondary forest, high shrub vegetation, low shrub vegetation
and grass vegetation are 25.60 earthworms per m
2
and 12.38g/m
2
; 23.60
earthworms per m
2
and 9.73g/m
2
, 18.40 earthworms per m
2
and 4.92
g/m
2
, 16.80 earthworms per m
2
and 2.52g/m
2
respectively.
Thus, we can see that the humus content in the topsoil layer (0-10
cm) affects the distribution of earthworms. Secondary forests have high
coverage, the combination of large species composition. An amount of
deciduous branches and leaves falling back to soil is higher. Therefore,
there is the highest humus content (4.86%), from which, it is the most
species composition and earthworm quantity.
4.2.12.2. Changes on components, quantity of other Mesofauna groups
under vegetation cover types
Table 4.25: Abundance of other Mesofauna groups
under vegetation cover types
GV LSV HSV SF
Ord
Animal
group
n% p% n% p% n% p% n% p%
1 Araneae 19.98
46.27
22.87
47.33
23.81
50.67
35.02
36.58
2 Blattodae 4.76 16.22
3 Carabiidae 5.00 54.86
4 Formicidae 39.95
2.99 30.56
3.02 19.05
4.40
5 Gryllidae 20.03
2.99 10.95
3.44 5.00 0.15
6 Homoptera 24.93
1.76
7 Isoptera 23.81
7.09
8 Isopoda 13.39
10.73
14.29
11.49
20.01
5.34
9 Polydesmida
4.76 5.06
10 Hirudinidae 9.52 5.07
11 Scarabaeidae 20.04
47.76
22.23
35.48
12 Staphilinidae 10.04
1.32
Total quan. (meso.)
20 34 84 80
Total biomass (g)
0.54
1.02
2.37
10.94
Density in average
(mesofauna/m
2
)
10.00
17.00
28.00
40.00
Biomass in aver.
(g/m
2
)
0.27
0.51
0.79
5.47
Note: n%: abundance on quantity; p%: Abundance on biomass
Table 4.25 shows that:
- In term of species component, it found 12 other Mesofauna groups
in the study area. The highest number of Mesofauna group in high shrub
21
vegetation cover is 7. Then, number of Mesofauna group in secondary
forest and low shrub vegetation covers are 6 and 5 respectively. The
highest number of Mesofauna group in grass vegetation cover is 4.
- In term of quantity, the quantity and biomass in 1m
2
of soil in
grass vegetation cover, low shrub vegetation cover, high shrub cover and
secondary forest increases gradually from 10 mesofauna per m
2
and
0.27g per m
2
, 17 mesofauna per m
2
and 0.51g per m
2
, 28 mesofauna per
m
2
and 0.79g per m
2
and is 40 mesofauna per m
2
and 5.47g per m
2
.
The group of Araneae spiders in vegetation cover types studied are
commonly groups encountered in all 4 types of vegetation.
Comments: like earthworms, the abundance of other Mesofauna groups
are also marked variations in each vegetation type. Mesofauna groups in
secondary forests are the most abundant either the average quantity of
mesofauna per m
2
or average biomass per m
2
(g) and the lowest in the
grass vegetation.
4.3. Evaluation of ability and proposal of some solutions to recover
natural forests in Vi Xuyen district, Ha Giang province
4.3.1.
Assessment of ability and proposal of some solutions to recover
natural forests in Vi Xuyen district, Ha Giang province
- The forestry industry of Vi Xuyen district always receives the
attention and close guidance of leaders of Ha Giang province.
- In Vi Xuyen district, there are many programs and projects supported
by the central government to protect and develop forest resources.
- Natural conditions are suitable for many kinds of tropical,
subtropical and temperate plants.
- Density of regenerated trees ranges from 3,054 trees per ha to
5612 trees per ha. The quality of regenerated trees is assurance of
requirements for forest restoration. The rate of good regenerated trees
gains from 63.2% to 70.3%. The rate of regenerated trees from seeds
reaches from 36.6% to 65.3%.
- The study area is located close to Tay Con Linh Natural Reserve,
which is an important sowing source.
- Ethnic minority people in Vi Xuyen district are hardworking
people and have practices and experiences of agricultural and forestry
production on sloping land.
From the above foundations, it may allow to assess that ability of
natural forest to recover in Vi Xuyen district is to promise.
4.3.2.
Proposing some solutions to recover natural forests in Vi Xuyen
district, Ha Giang province
4.3.2.1. The foundations of the forest restoration process
* Legal foundations
+ Goveronment’s documents
+ Documents of Ha Giang province
22
* Factual foundations
- Policies of assignment of land and forest and support the farmers
participating in protecting and taking care of the forest have been carried.
- There is the seed supply from the neighboring forests (Tay Con
Linh Nature Reserve).
- Forest soil fallowed after cultivating milpa or forest land
exhausted available the topsoil thickness of over 30 cm.
- The density of regenerated trees is over 500 trees per ha. The
good quality of regenerated trees reaches from 63.2% to 70.3%.
4.3.2.2. Proposing mainly technical measures applying for
recovering natural forests in Vi Xuyen district, Ha Giang province
* Selecting and determining forest zoning subjects
Based on the results of forest classification in Vi Xuyen district,
Ha Giang province, we select the subject to apply the afforestation
zoning of forest restoration, namely
- Sub-formation of broadleaf trees with state of fresh shrub
vegetation cover after exploited exhaustedly cultivating milpa. It belongs
to closed forest formation usually green in rainy in low topography and
low mountains.
- The open forest formation, trees are usually evergreen and
broadleaves in lowland and low mountains. It is deciduous broad-leaved
in lowland and low mountains.
- Sub-formation of shrub trees has scattered timber trees belonging
to shrub vegetation and usually green on dry soil.
- Some drought-tolerant grass formation belong to the group of the high
and medium high rice and 10-40% of it area is covered by timber trees.
* Criteria of afforestation zoning to recover natural forest
- Regenerated trees have to reach the goal with 300 trees per ha
and 50 cm in high.
- Foots of maternal trees must be capable of regeneration of shoots,
there are at least 150 roots of tree per ha and distributed relatively uniform.
- There are maternal trees sowing in place over 25 trees per ha,
distributed relatively uniform or to have nearby sources sowing.
* Some mainly technical measures applied to forest enough regenerated
trees (≥ 500 target trees per ha)
- Cutting vines, shrubs, fresh vegetation.
- The places with high-density of regenerated trees is conducted to
prune and intercrop in less trees.
- Modifying foots of sprouts: it depends on each tree species to
spare foots of sprouts with appropriate height.
- Trimming sprouts: Bad sprouts trimmed and let 2-3 buds of good
develop.
23
CONCLUSIONS AND RECOMMENDATIONS
Conclusion
1. According to UNESCO classification (1973), the vegetation covers in
Vi Xuyen district, Ha Giang province is divided into 4 classes of
formation: closed forest formation, open forest formation, shrub
formation and grass formation.
2. Flora of Vi Xuyen district has a relatively abundant taxa component. It
includes 557 species belonging to 393 genera, 114 families of five
branches of higher vascular plants. Of which, there are 33 rare plant
species in the 2007 Vietnam Red Data Book and 7 species recorded
in Decree of Government No. 32.
3. The logging activities, exploitation of non-timber forest products
(NTFPs) and wildfires are major reasons that forest vegetation in Vi
Xuyen district has been reduced considerably in terms of both area
and quality
4. There are dramatically changes the key elements in the course of
succession from the grass vegetation to the low shrub vegetation, high
shrub vegetation and secondary forests:
- Changes in plant species composition (the grass vegetation has 209
species, 166 genera and 65 families; the low shrub vegetation has
285 species, 219 genera and 79 families, the high shrub vegetation
has 375 species, 258 genera and 98 families; the secondary forest
has 343 species, 245 genera and 88 families).
- Average density of regenerated trees increases from 3,054 to 5,612
trees per ha. Percentage of regenerated trees with good qualities is
ranged from 63.2% to 70.3%. The proportion of regenerated trees
originating from seeds increases rapidly in the high shrub
vegetation and the secondary forest (58.8% - 65.3%).
- The restoration period, the proportion of large-diameter trees increases
and it distributes diameter with the peak shifting to the right side.
- Average growth in height and diameter of species of timber trees in
secondary forests is from 0.4 - 0.6 m per year and 0.3 – 0.6 cm per year.
- The density and composition of the groups of soil microorganism
mainly (bacteria, antinomycetes and fungi), as well as microorganisms
with resolution of compounds of insoluble phosphates, microorganisms of
cellulose resolution, nitrogen-fixing bacteria, microorganism
creating mucus membranches are also to increase in proportional
to the rehabilitation period.