Cross shareholding in the japanese banking sector
Bạn đang xem bản rút gọn của tài liệu. Xem và tải ngay bản đầy đủ của tài liệu tại đây (272.91 KB, 26 trang )
CHAPTER 3
Cross-shareholding in the
Japanese banking sector
∗
3.1 Introduction
There is ample evidence that nowadays firms often acquire shares in their rivals,
and mostly these shareholdings do not give control power. For example, Hansen
and Lott (1996, Table 1) give evidence for substantial cross-ownership relations in
the American computer and automobile industries for 1994-1995, and state that
“slightly over 77 percent of Intel and 71 percent of Compaq are owned by institu-
tions that have holdings in at least one of the other five computer industry com-
panies listed [Apple, Compaq, IBM, Intel, Microsoft, Motorola]. Fully 56 percent
of Chrysler is held by institutions that simultaneously hold shares in Ford and/or
General Motors” (p. 49). In 2002, the leader of the wireless communications busi-
nesses in Korea – SK Telekom – acquired 11.3% of Korea Telecom, the leader in
the wireline communications business, which in its turn already owned 9.3% of eq-
uity of the first company (see Choi et al., 2003, p.498). Firms’ acquisitions of stocks
largely cross the national borders as well. For instance, in 2001, General Motors in-
creased its equity holding in Suzuki Motor from 10.0% to 20.0%, and acquired also
a 21.1% stake in Fuji Heavy Industries.
1
Since shareholding interlocks of firms is a
widespread phenomenon,
2
it is essential to analyze the implication of the presence
∗
Section 3.2 is partly based on a paper published in the Journal of Economic Studies, vol. 36, no. 3, pp.
296-306, 2009a, while the rest of this chapter is based on joint work with Stanislav Stakhovych.
1
See Industrial Groupings in Japan. The Changing Face of Keiretsu, 14th Edition, Brown & Company Ltd.,
Tokyo, 2001.
2
See Gilo (2000) for more cases of equity acquisitions in various industries.
48 Chapter 3
of ownership links on the behavior of firms.
Cross-shareholding is, in particular, an important characteristic of Japanese,
German and Swedish business groups (see e.g., Kester, 1992). However, due to
antitrust concerns most cross ownership is silent (or partial) by its nature. Financial
interests are silent when firms do not control the policies (e.g., outputs, prices) of
their competitors.
3
That is, firms take the choices of these competitors as given,
although in the presence of cross ownership decisions of one firm affect also the
profits of its rivals. It has been shown that partial cross ownership (PCO) of firms,
when compared to the case without PCO, leads to higher prices,
4
lower industry
outputs, and thus lower welfare (see e.g., Reynolds and Snapp, 1986; Flath, 1992a;
Reitman, 1994; Dietzenbacher et al., 2000). Nonetheless, Farrell and Shapiro (1990)
show that welfare may still rise even if prices increase, which occurs when a small
firm acquires shares in a rival in which it previously had no financial interest.
Given the fact that passive investments in rivals were largely neglected by an-
titrust agencies (see e.g., Gilo, 2000), much attention in the literature was given to
the study on explicit links between PCO and tacit collusion. Reitman (1994) shows
that for any number of firms an individually rational PCO equilibrium exists if the
market is more rivalrous than Cournot oligopoly and is close to price competition.
Malueg (1992) concludes that passive investments have an ambiguous effect on the
likelihood of collusion. In a repeated Cournot game, he shows that the effect of an
increase in cross ownership on tacit collusion depends critically on the form of the
market demand. However, Gilo et al. (2006) find that in a Bertrand supergame an
increase in PCO never hinders tacit collusion and surely facilitates it under certain
conditions. They show that an increase of firm r’s stake in firm s strictly facilitates
collusion if (i) firm s is not an industry maverick (a firm with the strongest incentive
to deviate from a collusive agreement), and (ii) each industry maverick has a direct
and/or an indirect stake in firm r (firm i has an indirect stake in firm r if it has a
share in a firm that has a stake in firm r, or has a stake in a firm that has a stake in
a firm that holds a stake in firm r, and so on).
5
The results of empirical research on the effect of PCO on market structure mostly
support the collusion hypothesis, which states that a complex web of PCO is an
3
The term “silent financial interests” was introduced by Bresnahan and Salop (1986). Equivalently,
such equity interests in the literature are also termed passive investments, partial ownership arrange-
ments, and partial cross ownership links. We will also use all these terms interchangeably throughout
this chapter.
4
Interestingly, Weinstein and Yafeh (1995) find that keiretsu firms had price-cost margins lower by as
much as 2.5 percentage points than those of non-keiretsu firms.
5
An extension of Gilo et al. (2006) to the case where firms have asymmetric costs will be presented in
Chapter 4.
Cross-shareholding in the Japanese banking sector 49
important factor for the existence of collusive prices. The focus of such studies are
specific industries, such as the US mobile telephone industry (Parker and R
¨
oller,
1997), the Dutch financial sector (Dietzenbacher et al., 2000), and the Norwegian-
Swedish electricity market (Amundsen and Bergman, 2002). Alley (1997) finds that
tacit collusion does occur in both the Japanese and the US domestic automobile
industries, but its degree is lower in Japan.
In this chapter we take into full account both direct and indirect interests of firms
in each other due to PCO, which is ignored, to the best of our knowledge, in all em-
pirical estimations of the level of tacit collusion.
6
As mentioned above, for example,
if firm i owns a share in firm k that has a share in j then firm i is said to have an
indirect share in firm j (via firm k). In general, the number of intermediate firms
in the indirect links can be infinity when there are cycles present in the ownership
paths (for instance, when firm i holds shares in firm j and, vice versa, j has a stake
in i). PCO is incorporated in the analysis of Alley (1997), but he considers only
direct shareholdings. It has been shown that indirect interests might be significant
in size, thus should not be neglected in the analysis of industries (economies) with
the presence of PCO (see e.g., Flath, 1992b; Dietzenbacher and Temurshoev, 2008).
We first discuss different profit formulations of firms with cross-shareholdings
that have been used in the literature, where the differences are due to the distinct
ways of considering direct and/or indirect PCO links. Then using the conjectural
variation model we find that (unlike in the case without PCO) the link between
firms’ price-cost margins and the degree of collusion is nonlinear in the presence of
PCO. Hence, if shareholding links among firms are present, ignoring PCO would
most likely give biased parameters’ estimates due to model misspecification. It is
shown that given market shares, number of firms, price elasticity of demand, and
collusion degree, firms with shareholdings exert strictly higher market power than
those without PCO, provided that the market conduct is consistent with Cournot
or a more collusive environment. This is because shareholding interlocks among
firms cause commonality of interests of firms, implying greater monopoly power
for firms with PCO holdings.
The model is applied to the Japanese banking sector for the fiscal year 2003.
The results of our estimations show that Japanese banks are competing in a mod-
est collusive environment. However, disregarding banks’ PCO gives biased result,
6
Dietzenbacher et al. (2000) fully consider PCO links in a Cournot and a Bertrand setting, and find that
such links reduce Dutch banks’ price-cost margins, hence reduce competition. We, however, focus di-
rectly on the indicator of market performance that ranges from perfect competition to monopoly (perfect
cartel).
50 Chapter 3
indicating a Cournot oligopoly. It is further shown that banks with passive invest-
ments in rivals exert a strictly larger market power than those without any PCO,
which confirms the hypothesis that acquiring shares in rivals is one of the crucial
means for a firm to enhance its market power. In particular, city banks with many
shareholdings are found to exercise a much higher market power than regional
banks with none or few stockholdings.
The model presented here belongs to the conjectural variations (CV) literature.
CV models are often used in empirical research in order to infer the degree of mar-
ket power from real data (see e.g., Brander and Zhang, 1990; Haskel and Martin,
1994; Richards et al., 2001; Fischer and Kamerschen, 2003; Brissimis et al., 2008).
It is well known that these models are subject to some criticism from a theoretical
point of view because they describe the dynamics of firms’ interaction using a static
setting (see e.g., Tirole, 1988, pp. 244-45).
7
However, Cabral (1995) shows that CV
models can be interpreted as a reduced form of the equilibrium in a quantity-setting
supergame with linear demand and marginal cost functions, justifying their use in
estimating the competition level among oligopolists. In the same fashion, for his
infinite horizon adjustment cost model, Dockner (1992) shows that any steady state
closed-loop (subgame-perfect) equilibrium coincides with the CV equilibrium. In
addition, Pfaffermayr (1999) proves that CV models represent the joint profit max-
imizing reduced form of a price-setting supergame with product differentiation,
which “. . . provides a comprehensive theoretical foundation of the widely criticized
static CV models” (p. 323).
The rest of this chapter is organized as follows. Section 3.2 discusses different
profit specifications of firms in the presence of PCO used in the literature. Sec-
tion 3.3 describes the CV model with cross-shareholdings and examines the effect
of PCO linkages on firms’ market power. Section 3.4 focuses on the empirical esti-
mation of the degree of tacit collusion in the Japanese commercial banking sector
for 2003, and diagnoses market power of the banks. Section 3.5 concludes. All
proofs are relegated to the Appendix at the end of the chapter.
7
Some authors therefore believe that CV parameters have nothing to do with real conjectures or expec-
tations of firms. To avoid this confusion Krouse (1998, p. 688), for example, refers to them as “equilib-
rium solution parameters”.
Cross-shareholding in the Japanese banking sector 51
3.2 Profits of horizontally interrelated firms
In this section we briefly present profit formulations of firms in the presence of
partial cross ownership (PCO) that have been used in the literature. The differences
in these profit specifications are the result of the different ways of taking account
of a complex web of interfirm ownership links. Consider an industry with n firms
that are interdependent through PCO ties. Reynolds and Snapp (1982) was one of
the first studies that brought attention to the analysis of firms’ PCO holdings and
formulated the profit of firm i as follows
π
i
= z
i
+
∑
k=i
w
ik
z
k
, (3.1)
where π
i
and z
i
denote, respectively, the profits and the operating earnings of firm
i, and w
ik
(i, k = 1, . . . , n ) represents the share in firm k that is held by firm i.
8
That
is, equation (3.1) states that firm i’s profits consists of its own operating earnings
(profits from ordinary production) plus its direct shareholdings in operating earn-
ings of all other firms. This formulation is also used in Bresnahan and Salop (1986),
who study a competitive joint venture, in which parent firms own non-controlling
ownership rights.
Reynolds and Snapp (1986) consider the case of joint ventures, whose profits are
divided according to each partner’s share of equity, and they define profits of firm
i as
9
π
i
=
1 −
∑
k=i
w
ki
z
i
+
∑
k=i
w
ik
z
k
, (3.2)
which defers from (3.1) in that firm i also considers competitors’ financial interests
in its operating earnings. This specification of the firms’ objective was used in Al-
ley (1997) in analyzing the effect of non-controlling (partial) shareholdings on the
degree of competition in the US and Japanese automobile industries.
The above specifications totally disregard indirect financial interests, when, for
example, firm i has an indirect stake in firm j via intermediate firms. In many
8
First and second subscripts in w
ik
denote, respectively, the owner and the owned firm. Throughout
this chapter it is assumed that a firm cannot own equity interest in itself, i.e., w
ii
= 0 for all i. However,
one can also allow for w
ii
> 0, which would reflect, for example, the share repurchases by firms due
to the tax advantage of capital gains. Note that while in Chapter 2 the cross-shareholding matrix was
denoted by the matrix S, in this chapter its transpose is denoted by W.
9
For other profit specifications depending on the kind of behavior imputed on the joint ventures see
e.g., Bresnahan and Salop (1986) and Martin (2002, Chapter 12.10).
52 Chapter 3
cases indirect shareholdings are significant in size and thus call for a proper con-
sideration. Hence, equations (3.1) and (3.2) are not adequate when an industry is
characterized by extensive shareholding interlocks. These shareholding links are
fully taken into account in Flath (1991), who defines firm i’s profit as the sum of its
operating earnings and the revenue from shareholding in rivals’ profits:
π
i
= z
i
+
∑
k=i
w
ik
π
k
. (3.3)
Equivalently, in matrix form, (3.3) can be rewritten as π = z + Wπ, where W is the
n-square PCO matrix with its typical element w
ij
, and π and z are, respectively, the
column vectors of profits and operating earnings. Solving the last equation with
respect to profits gives
π = (I − W)
−1
z, (3.4)
where I is the n-square identity matrix.
Assuming that each firm has external shareholders (i.e., private owners and
firms outside the industry) implies that the column sum of the matrix W is smaller
than one, which guarantees non-singularity of the matrix (I − W) (see e.g., Solow,
1952).
10
Define L ≡ (I − W)
−1
that, similar to the Leontief inverse in input-output
economics, can be written as the matrix power series expansion L = I + W + W
2
+
. . . (see e.g., Miller and Blair, 2009). The last expression together with (3.4) allow
us to separate direct and indirect effects of PCO. Namely, profits of firm i consist
of three components (Dietzenbacher et al., 2000, p. 1226). First, its own operating
earnings reflected by the i-th element of the vector z. Second, firm i’s direct share-
holdings in rivals, reflected by the i-th element of the vector Wz. Finally, the third
term gives the indirect equity returns of firm i in other firms and is equal to the i-th
element of the vector (W
2
+ W
3
+ . . .)z. So even if w
ij
= 0, the entry (i, j) of the
matrix W
3
is positive if firm i partially owns firm k that has a share in firm h that in
its turn holds a stake in firm j.
The profit specification in (3.4) is widely used in the literature (see e.g., Flath,
10
Although, the existence of external shareholders perfectly corresponds with the real life observations,
it is - mathematically speaking - not necessary that all column sums of W are smaller than one. For the
existence of (I − W)
−1
it suffices that no column sum of W is larger than one and, at least, one column
sum is strictly less than one, provided that W is an indecomposable matrix. (A square matrix A is called
decomposable if there exists a permutation matrix P such that P
−1
AP =
A
11
A
12
O A
22
, where A
11
and
A
22
are square submatrices, and O is a null matrix of appropriate dimension. If this is impossible, A is
called indecomposable.) Hence, (if W is an indecomposable matrix) for all but one firm it may even be the
case that no external shareholders exist.
Cross-shareholding in the Japanese banking sector 53
1992a, 1992b; Dietzenbacher et al., 2000; Gilo et al., 2006; Dorofeenko et al., 2008).
These profits “overestimate” industry-wide operating earnings. To see this, let ı be
the summation vector of ones. Then ı
π = ı
(I − W)
−1
z = ı
(I + W + W
2
+ . . .)z >
ı
z in the presence of PCO. However, this “overestimation” does not cause any
problem since these profits indicate the value of the firms, and should increase when
firms become interlinked. Say, in a two firms setting, PCO creates a multiplier ef-
fect in the sense that firm A gets a share in firm B’s profit, which includes firm B’s
share in firm A’s profit, which includes firm A’s share in firm B’s profit, and so
on. However, what should concern us is whether there is a problem of overesti-
mation of profits accruing to “real” (i.e., external) shareholders. The last is equal
to ı
(I − W)π = ı
(I − W)(I − W)
−1
z = ı
z, hence although the aggregate profits
“. . . overstate the firms’ cash flows . . . the aggregate payoffs of ‘real’ equityholders
are not overstated and do sum up to [industry operating earnings]” (Gilo et al.,
2006, p. 86). This approach is very similar to the input-output technique, where
multiplication of, say, the direct employment coefficients vector by the Leontief in-
verse gives total (direct and indirect) labor requirements per unit of final demand
(see e.g., Miller and Blair, 2009). Here, similarly, multiplication of external share-
holders’ direct shares in firms, ı
(I − W), by the “Leontief inverse” of the form
(I − W)
−1
results in the total (direct and indirect) equity interests of owners in firms
per unit of operating earnings, or, equivalently, in Gilo et al. (2006) terminology, in
the total effective stake of the “real” equityholders in firms’ profits.
The issue of profits overestimation in Flath’s approach is considered in Merlone
(2007). In terms of our notations, his proposed new formulation of net profits is
π
net
= (I −
ı
W)(I − W)
−1
z, where
ı
W is the diagonal matrix with the column
sums of W on its main diagonal and zero elsewhere. The last, unlike the profits in
(3.4), sum up to the overall operating earnings, i.e., ı
π
net
= ı
z since ı
(I −
ı
W) =
ı
(I − W). However, as we just showed above, π
net
is nothing else than the profits
accruing to “real” equityholders of firms.
11
A few studies focused only on the real cash flows due to firms’ PCO links, hence
effectively neglected the notion of a firm value considered in (3.4). Futatsugi (1978,
1986, 1987) writes firm i’s profits as
11
We should note that Merlone’s (2007) view that his profit specification results in different cartelizing
effects of shareholding interlocks than those based on equation (3.4) is entirely wrong. In fact, the Lerner
indices for homogeneous and product-differentiated oligopolies proposed by Merlone (2007) are noth-
ing else than the corresponding indicators in Merlone (2001). This is because Merlone’s profit specifica-
tion is a netted version of firms’ objective in (3.4). Thus both profit formulations have exactly identical
optimality conditions (from which Lerner indices are derived), since in the maximization process the
structure of PCO is taken as given.
54 Chapter 3
π
i
= z
i
+
∑
k=i
w
ik
r
k
π
k
, (3.5)
where r
k
∈ (0, 1) is the payout ratio (dividend propensity) of firm k. Note that if
r
k
= 1 for all k, then (3.5) boils down to (3.3). Hence, unlike (3.3), the last equation
considers only dividend returns of firms due to PCO. Its netted version, where
dividend outflows due to PCO are also taken into account, is given in Temurshoev
(2009a) as follows
π
net
i
= (1 − r
i
)
z
i
+
∑
k=i
w
ik
r
k
π
net
k
1 − r
k
, (3.6)
where π
net
i
denotes firm i’s profits after dividend payments, hence π
net
i
/(1 − r
i
) =
π
i
is the gross profit including dividend payments.
12
Equations (3.5) and (3.6)
in matrix form can be rewritten, respectively, as π = (I − W
ˆ
r)
−1
z and π
net
=
(I −
ˆ
r)(I − W
ˆ
r)
−1
z, where
ˆ
r is the diagonal matrix with payout ratios on its main
diagonal and zero otherwise. Since in the analysis
ˆ
r and W are given, the first-order
conditions for profit maximization are exactly the same for (3.5) and (3.6).
However, equations (3.5) and (3.6) are not suitable for the economic analysis of
cross-shareholdings. The main focus in economic analysis is the value of the firm,
and not its total cash flows due to PCO. For instance, if no firm announces dividend
payments (i.e., r
i
= 0 for all i), then both (3.5) and (3.6) reduce to π
i
= π
net
i
= z
i
.
Although from a pure accounting view this is the correct amount of (current) earn-
ings, it is a wrong representation of the PCO presence as far as economic analysis
is concerned. This is because – in that case – (3.5) and (3.6) do not reflect the PCO
links which give firms shares in the profits of rival firms (which in this case are
held as retained earnings). Essentially, an investor’s income from equity consists of
dividends and retained earnings. The difference between the two is only the timing
at which they are received: dividends are received whenever the firm distributes
them, whereas retained earnings are realized either when the equityholder sells his
shares or when the firm is liquidated. Equations (3.5) and (3.6) represent a one
period model, where there should not be any difference between equity sales and
firm liquidation, because the firm is effectively liquidated at the end of the period
(after its profits are realized), and its profits are fully distributed. Therefore, divi-
12
To see this, let r
i
= d
i
/π
i
, where d
i
denotes the dividend obligations of firm i. By definition π
net
i
=
π
i
− d
i
, which implies π
net
i
/(1 − r
i
) = π
i
.
Cross-shareholding in the Japanese banking sector 55
dends do not matter in a static one period model.
13
Hence, the only correct profit
specification for economic analysis of PCO is Flath’s formulation given in (3.3) or
(3.4).
3.3 Theoretical framework
In order to diagnose market power of firms and analyze market performance in the
presence of cross ownership links, we modify the well-known conjectural variation
model of Clarke and Davies (1982) by taking into account both direct and indirect
PCO linkages among firms. Assume there are n firms in an industry that are inter-
dependent through PCO ties. The profit of firm i consists of its operating earnings
plus the revenue from shareholding in other firms and is given in equation (3.3) in
the previous section.
Consider a homogeneous product industry. Firm i’s total cost c
i
(x
i
) is a function
of its own output level x
i
. Further, the inverse demand function is p(X), where
X =
∑
n
i=1
x
i
. Let l
ij
be the generic element of the matrix L = (I − W )
−1
. Since the
operating earnings of firm i is z
i
= p(X)x
i
− c
i
(x
i
), using (3.4) firm i’s profit can be
written as
π
i
=
n
∑
j=1
l
ij
p(X)x
j
− c
j
(x
j
)
.
We consider only passive financial interests of firms, thus in maximizing profits
firms take the choices of their rivals as given. Following Clarke and Davies (1982)
we further assume that in choosing its output, firm i forms a conjectural variation
about the output response of all other firms to a unit change in its own output level.
Denote the constant conjectural elasticity parameter of firm i by α, which is defined
as
∂x
j
∂x
i
= α
x
j
x
i
for all j = i. (3.7)
The conjectural elasticity α is interpreted simply as the percentage change in firm
13
In fact, Miller and Modigliani (1961) show that for a given investment policy, a firm’s dividend policy
is irrelevant to its current market valuation. In particular, they state: “[L]ike many other propositions
in economics, the irrelevance of dividend policy, given investment policy, is ‘obvious, once you think
of it.’ It is, after all, merely one more instance of the general principle that there are no ‘financial il-
lusions’ in a rational and perfect economic environment. Values there are determined solely by ‘real’
considerations—in this case the earning power of the firm’s assets and its investment policy—and not
by how the fruits of the earning power are ‘packaged’ for distribution” (p. 414).
56 Chapter 3
j’s output that firm i expects in response to a one percent change in its own output.
Note that this parameter is assumed to be the same for all firms and measures the
degree of (tacit) collusion inherent in an industry. Positive values of α indicate the
presence of collusion, and its degree is larger if α is larger. This is more obvious
if we rewrite (3.7) as ∂x
j
/x
j
= α(∂x
i
/x
i
). If 0 < α < 1, lower values of α imply
that firm i’s rivals will react with a smaller (percentage) change to the change in
output i, so that firm i believes that there is some scope for improving its market
share.
14
Let c
i
be the marginal cost of firm i, then the first-order condition (FOC)
∂π
i
/∂x
i
= 0 is
∑
j
l
ij
(p − c
j
)∂x
j
/∂x
i
+ x
j
∑
k
(dp/dX)(∂x
k
/∂x
i
)
= 0.
Define firm i’s price-cost margin by m
i
≡ (p − c
i
)/p, its market share by s
i
≡
x
i
/X, and the price elasticity of demand by ε ≡ −(p/X)(∂X/∂p). Using ∂x
j
/∂x
i
=
α(s
j
/s
i
) as an equivalent expression for (3.7), firm i’s FOC after some rearrange-
ments yields
15
m
i
=
1
ε
1 +
∑
j=i
l
ij
s
j
l
ii
s
i
[α + (1 − α)s
i
] − α
∑
j=i
l
ij
s
j
m
j
l
ii
s
i
. (3.8)
To represent (3.8) succinctly in matrix form, let
L be the diagonal matrix with l
ii
along its main diagonal and zero otherwise, m and s, respectively, be the vectors of
firms’ markups and market shares. Then (3.8) can be rewritten as
16
(see Appendix
3.A)
m = αQm +
α
ε
x
1
+
1 − α
ε
x
2
, (3.9)
where Q ≡
ˆ
s
−1
(I −
L
−1
L)
ˆ
s, x
1
≡
ˆ
s
−1
L
−1
Ls, and x
2
≡
L
−1
Ls.
In empirical work equation (3.9) can be used for the estimation of the effect
of PCO on the degree of market power of firms, and on the overall level of tacit
collusion in an industry. For the first task it is obvious that a firm exercises market
power if its markup is positive. In the context of this model, firm i exercises market
power if m
i
in (3.9) is significantly (in a statistical sense) positive. Without PCO,
14
Throughout the paper the notions of market conduct, degree of tacit collusion, market performance,
and market competitive intensity are used interchangeably for α.
15
Equation (3) in Alley (1997) is m
i
=
1
ε
1 +
∑
j=i
w
ij
s
j
(1−
∑
j=i
w
ji
)s
i
[α + (1 − α)s
i
] − α
∑
j=i
w
ij
s
j
m
j
(1−
∑
j=i
w
ji
)s
i
. He disregards
indirect shareholdings and since in the PCO presence l
ii
≥ 1 and l
ij
≥ w
ij
(i = j), in general, these two
equations will give different estimates of α and ε.
16
Theoretically, we can allow for different conjectural elasticities, in which case the scalar α in (3.9) is
replaced by the diagonal matrix ˆα with α
i
on its ii-th entry and zeros elsewhere. However, for empirical
estimation we need to make an identical conjectural elasticity assumption, hence α instead of α
i
or ˆα is
entered in all equations. Alley’s model can be also written in the form of (3.9) with the redefinition of
L
−1
L = I + (I −
ı
W)
−1
W.
Cross-shareholding in the Japanese banking sector 57
L = I, and the market power diagnosis of firm i reduces to the condition m
i
= [α +
(1 − α)s
i
]/ε > 0 (see Martin, 1988). In order to identify the market competitiveness,
one needs to estimate the value of α empirically.
17
Without PCO, L = I, hence (recalling that ı is the summation vector of ones)
(3.9) boils down to (see e.g., Martin, 2002)
m =
α
ε
ı +
1 − α
ε
s. (3.10)
The important difference between (3.9) and (3.10) is that without PCO price-cost
margins are linearly related to the conjectural elasticity, while with PCO this re-
lation is nonlinear. This is because the solution of (3.9) is m = (I − αQ)
−1
α
ε
x
1
+
1−α
ε
x
2
and (I − αQ)
−1
is nonlinear in α. Hence, it follows that the failure of taking
firms’ direct and indirect cross-shareholdings in the presence of PCO is likely to
give biased parameter estimates due to model misspecification.
18
Using (3.9) the range of the market competitive intensity α consistent with the
economic interpretations is given in the following result, which helps to infer the
industry market performance.
Theorem 3.1. Irrespective of whether PCO is present or absent, the reasonable range of
the market competitive intensity is α ∈ [−1/(n − 1); 1].
In Cournot competition we have ∂x
j
/∂x
i
= 0 for all j = i, which corresponds to
zero conjectural elasticity, i.e., α = 0. In this case markups in (3.9) become m =
(1/ε)
ˆ
L
−1
Ls (Merlone, 2001, p. 335). The value of α equal to the lower bound of
−1/(n − 1) characterizes the perfect competition outcome, because then price-cost
margins equal zero. The case α = 1 reflects the perfect cartel since then markups
equal the inverse of the price elasticity of demand.
19
Given the expressions for price-cost margins with and without PCO, respec-
tively, in (3.9) and (3.10), the obvious question is how the two are interrelated.
Clearly, it is impossible to compare two different real-world environments with
and without PCO as all the endogenous variables (i.e., price-cost margins and mar-
17
It is not possible to directly run an OLS regression of (3.9), since the inverse matrix (I − αQ)
−1
(which
would solve (3.9) for the vector of markups) contains the unknown market conduct parameter α. This
problem is similar to the so-called spatial autoregressive models in Spatial Econometrics, where Q and
α can be reinterpreted as a spatial weight matrix, and a spatial autoregressive parameter, respectively
(see Anselin, 1988). The only difference is that α is also included in the regression coefficient vector.
18
Similarly, one may get biased estimates if only direct PCO holdings are taken into account, which in
the model is equivalent to the case when L = I + W and
L = I.
19
Note also that if α is close to its lower bound, we say that the market competitive intensity is high,
and, similarly, an increase in α is referred to as the decrease in the market competitive intensity. For the
conjecture’s range without PCO see e.g., Kwoka and Ravenscraft (1986).
58 Chapter 3
ket shares) are different within the two frameworks. Hence, let us focus on the
difference between the markups assuming that α, ε, n, and s are identical in both
the PCO and the no PCO case.
20
Theorem 3.2. Let m
i
< 1/ε for all i = 1, . . . , n. For given α, ε, n, and s, price-cost
margins of firms with PCO are higher than those of firms without PCO provided that α ∈
[0, 1).
The intuition behind Theorem 3.2 is simple. In this setting, shareholding inter-
locks among firms cause a common interest of firms that in turn leads to greater
monopoly power of firms with PCO holdings. Recall that the requirement m
i
< 1/ε
means that firm i is not a monopolist (hence the above result excludes the perfect
cartel case).
3.4 Empirical estimation and results
In practice, simple direct use of accounting price-cost margins is insufficient as
marginal costs defined by economists are unobservable, i.e., firms’ costs should
also include opportunity costs. One way to deal with this problem in the literature
is assuming constant returns to scale (CRS), which means that marginal costs equal
average costs. Average costs of firm i, ac
i
, besides costs of variable inputs, include
also the normal rate of return on investments, i.e., ac
i
= (v
l
i
+ µK
i
)/x
i
, where l
i
and v are, respectively, the vectors of variable inputs of firm i and input prices, µ
and K
i
are, respectively, the rental cost of capital services and the value of capital
assets of firm i. Plugging the last expression in the definition of the price-average
cost margin, one gets firm i’s economic earnings per unit of sales, or, equivalently,
price-cost margins under the CRS assumption as (see e.g., Martin, 2002, p. 137)
m
i
=
px
i
− v
l
i
− µK
i
px
i
=
px
i
− v
l
i
px
i
− µ
K
i
px
i
= PCM
i
− µ
K
i
px
i
, (3.11)
which is equal to accounting price-cost margins (PCM
i
) minus the normal rate of
return on investments. Solving (3.9) for the vector of markups and combining it
with (3.11) yields the final model for empirical estimation as
21
20
Note that the assumption s
i
= s
0
i
for each i, where the superscript ’0’ refers to the no PCO case, does
not necessarily imply that all firms have equal market shares of 1/n.
21
Evidently (3.12) is a nonlinear function of the unknown parameters α and ε. Therefore, we numeri-
cally estimate parameters in (3.12) using a nonlinear least-squares approach. In MATLAB this is imple-
mented by the function lsqnonlin, which finds the minimum of the objective function on the basis of the
Levenberg-Marquardt method.
Cross-shareholding in the Japanese banking sector 59
PCM
i
=
α
ε
(I − αQ)
−1
x
1
i
+
1 − α
ε
(I − αQ)
−1
x
2
i
+ µKS
i
+ ν
i
, (3.12)
where
(I − αQ)
−1
x
1
i
is the i-th element of the vector (I − αQ)
−1
x
1
, KS
i
= K
i
/(px
i
)
is firm i’s capital-sales ratio, and ν
i
is a random error term. Without PCO, L = I,
thus Q is a null matrix, x
1
= ı and x
2
= s, and as a consequence (3.12) reduces to
(Martin, 2002, eq. (6.11))
PCM
i
= a
0
+ a
1
s
i
+ µKS
i
+ ν
i
, (3.13)
where a
0
= α/ε and a
1
= (1 − α)/ε. Hence, estimates for a
0
and a
1
provide the
estimates of α and ε.
3.4.1 Data
As an empirical application, we study the banking sector in Japan. Conventional
wisdom is that the Japanese economy is collusive due to the existence of keiretsu
groups that are historically interlinked through strong shareholding interlocks. We
select city and regional banks from the Bankscope database published by Bureau
van Dijk Electronic Publishing. Trust banks, long-term credit banks, security firms,
and other smaller cooperative institutions (such as Shinkin banks) are excluded
from the analysis because the sample should be consistent with the homogeneity
assumption of the theoretical model described in Section 3.3 in the sense that all
banks face the same inverse market demand function. Trust banks (next to having
banking business) are also engaged in trust business (i.e., asset management ser-
vices). Security firms apparently have different lines of business than commercial
banks, hence do not compete with each other in the same market either. Similarly,
long-term credit banks are mainly specialized in the provision of long-term loans
and debentures. Hence, the city banks and the regional banks constitute the “or-
dinary banks”. Legally, the two are not distinguished from each other and it is
basically the size and area of business that distinguishes them. Regional banks are
much smaller and operate in restricted areas, whereas city banks have nation-wide
branch networks and operation. Uchida and Tsutsui (2005) reports that in 1996 the
shares of city and regional banks in the Japanese loan market were, respectively,
49.6% and 33.1%, thus by analyzing these two groups one is able to cover 82.7%
of the total outstanding loans in Japan. (The total outstanding loan in Japan is de-
60 Chapter 3
Table 3.1: Descriptive s tatistics
Mean St. deviation Minimum Maximum
Overall sample (63 obs.)
Markups (PCM) 0.2274 0.1274 0.0288 0.8574
Market share (s) 0.0159 0.0341 0.0008 0.2058
Capital-sales ratio (KS) 2.6753 0.8051 1.0616 4.6928
Growth rate (GR) 0.3808 1.9184 −0.3210 15.3398
City banks (4 obs.)
Markups (PCM) 0.4763 0.3181 0.1983 0.8574
Market share (s) 0.1377 0.0496 0.0878 0.2058
Capital-sales ratio (KS) 2.3848 0.8442 1.6474 3.1439
Growth rate (GR) 3.8812 7.6394 −0.0100 15.3398
Regional banks (59 obs.)
Markups (PCM) 0.2105 0.0869 0.0288 0.5069
Market share (s) 0.0076 0.0049 0.0008 0.0265
Capital-sales ratio (KS) 2.6950 0.8061 1.0616 4.6928
Growth rate (GR) 0.1435 0.1146 −0.3210 0.6172
Note: Computations are based on the data given in thousands of US dollars.
GR is the growth rate of banks’ total revenue in 2003 relative to 2002.
fined as the sum of loans of city banks, long-term credit banks, trust banks, regional
banks, Shinkin banks, and credit cooperations.)
After deleting unprofitable banks and those without necessary data informa-
tion, we end up with a sample of 63 commercial banks for the fiscal year 2003,
which includes 4 city banks and 59 regional banks. Data on accounting price-cost
margins (PCM
i
) and market shares (s
i
) are derived from the banks’ unconsolidated
statements. The accounting price-cost margin is defined as the ratio of profit be-
fore tax over total revenue, where total revenue is the sum of net interest revenue
and other operating income, and profit before tax is equal to the total revenue mi-
nus overheads, loan loss provisions, and other net expenses. The capital-sales ratio
(KS
i
) is proxied by the ratio of total equity over total revenue. Descriptive statis-
tics are reported in Table 3.1. It shows that city banks have both economically and
statistically significant larger means of accounting price-cost margins and market
shares than regional banks. In particular, on average, city banks have higher ac-
counting markups and market shares by factors of 2.3 and 18.1, respectively. The
averages of the capital-sales ratios of these banks are roughly identical (i.e., with an
insignificant difference).
Data on ownership are available only for the last year of the bank’s reports,
which varies from 2002 to 2005. Thus in constructing the cross-shareholding ma-
trix for Japan, we assume that these direct shareholdings were also valid for 2003.
Cross-shareholding in the Japanese banking sector 61
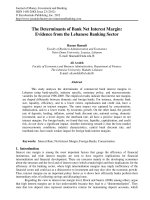
Figure 3.1: Partial ownership relations among the Japanese banks
Note: The figures are direct shareholdings in percentages. The arrows are directed from the shareholder
to the bank(s) it owns. C and R stand for city banks and regional banks, respectively. Source: BankScope,
Bureau van Dijk Electronic Publishing.
However, we should note that the ownership data, though crucial for this analysis,
represent an incomplete picture of the shareholding ties due to its partial (and in
some cases total) unavailability in the Bankscope dataset. In general, the city banks
are the most intensive shareholders in the Japanese commercial banking sector.
22
For illustration purposes, a few banks from the sample are chosen and their partial
ownership links are graphed in Figure 3.1. For the sake of simplicity, we disregard
outside shareholding links of these banks, which do exist. As an example, Fig-
ure 3.1 shows that Bank of Fukuoka owns 2.36% of the shares in Higo Bank. Two re-
marks are in place. First, there are cases of mutual shareholding ties in the Japanese
banking sector. In the figure this is the case for Kagoshima Bank and Miyazaki
Bank. Second, given this mutual relationship, one might expect that indirect share-
holdings could matter for the Japanese banks. It is easily seen that Mizuho Cor-
porate Bank has an indirect share in Miyazaki Bank via, for example, Kagoshima
Bank. However, in fact, because of the mutual shareholding described above there
is an infinite number of paths of different length through which Mizuho Corporate
Bank indirectly owns Miyazaki Bank (see Dietzenbacher and Temurshoev, 2008).
3.4.2 Estimation results
The results of the numerical nonlinear least-squares estimation are reported in Ta-
ble 3.2. Since in the presence of local optima, finding the global optimal point de-
22
In the entire financial system of Japan, besides city banks, also long-term credit banks and trust banks
comprise the heavy shareholders of other financial and nonfinancial institutions due to their nature of
operations. For example, trust banks are likely to hold shares in commercial banks as trustees of mutual
funds. Thus it is expected that the effect of PCO would be much stronger if these banks had also been
taken into account, but this would have required a different theoretical model for an industry with
differentiated products. This is, however, beyond the scope of the current chapter.
62 Chapter 3
Table 3.2: Empirical results (year 2003, obs.= 63)
Full PCO Direct PCO Alley No PCO Full PCO No PCO
ˆ
α
0.0435 0.0435 0.0435 0.0390 0.0281* 0.0255
(0.0404) (0.0404) (0.0404) (0.0401) (0.0163) (0.0160)
ˆ
ε
0.6189* 0.6189* 0.6188* 0.6167* 0.3329** 0.3241**
(0.3631) (0.3631) (0.3630) (0.3674) (0.1466) (0.1501)
ˆ
µ
0.0495*** 0.0495*** 0.0495*** 0.0521*** 0.0410*** 0.0430***
(0.0139) (0.0139) (0.0139) (0.0147) (0.0146) (0.0152)
ˆ
µ
GR
-0.0365** -0.0371*
(0.0177) (0.0190)
SSR 0.7382 0.7383 0.7383 0.7542 0.5850 0.6008
Note: The superscripts (*), (**), and (***) denote statistical significance of the coefficients
at 10%, 5%, and 1% levels, respectively. SSR denotes the sum of squired residuals. The
robust standard errors are given in parentheses.
pends on the initial parameters’ values, in the estimation we first constructed grids
for all parameters (i.e., we created a grid structure for α, ε and µ), and used all
possible combinations of these grids as starting points. Then the minimum value
of the sum of squared residuals (SSR) is chosen, and its corresponding estimates
are given in Table 3.2. Column 2 gives the estimates of the parameters in (3.12)
when both direct and indirect (full) PCO links are taken into account (i.e., when
L = (I − W)
−1
). Positive values of
ˆ
α are indicative of cooperative behavior of
banks. The full PCO model gives the market conduct estimate of
ˆ
α = 0.0435, which
is not statistically different from zero.
23
Hence, at this point one may conclude that
commercial banks in Japan in 2003 behaved as Cournot competitors. Table 3.2 also
shows that the Japanese banking sector is characterized by inelastic demand (i.e.,
ˆ
ε = 0.6189 which is significant at 10% level). So, theoretically, banks in 2003 would
have increased their revenues if they had raised the price. Finally, the sign of the
capital-sales ratio coefficient is positive as expected, and is statistically significant
for all estimated models. This is an estimate of the marginal rental cost of capital to
the firm. One can also interpret the capital-sales ratio as a barrier to entry, and from
this point of view its coefficient should also be positive, meaning that the higher
the capital-sales ratio, the more difficult it is for a new firm to enter the industry.
The third column of Table 3.2 gives the results of the direct PCO model (i.e.,
23
Standard errors are heteroscedastic-consistent. The error vector is ν(θ), where θ is a vector of k pa-
rameters. Denote the n × k Jacobian matrix by J(θ) with (J(θ))
ij
= ∂ν
i
(θ) /∂θ
j
. Then the heteroscedastic-
consistent estimate of the variance-covariance matrix of the estimate
˜
θ is
˜
Φ ≡
n
n−k
[
˜
J
˜
J]
−1
˜
J
Ω
˜
J[
˜
J
˜
J]
−1
,
where
˜
J = ∂ν/∂θ
|
˜
θ
and Ω is a diagonal matrix with
˜
ν
2
i
on its main diagonal (see e.g., Cameron and
Trivedi, 2005, Chapter 5.8).
Cross-shareholding in the Japanese banking sector 63
when L = I + W). The estimates of the parameters are identical to those of the full
PCO model, implying that for our sample indirect ownership links are insignificant
and do not have any impact on the results. The fourth column of Table 3.2 gives
the results for Alley’s model (i.e., when
L
−1
L = I + (I −
ı
W)
−1
W, see footnotes 15
and 16), which also gives estimates of the parameters that are very close to those
of the full PCO and direct PCO specifications. Alley’s model is based on the profit
specification given by (3.2), π
i
= (1 −
∑
k=i
w
ki
)z
i
+
∑
k=i
w
ik
z
k
, which is different
from (3.3) for the full PCO model. However, the closeness of the outcomes of all
these three models is due to the fact that there is a small number of PCO links in
our sample (to be discussed later) and direct shareholdings are small in size (on
average 3.2%), both of which imply that indirect PCO links are negligible.
Column 5 in Table 3.2 reports the estimates of the parameters in (3.12) when all
the elements of the PCO matrix are set to zero (i.e, L = I, hence effectively (3.13) is
estimated), which gives an estimate of the tacit collusion degree of
ˆ
α = 0.0390 that
is not statistically different from zero either. Hence, without considering any other
additional explanatory variable(s) in (3.12), neglecting PCO links does not give an
economic bias in the results. That is, both the full PCO and the no PCO models
predict that Japanese commercial banks compete in a Cournot oligopoly (although
note that the point estimates are different).
Following Alley (1993, 1997) we re-estimate the full PCO and the no PCO mod-
els in Table 3.2 by adding the growth variable GR
i
- the growth rate of a bank’s op-
erating income relative to the year 2002, which allows for changes in demand and
thus in accounting price-cost margins to be taken into account.
24
Theoretically, the
sign of the effect of the growth rate variable can be either positive, or negative. On
the one hand, an increase in market demand may raise demand on inputs, thereby
increasing their factor prices, hence may lead to lower accounting markups. On the
other hand, the growth rate of demand may increase accounting price-cost margins
by increasing output prices and/or expanding production volume. The results are
given in the last two columns of Table 3.2, where the estimate
ˆ
µ
GR
for the growth
variable is negative, and statistically significant.
Note that including GR
i
in the full PCO model gives a market conduct estimate
of
ˆ
α = 0.0281 that is statistically significant (at 10% level), while in the no PCO case
ˆ
α = 0.0255, which does not differ statistically significantly from zero. Hence, ne-
glecting cross-shareholding links in this case yields different economic outcomes:
24
We also estimated the models with other bank-specific factors, such as net loans and total fixed assets
to account for risk and capacity differences. However, these coefficients were insignificant and did not
change the results, hence are not reported.
64 Chapter 3
the no PCO case predicts Cournot oligopoly in the 2003 Japanese banking sector,
while the full PCO model predicts modest collusive environment in the industry.
Although
ˆ
α in the full PCO case is not highly statistically different from zero, this
result suggests that ownership links should be taken into account in empirical stud-
ies of the Japanese banking sector. In addition, we think that the main reasons for
the almost identical results of all the four models given in columns 2-5 of Table 3.2
are the following. First, as we already noted, the ownership data are incomplete,
and it is quite difficult to obtain the true picture of these linkages. This yields un-
derestimation of the PCO effects.
25
Second, some banks with partial ownership
data were excluded from the sample for their unprofitability and/or unavailabil-
ity of other required data. Third, in our 63 × 63 PCO matrix there are 67 cases
of shareholding links, which comprises only 1.7% of the total number of possible
ownership ties of n(n − 1) = 3906. Fourth, in general, in the Japanese financial sys-
tem city banks, long-term credit banks and trust banks are the main shareholders of
other financial (and nonfinancial) institutions (see footnote 22). Hence, we expect
that studies that concentrate also on the last two types of banks should consider
PCO links, otherwise the (economic) bias of the results might be significant. In
this chapter, however, we do not consider trust banks and long-term credit banks,
which would require using a different model of a differentiated-product nature.
3.4.3 Comparison with related studies
There are few studies that estimate the degree of competition in the Japanese bank-
ing sector. Before comparing our results with these studies, we first briefly discuss
different approaches in estimating the competition level (see for details e.g., Bresna-
han, 1989). CV models are frequently used for this purpose, starting with the early
important paper of Iwata (1974). The Clarke and Davies (1982) model, adopted
in this chapter, also belongs to this strand of literature. Since CV models provide
theoretical foundations for firms’ structure-conduct-performance reduced-form re-
lationships (which explains the term “structure-conduct-performance paradigm”),
they are widely used to infer the degree of market competition. The disadvantage
of using such models is that cost data are required, which in many cases are difficult
to obtain. The attempt of avoiding cost data resulted in the so-called “new empir-
ical industrial organization” (NEIO) literature pioneered by Bresnahan (1982) and
25
Dietzenbacher et al. (2000) analyzed the sensitivity in their analysis of the Dutch banking sector, be-
cause banks were only required to report if shares were larger than 5%. They showed that direct interests
below 5% are relevant and have a substantial effect on the estimates of banks’ price-cost margins.
Cross-shareholding in the Japanese banking sector 65
Lau (1982). Its econometric approach is structural because both demand and sup-
ply sides are explicitly considered. However, modeling the competition level does
not differ from the CV literature, which is stated by Bresnahan (1989, p. 1027) as
follows: “As a matter of fact, there is absolutely no difference between [CV and
NEIO approaches to modeling collusion and] the two specifications can nest the
same models”.
Another widely used approach is that of Panzar and Rosse (1987). The Panzar-
Rosse H statistic is the sum of the elasticities of the reduced-form revenues with
respect to all factor prices.
26
Its advantage is that few data are required on endoge-
nous variables (revenue is always observable even when price and quantity are
not), though it will require information on all the variables that shift demand or
cost. However, using H statistics in empirical work relies on the assumption that
markets are in the long-run equilibrium in each point of time. In general, speaking
about above methods and others including time-series data analysis, event studies,
studies of the determinants of the price, and fully dynamic models, Martin (2002,
p. 225) concludes: “No one of these are immune from criticism. Broadly speak-
ing, these diverse methodologies yield consistent results, tending to support the
hypotheses advanced by the structure-conduct-performance school”.
The paper closest to our work in terms of the methodology used is Alley (1993),
who uses exactly the same theoretical model, but without considering PCO link-
ages. The author finds that the degree of competitive intensity for 1986-87 Japanese
regional and Sogo banks is
ˆ
α = 0.6013, indicating a high degree of collusion. This
estimate is much larger than our estimate of
ˆ
α = 0.0281 for the Japanese commer-
cial banking sector (column 6 in Table 3.2). Two remarks are in place in this regard.
First, it might very well happen that the estimate of α is biased (upward), given the
fact that back in the 1980s-1990s shareholding interlocks were quite extensive in the
Japanese banking system compared to the current situation (see e.g., Miyajima and
Kuroki, 2007). Second, if the result would not change with PCO consideration, then
comparison of the two would suggest that competition has significantly improved
between 1986-87 and 2003.
Molyneux et al. (1996) employing Panzar-Rosse H statistics, conclude that Japa-
nese commercial (city and regional) banks behaved as if under monopoly in 1986,
but the market conduct improved in 1988 whereby it becomes consistent with mo-
26
If H is negative then firms’ policies are consistent with the monopoly conduct, 0 < H < 1 represents
monopolistic competition and H = 1 under perfect competition. These interpretations can be deduced
from the effect of an upward shift in firms’ marginal, average and total cost curves on the firms’ equilib-
rium revenues.
66 Chapter 3
nopolistic competition. Using the NEIO approach and long-term panel data from
1974 to 2000, Uchida and Tsutsui (2005) conclude that market competition largely
improved from the 1970s to the 1980s, but deteriorated after 1997. They also find
that the degree of competition is higher for city banks than for regional banks. Fi-
nally, Lee and Nagano (2008) compare the pre-merger period of 1986-1997 to the
post-merger wave period of 1998-2005 in a set of Japanese regional banks that is
divided into seven regions. Essentially their results in terms of H statistics suggest
that in six regions the monopolistic competition environment holds for both peri-
ods, while in only one region there is a tendency towards a more competitive envi-
ronment.
27
In relation to this chapter, we think that similar to the first point made
with regard to Alley’s (1993) study, there is a possibility of bias in the estimates of
the market conduct or H statistics due to ignorance of PCO linkages, which is again
much more probable for the results on earlier periods in these studies. The market
performance indicator for Japanese regional banks in 2000 in Uchida and Tsutsui
(2005) shows a collusive environment, which is consistent with our result for 2003.
However, their study does not reject Cournot competition for city banks in 2000.
All in all, we think that taking into account PCO links in all these studies is cru-
cial, which might even change the results, especially, for the period before the mid
1990s when cross-shareholding was believed to be one of the main distinguishing
features of the Japanese business groups.
3.4.4 Market power test
In this section the market power test of each individual bank is carried out. Hav-
ing the estimates of the market competitive intensity and the price elasticity of de-
mand, one can estimate firms’ markups using equation (3.9). Then in the context
of our model, firm i exercises market power if its estimated price-cost margin is
in a statistical sense significantly positive. As mentioned in Section 3.3, in an in-
dustry without PCO, the market power diagnosis of firm i reduces to the condition
[
ˆ
α + (1 −
ˆ
α)s
i
]/
ˆ
ε > 0 (see Martin, 1988).
The delta method is used in order to compute t-statistics of the markups in (3.9).
28
The estimated markups and their t-statistics based on the estimates of the full PCO
27
We should note that the authors’ own conclusion is, however, different. Lee and Nagano (2008) state
that “ the banking sector in Japan’s metropolitan area is very competitive, becoming more competitive
than that of 1986-1997” (p. 614). This conclusion is not consistent with the values of the H statistics with
their appropriate 95% confidence intervals given in their Table 1 on pp. 612-613.
28
Let price-cost margins depend on k parameters given by the vector θ and let C(θ) = ∂m(θ)/∂θ
. Then
according to the delta method, the estimated (asymptotic) variance-covariance matrix of the markups is
given by
˜
C
˜
Φ
˜
C
, where
˜
Φ is defined in footnote 23 (see e.g., Greene, 2003).
Cross-shareholding in the Japanese banking sector 67
model from Table 3.2 (i.e., column 6) are reported in Table 3.3. Note that estimating
markups for the actual no PCO case does not make sense, since we do not know
anything about the real environment without cross-shareholdings between banks.
That is, markups and market shares would be different in that case, implying that
using our data for this purpose would be totally misleading.
The t-statistics of all these markups are computed on the null hypothesis that
the true value of the statistics are zero, which is a market power test for each bank.
Several conclusions can be drawn from Table 3.3. First, given that the smallest t-
statistic in the entire sample is 2.183, we conclude that each bank exercises some
degree of market power (at a 5% significance level). Second, on average, banks
that hold shares in other banks have higher markups than banks without any stock-
holdings in rivals (i.e., 0.271 vs. 0.106). This difference is statistically significant
(the one-sided two-sample t significance test of means gives p = 0.0184 with 9 de-
grees of freedom), implying that PCO increases the market power of banks owning
shares in rivals. In our sample there are in total 67 cases of shareholdings (the sum
of the column “Sub” in Table 3.3, which denotes the number of subsidiaries, or,
equivalently, the sum of the column “Share” for the number of shareholders) that
are made by the 10 banks that hold shares in other banks, consisting of all four
city banks and six regional banks. Note also that the regional banks, and not the
city banks, are owned by others. Moreover, the correlation coefficient between the
estimated markups and the number of banks’ subsidiaries for the entire sample is
0.68, while that between the estimated price-cost margins and the number of banks’
shareholders is equal to −0.26. All in all, this confirms the conjecture that owning
shares in rivals increases (resp. decreases) market power of firms-owners (resp.
owned firms). Third, city banks, on average, have significantly higher price-cost
margins than regional banks (i.e., 0.501 vs. 0.107, and the difference is highly sta-
tistically significant with p = 0.0054). One of the explanations for this (in light of
the second point made above) is that city banks own many more banks with larger
shareholding size than regional banks. Table 3.3 shows that the four city banks, on
average, own 14.5 banks with an average direct stake of 4.98%, while they are not
owned themselves. On the other hand, on average, a regional bank owns only 0.2
banks with 0.21% as the average share, but 3.10% of its shares are owned by 1.1
banks. The six regional banks with shareholdings, on average, hold 2.01% shares in
1.5 banks, whereas 2.75% of their shares are owned by 2.5 banks (not shown in Ta-
ble 3.3). Hence, among other factors, owning larger shares in many regional banks
allows city banks to exercise a larger market power.
68 Chapter 3
Table 3.3: Market power test of the Japanese commercial banks in 2003
No Bank Name Type
ˆ
m
i
t-stat. Sub. %% Share. %%
1 77 Bank Reg. 0.117 2.634 0 - 2 2.47
2 Akita Bank Ltd Reg. 0.098 2.391 0 - 1 1.65
3 Aomori Bank Ltd. Reg. 0.098 2.392 0 - 2 3.25
4 Awa Bank Reg. 0.102 2.443 0 - 2 2.97
5 Bank of Fukuoka Ltd. Reg. 0.136 2.754 3 2.41 0 -
6 Bank of Ikeda Reg. 0.100 2.415 0 - 1 3.04
7 Bank of Iwate, Ltd. Reg. 0.100 2.418 0 - 1 3.71
8 Bank of Kyoto Reg. 0.111 2.567 0 - 1 3.16
9 Bank of Okinawa Reg. 0.095 2.342 0 - 2 1.48
10 Bank of the Ryukyus Ltd. Reg. 0.098 2.381 0 - 1 1.89
11 Bank of Tokyo - Mitsubishi Ltd City 0.467 2.571 24 3.45 0 -
12 Bank of Yokohama, Ltd. Reg. 0.162 2.850 0 - 0 -
13 Chiba Bank Ltd. Reg. 0.140 2.795 0 - 1 4.59
14 Chiba Kogyo Bank Reg. 0.099 2.399 0 - 2 9.44
15 Chikuho Bank Reg. 0.089 2.223 0 - 0 -
16 Chugoku Bank, Ltd. Reg. 0.115 2.615 0 - 0 -
17 Daishi Bank Ltd. Reg. 0.111 2.569 0 - 2 2.01
18 Eighteenth Bank Reg. 0.101 2.439 0 - 1 4.85
19 Gunma Bank Ltd. Reg. 0.124 2.686 1 1.20 3 2.60
20 Hachijuni Bank Reg. 0.121 2.676 0 - 1 4.76
21 Higo Bank Reg. 0.110 2.510 2 2.40 2 3.53
22 Hiroshima Bank Ltd. Reg. 0.126 2.710 0 - 2 3.25
23 Hokkaido Bank Reg. 0.111 2.575 0 - 2 2.86
24 Hokkoku Bank Ltd. Reg. 0.105 2.493 0 - 0 -
25 Hokuetsu Bank Ltd. Reg. 0.097 2.376 0 - 1 5.41
26 Hokuriku Bank Ltd. Reg. 0.133 2.757 0 - 0 -
27 Hokuto Bank Reg. 0.093 2.308 0 - 3 1.66
28 Hyakugo Bank Ltd. Reg. 0.108 2.535 0 - 2 3.19
29 Hyakujushi Bank Ltd. Reg. 0.106 2.503 0 - 1 2.69
30 Iyo Bank Ltd Reg. 0.113 2.591 0 - 1 5.60
31 Joyo Bank Ltd. Reg. 0.131 2.744 1 1.69 2 2.97
32 Juroku Bank Ltd. Reg. 0.113 2.593 0 - 0 -
33 Kagoshima Bank Ltd. Reg. 0.106 2.488 1 2.63 4 2.26
34 Kanto Tsukuba Bank Ltd. Reg. 0.095 2.343 0 - 0 -
35 Kiyo Bank Reg. 0.107 2.522 0 - 1 1.54
36 Michinoku Bank, Ltd. Reg. 0.094 2.320 0 - 0 -
37 MIE Bank Ltd Reg. 0.093 2.300 0 - 1 6.57
38 Miyazaki Bank Reg. 0.100 2.380 1 2.02 4 2.39
39 Mizuho Bank City 0.483 2.544 5 3.38 0 -
40 Mizuho Corporate Bank City 0.362 2.662 23 3.32 0 -
41 Musashino Bank Reg. 0.104 2.475 0 - 1 3.59
42 Nanto Bank Ltd. Reg. 0.112 2.581 0 - 1 4.56
43 Nishi-Nippon City Bank Ltd. Reg. 0.117 2.635 0 - 1 3.08
44 Ogaki Kyoritsu Bank Reg. 0.106 2.508 0 - 1 0.40
45 Oita Bank Ltd. Reg. 0.100 2.426 0 - 1 2.60
46 San-In Godo Bank, Ltd Reg. 0.109 2.547 0 - 0 -
47 Senshu Bank Ltd. Reg. 0.097 2.368 0 - 1 2.40
48 Shiga Bank, Ltd. Reg. 0.109 2.549 0 - 2 2.68
49 Shikoku Bank Ltd. Reg. 0.101 2.438 0 - 1 4.99
50 Shimizu Bank Ltd. Reg. 0.095 2.340 0 - 1 5.25
51 Shizuoka Bank Reg. 0.131 2.749 0 - 2 2.88
52 Shonai Bank Reg. 0.091 2.255 0 - 1 42.18
53 Sumitomo Mitsui Banking Corporation City 0.692 2.448 6 9.78 0 -
54 Suruga Bank, Ltd. Reg. 0.110 2.561 0 - 0 -
55 Tajima Bank Ltd. Reg. 0.089 2.231 0 - 0 -
56 Toho Bank Ltd. Reg. 0.104 2.484 0 - 0 -
57 Tohoku Bank Reg. 0.089 2.230 0 - 0 -
58 Tokyo Tomin Bank, Ltd. Reg. 0.101 2.434 0 - 1 4.97
59 Tottori Bank Reg. 0.090 2.248 0 - 0 -
60 Toyama Bank, Ltd. Reg. 0.087 2.183 0 - 0 -
61 Yamagata Bank Ltd. Reg. 0.096 2.361 0 - 1 4.80
62 Yamaguchi Bank Reg. 0.115 2.615 0 - 0 -
63 Yamanashi Chuo Bank Ltd. Reg. 0.099 2.406 0 - 3 2.92
Overall sample average 0.132 1.1 0.51 1.1 2.91
City banks average 0.501 14.5 4.98 0.0 -
Regional banks average 0.107 0.2 0.21 1.1 3.10
All shareholders average 0.271 6.7 3.23 1.5 1.37
All non-shareholders average 0.106 0.0 - 1.0 3.19
Cross-shareholding in the Japanese banking sector 69
3.5 Concluding remarks
Nowadays there is ample evidence of the presence of partial cross ownership (PCO)
links among firms. This study examines empirically the influence of PCO on the
degree of competitive intensity of an industry and on firms’ market power. The
model of Clarke and Davies (1982) is adopted and modified by taking into full ac-
count both direct and indirect interests of firms in each other via PCO ties. To the
best of our knowledge, in all empirical estimations of the degree of tacit collusion,
PCO is totally neglected, except for Alley (1997), who, however, disregards indirect
shareholdings.
It has been shown that, unlike in the no PCO case, with cross-shareholding the
link between firms’ price-cost margins and the market competitive intensity is non-
linear. Hence, in the presence of extensive shareholding links among firms, ignor-
ing PCO leads to biased parameter estimates due to model misspecification. It has
been shown that when market shares, number of firms, price elasticity of demand,
and collusion degree are given, firms with shareholdings exert a strictly larger mar-
ket power than those without PCO, provided that the market conduct is consistent
with Cournot or a more collusive environment. This is because shareholding inter-
locks among firms cause a common interest of firms, implying greater monopoly
power for firms with PCO holdings.
As an empirical application we have studied the Japanese banking sector in
2003. We found that the Japanese banks are competing in a modest collusive en-
vironment, while neglecting PCO yields a different economic outcome that indi-
cates a Cournot oligopoly. (By modest we mean that the degree of collusion is
relatively small being closer to the Cournot outcome rather than a monopoly.) Sec-
ondly, banks with passive investments in rivals exert a strictly larger market power
than those without any PCO, which confirms the hypothesis that acquiring shares
in rivals for a firm is one of the crucial means of enhancing its market power. Also,
city banks with many shareholdings were found to exercise a much larger market
power than regional banks with none or few stockholdings.
A few simplifying assumptions have been made throughout the chapter and
need some clarification. First, we did not consider product differentiation, and fo-
cused only on homogeneous market environment, which, in general, does not hold
in the real world. Analyzing a differentiated-product industry is rather complex,
since one has to compute all the own- and cross-price elasticities, for instance.
29
29
See, for example, the “menu approach” for identifying market conduct proposed by Nevo (1998).
70 Chapter 3
Nonetheless, the empirical results of the homogeneous model used here are still
useful in discovering the collusion degree within an industry, as the estimates of
the market competitive intensity indicate “the similarity of margins between firms
of different size” (Clarke et al., 1984, p. 447). As a matter of fact this has been con-
firmed in our study, as the low degree of collusion implies rather different levels
of firms’ market power. Second, the PCO structure has been assumed to be exoge-
nous, which might not reflect the optimal decisions of firms. However, similar to
the Gilo et al. (2006) study, our analysis was done from the perspective of antitrust
agencies facing a given pattern of PCO. Third, in the empirical part we have disre-
garded the PCO of banks with other financial and non-financial institutions. This
allowed us to focus on the commercial banking sector only, while neglecting the
potential effect of banks’ shareholding interlocks with firms in other industries.
30
However, for that one needs to use a different theoretical model for an industry
with differentiated products, which is beyond the scope of the current study.
30
Ideally, one would like to consider all possible shareholding links, but this would be unfeasible or,
at least, a complicated task in light of unavailability of (access to all) ownership data of firms in the all
involved industries.
Cross-shareholding in the Japanese banking sector 71
3.A Proofs
Derivation of equation (3.9). Equation (3.8) can be expressed in matrix form as
m =
α
ε
[I +
L
−1
ˆ
s
−1
(L −
L)
ˆ
s]ı +
1 − α
ε
[I +
L
−1
(L −
L)]s − α[
L
−1
ˆ
s
−1
(L −
L)
ˆ
s]m,
(3.A.1)
where ı is the summation vector of ones.
All the three terms in square brackets can be further simplified as
I +
L
−1
ˆ
s
−1
(L −
L)
ˆ
s =
ˆ
s
−1
L
−1
L
ˆ
s, I +
L
−1
(L −
L) =
L
−1
L,
L
−1
ˆ
s
−1
(L −
L)
ˆ
s =
ˆ
s
−1
(
L
−1
L − I)
ˆ
s. (3.A.2)
Plugging results from (3.A.2) in (3.A.1) we obtain
m = (1/ε)
α
ˆ
s
−1
L
−1
Ls + (1 − α)
ˆ
L
−1
Ls
− α
ˆ
s
−1
(
ˆ
L
−1
L − I)
ˆ
sm. (3.A.3)
With definitions Q ≡
ˆ
s
−1
(I −
L
−1
L)
ˆ
s, x
1
≡
ˆ
s
−1
L
−1
Ls, and x
2
≡
L
−1
Ls the equation
(3.A.3) yields (3.9).
Proof of Theorem 3.1. From economic point of view, the lower limit of α corre-
sponds to zero price-cost margins for all firms i = 1, . . . , n. Using x
2
=
ˆ
sx
1
, (3.9) can
be rewritten as m = (1/ε)(I − αQ)
−1
[αI + (1 − α)
ˆ
s]x
1
, which together with (3.10)
imply that markups are zero both with and without PCO when αI = −(1 − α)
ˆ
s,
or, equivalently, when α = −(1 − α)s
i
. This implies that market shares should be
equal, thus plugging s
i
= s = 1/n in the last condition gives α = −1/(n − 1). The
highest possible price-cost margins are those of the monopolist (perfect cartel) that
equal the inverse of the price elasticity of demand, which is the case when α = 1 in
(3.9), since then m = (1/ε) (I − Q)
−1
x
1
= (1/ε)(I − I +
ˆ
s
−1
L
−1
L
ˆ
s)
−1
x
1
= (1/ε)ı.
The same holds for the no PCO case in (3.10), hence the (economic) upper bound of
the conjectural elasticity both with and without PCO is α = 1.
Proof of Theorem 3.2. For simplicity denote A ≡
L
−1
L and B ≡ A − I. Premul-
tiplication of (3.9) by ε
ˆ
s yields ε
ˆ
sm = αAs + (1 − α)
ˆ
sAs − εαB
ˆ
sm. Add to and
subtract from the right-hand side (rhs) of the last equation αs + (1 − α)
ˆ
ss, which
in turn is equal to ε
ˆ
sm
0
as follows from (3.10), where m
0
is the vector of markups
in the no PCO case provided that α
0
= α, ε
0
= ε, n
0
= n, and s
0
= s. This yields