study of the relationship between mus musculus protein sequences and their biological functions
Bạn đang xem bản rút gọn của tài liệu. Xem và tải ngay bản đầy đủ của tài liệu tại đây (654.28 KB, 77 trang )
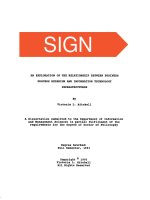
STUDY OF THE RELATIONSHIP BETWEEN Mus musculus
PROTEIN SEQUENCES AND THEIR BIOLOGICAL FUNCTIONS
A Thesis
Presented to
The Graduate Faculty of The University of Akron
In Partial Fulfillment
of the Requirements for the Degree
Master of Science
Pawan Seth
May, 2007
ii
STUDY OF THE RELATIONSHIP BETWEEN Mus musculus
PROTEIN SEQUENCES AND THEIR BIOLOGICAL FUNCTIONS
Pawan Seth
Thesis
Approved: Accepted:
_______________________________ _______________________________
Advisor Dean of the College
Dr. Zhong-Hui Duan Dr. Ronald F. Levant
_______________________________ _______________________________
Committee Member Dean of the Graduate School
Dr. Chien-Chung Chan Dr. George R. Newkome
_______________________________ _______________________________
Committee Member Date
Dr. Xuan-Hien Dang
_______________________________
Committee Member
Dr. Yingcai Xiao
_______________________________
Department Chair
Dr. Wolfgang Pelz
iii
ABSTRACT
The central challenge in post-genomic era is the characterization of biological
functions of newly discovered proteins. Sequence similarity based approaches infer
protein functions based upon the homology between proteins. In this thesis, we present
the similarity relationship between protein sequences and functions for mouse proteome
in the context of gene ontology slim. The similarity between protein sequences is
computed using a novel measure based upon the local BLAST alignment scores. The
similarity between protein functions is characterized using the three gene ontology
categories. In the study, the ontology categories are represented using a general tree
structure. Three ontology trees are constructed using the definitions provided in gene
ontology slim. The mouse protein sequences are then mapped onto the trees. We present
the sequence similarity distributions at different levels of GO tree. The similarities of
protein sequences across gene ontology levels and traversing branches are studied. The
posterior probabilities for correct predictions are calculated to study the mathematical
underpinnings in evaluating the similarities between the protein sequences. Our results
indicate that proteins with similar amino acid sequences have similar biological
functions. Although the similarity distribution in each functional group across GO levels
varies from one functional group to another, the comparison between distributions of
parent and child groups reveals the strong relationship between sequence and function
similarity. We conclude that sequence similarity approach can function as a key measure
iv
in the prediction of biological functions of unknown proteins. Our results suggest
that the posterior probability of a correct prediction could also serve as one of the key
measures for protein function prediction.
v
ACKNOWLEDGEMENTS
I would like to express my sincere appreciation to my advisor, Dr. Zhong-Hui
Duan, for her constant encouragement and invaluable guidance during this study. I am
grateful to her for offering me an opportunity to do my thesis under her. I am very
impressed by her kindness and personality. This thesis and my study in Computer
Science Department would not have been possible without her help and support.
I would also like to acknowledge the help of Computer Science Department for
offering me an assistantship. I would also like to acknowledge the help from Dr.
Wolfgang Pelz, Dr. Yingcai Xiao, Dr. Timothy W. O’Neil, Dr. Xuan-Hien Dang, Dr.
Chien-Chung Chan, Dr. K.J. Liszka and Ms. Peggy Speck for their constant assistance.
I would like to dedicate this thesis to my family. Without their encouragement,
love and support, I do not think I can finish this degree, this thesis and the study at the
University of Akron. I am forever indebted to them, for the sacrifices they make to help
me to achieve this success.
vi
TABLE OF CONTENTS
Page
LIST OF TABLES ……………………………………………………………… viii
LIST OF FIGURES ………………………………………………………………… ix
CHAPTER
I. INTRODUCTION …………………………………………………………… 1
1.1. Comparative Methods ………………………………………………… 1
1.1.1. Smith-Waterman Algorithm ………………………………… 2
1.1.2. Basic Local Alignment Search Tool ………………………………….3
1.2. Gene Ontology…………………………………………………………… 3
1.3. Chromosome (Mus Musculus) ……………………………………… 6
1.4. Overview of Thesis Work …………………………………… 7
II. MATERIALS AND METHODS………………………………………………… 9
2.1. Dataset (Chromosome 1 of Mus Musculus)… ……………………… 9
2.2. Sequence Similarity Approach …………………………………… 12
2.3. Basic Local Alignment Search Tool Algorithm …………………… 16
2.3.1. Scoring Matrices……………………………………………………… 18
2.3.2. Bl2seq ………………………………………………………… 21
2.4. Gene Ontology ……………………………………………………… 24
2.5. Perl ………………………………………………………………………… 26
vii
III. RESULTS AND DISCUSSIONS…………………………………………… 27
IV. CONCLUSION……………………………………………………………… 49
REFERENCES 50
APPENDICES 53
APPENDIX A. CRITICAL SOURCE CODE 54
viii
LIST OF TABLES
Table Page
2.1 Information contained in UniProt flat file…………………………………… 9
2.2 List of unique proteins for each chromosome pair (Mus Musculus) ……… 10
2.3 bl2seq options (cited from NIH website) ………………………………… 22
3.1 Annotated protein sequences distribution for GO slim……………………… 27
3.2 GO terms for three ontologies for which protein sequences were annotated 28
3.3 p-value distribution for annotated protein sequence pairs…………………… 34
3.4 p-value distributions of sequence pairs annotated for molecular function… 37
3.5 p-value distribution of sequence pairs annotated for biological process … 38
3.6 p-value distribution of sequence pairs annotated for cellular component … 41
3.7 p-value analysis for molecular function branch wise …………………… 42
3.8 p-value analysis for cellular component branch wise ……………………… 43
3.9 p-value analysis for biological process branch wise …………………… 45
3.10 Posterior probability for a molecular function’s branch ………………… 47
ix
LIST OF FIGURES
Figure Page
1.1 View of GO:0007610 using Gene Ontology Browser …………………… 4
1.2 Exploring the Mus Musculus genome using Ensembl site tool …… …7
2.1 Chromosome 1 using Ensembl site tool ………………………………… 11
2.2 Matrix H
ij
generated after applying the algorithm ………………………… 15
2.3 Standard substitution matrix for BLOSUM62 …………………………… 21
3.1 Definition for GO:0008150 in GO slim …………………………………… 29
3.2 Definition for GO:0007582 in GO slim …………………………………… 30
3.3 GO tree (GO slim) for molecular function … 31
3.4 GO tree (GO slim) tree for biological process ………………………… 32
3.5 GOSlim tree for cellular component …….…………………………… 33
3.6 Number of GO groups at different levels of ontologies ………………… 35
3.7 Number of proteins across different GO levels ………………………… 36
3.8 p-value distribution of sequence pairs annotated for molecular function … 37
3.9 p-value distribution of sequence pairs annotated for biological process … 39
3.10 p-value distribution of sequence pairs annotated for cellular component … 40
1
CHAPTER I
INTRODUCTION
The accrual of sequence data including genomic sequences, transcripts,
expression data [1] is primarily due to the effort started by U.S. Human Genome Project
in 1990 [2]. The rapid advancements in the technology have accelerated the current speed
of sequencing resulting in the accumulation of large amounts of information. This has
created a bottleneck for a large number of genes which still remain uncharacterized i.e.
they have no structural or functional notation [3].
The major problem that has baffled biologists in the post-genomic biology is the
functional assignment of proteins: A large percentage of Open Reading Frames (ORFs)
have unknown functions which unless resolved will not help biologists comprehend the
capabilities of an organism [4]. The challenge is to use bioinformatics to help abridge the
gap between the amount of sequence data and the functional annotation. Comparative
sequence analysis tools are used for the detection of functional regions in genomic
sequences.
1.1 Comparative Methods
The Comparative methods have become an important tool to study the protein
sequences. Proteins are composed of amino acids which can be aligned and compared to
other protein sequence(s) [5].
2
The computational tools based on sequence homology BLAST, PSI BLAST,
are widely used for the functional annotations of genes in newly sequenced genomes [6].
In sequence similarity-approach the functions of a query protein are deduced from those
of homologous proteins of known functions obtained from database searches. The
sequence similarity approaches for these proteins are based on the assumption that they
are functionally linked. The hypothesis is that the evolution of proteins with similar
functions occurs in a correlated fashion and therefore the homology is present in the same
subset of organisms [7]. There are varieties of sequence similarity algorithms that can
find the regions of similarity between protein sequences.
1.1.1 Smith-Waterman Algorithm
Smith-Waterman is one of the most popular local sequence alignment schemes to
determine the similarities between the regions of the query sequence and a sequence
database (proteins or nucleotides). In 1981 Temple Smith and Michael Waterman
proposed this algorithm [8] based on dynamic programming technique which is
guaranteed to find an optimal local alignment between two sequences corresponding to
the scoring system being implemented (Substitution Matrix or Gaps Scoring). It identifies
the maximal homologous sequences among the protein sequences being compared. These
protein sequences can be of any length, at any location. The amino acid chains (in case of
proteins) or nucleotides are taken as a string and character by character comparison is
done. Relative weights are assigned to these character-to-character comparisons. If an
exact match is found (“hit”) or if a substitution is done a positive weight is assigned to
that comparison or else if an insertion or deletion operation is performed a negative
3
weight is assigned to the comparison. These scores are arranged in the weight matrices
where they may be added together and the highest scoring alignment is reported.
1.1.2. Basic Local Alignment Search Tool
BLAST, a heuristic search algorithm, approximates the Smith-Waterman
algorithm is used to compare amino acid sequences of different proteins or the
nucleotides of Deoxyribonucleic acid (DNA) sequences [9, 10].
The BLAST then compares a query sequence (protein or nucleotide) and a
sequence database (protein database or nucleotide database) and identifies the database
sequences that resemble the query sequence above a certain threshold. The main idea
behind BLAST’s operation is that given a pair of sequences, algorithm will try to match
small fixed length W between the query and sequences in database and will try to extend
this length in both directions. Using this way it identifies regions of local alignment in the
query sequence similar to subsequences in database and label them as High Scoring Pairs
(H.S.P.) [10]. These regions of high sequence similarity are assigned some scores based
on the scoring system used and statistically significant alignments are displayed to the
user. These alignments can further be studied and with the help of statistical concepts and
inferences can be drawn.
1.2 Gene Ontology
The genetic information of a cell is carried by Deoxyribonucleic Acid (DNA) and
it consists of thousands of genes. Genes are the working subunits of DNA and encode
instructions on how to make proteins [11]. The Gene Ontology (GO) provides a
4
controlled vocabulary to describe gene and gene products in an organism. The three
organizing principles of GO are - biological process, cellular component and molecular
function [12]. A gene or a gene product may be associated with one or more cellular
processes; active in biological process and perform molecular function. A cellular
component is a part of the cell, either an anatomical structure or a gene product. A
biological process refers to events attained by a single unit or assembly of molecular
functions. Molecular function describes the activities occurring at the molecular level.
The terms in these ontology are organized in a Directed Acyclic Graph (DAG) and linked
by two relationships, 'is a' and 'part of'. DAG is also referred to as a rooted tree (tree with
a root). Gene Ontology Browser can be used to describe this tree like structure.
Figure 1.1. View of GO:0007610 using Gene Ontology Browser
5
For example GO:0007610 represent the behavioral response to stimulus, assigned
to biological process and textual definition for this GO terms is "The specific actions or
reactions of an organism in response to external or internal stimuli. Patterned activity of
a whole organism in a manner dependent upon some combination of that organism's
internal state and external conditions.” GO slim is a cut down vocabulary provided by
GO ontologies. GO slim contains a subset of terms in the whole GO [13]. GO slims are
created by users according to their needs and provides a brief overview of ontology
content without going into specific fine grained specifications.
A wide variety of ontology based searches have been designed to annotate
sequences on a large scale. Vinagayam [14] used support vector machines for the
assignment of molecular function GO terms to uncharacterized cDNA sequences and to
define a confidence value for each prediction. cDNA sequences were annotated to GO
and these sequences were then used to train a Support Vector Machine (SVM) classifier.
The nucleotide sequences were searched against GO-mapped protein databases and
significant hits were recorded. Each GO-term obtained was either labeled as correct (+1)
or incorrect (-1) by comparing it with original annotation. BLAST results were associated
as "features" with these samples. The classifier was trained with this data to predict the
function of unknown sequences. This automated annotation system resulted in the large
scale cDNA functional assignment, to achieve a high-level of prediction accuracy without
any manual intervention. Zehetner [15] worked on the OntoBlast to predict the potential
functions for an unknown sequence by presenting a weighted list of ontology entries
associated with similar sequences from completely sequenced genomes identified in
BLAST search. It then finds information regarding the potential functions. The functional
6
annotation of the sequences provides an insight to the processes in which a gene may be
involved . Xie et al's [16] GO engine combines homology search with text mining.
Schug [17] developed rule-based systems based on the intersection of GO terms that
contain protein domain at different similarity levels. The appeal of these approaches is
that they can directly assign a biological meaning to an uncharacterized protein sequence.
However, matching sequences do not always infer similar functions [4].
1.3 Chromosome (Mus Musculus)
In this thesis, we investigated the degree of overall similarity of protein sequences
from Chromosome 1 (Mouse) in each functional group defined by GO terms. Mouse
(Mus musculus) is a common rodent, closely related to the rat. The mouse has been a
major organism, for research purposes to study basic biology, on which extensive works
have been done to sequence its genome. The genome of Mus musculus was the second
mammalian genome to be sequenced whose complete draft entered the public nucleotide
sequence repositories in 2002. It has 19 chromosome pairs, 1 X and 1 Y chromosomes
which can be viewed with the help of Ensembl tool [18].
Ensembl project came into being with the collaborative efforts from EMBL -
European Bioinformatics Institute (EBI) and the Wellcome Trust Sanger Institute (WTSI).
The main task was to develop a software system which could produce and maintain an
automatic annotation on selected eukaryotic genomes.
7
Figure 1.2 Exploring the Mus Musculus genome using Ensembl site tool
1.4 Overview of Thesis Work
In this thesis, we investigated the mathematical underpinnings of an automated
sequence annotation approach based on sequence similarity and gene ontology. In the
Chapter I we revised the basic concepts of biology and bio-informatics relevant to the
area of this research study. In Chapter II - materials and methods, we studied the degree
of similarity of protein sequences in each functional group defined by a GO term, using
the protein sequences from chromosome 1 of Mus Musculus. The dataset (protein
sequences for chromosome 1 for Mus Musculus) was downloaded from European
Bioinformatics Institute (EBI) website [20], gene ontology file from gene ontology
consortium [12] and alignment tools from National Center for Biotechnology Information
8
(NCBI) [9]. In chapter III - results and discussion, PERL scripts were processed and
parsed to get the distribution of similar pairs for the three ontologies - namely biological
process, molecular function and cellular component. We studied the degree of similarity
of protein sequences in each functional group defined by a GO term, using the protein
sequences from chromosome 1 of mouse. We explored the structures of the three
ontologies - biological, cellular and molecular category and re-evaluate the hypothetical
assumption - similar biological sequences implies similar functions. We used a novel
measure of overall similarity between protein sequences based on the results of local
BLAST alignments [19].
We also examined the effects of the levels of GO terms on the degree of similarity
and also discussed the sequence similarity distribution at different levels of GO tree.
Similarity distributions of sequence pairs were also analyzed for each of molecular
function, biological process and cellular component ontologies branch-wise. To analyze
and predict the plausible potential relationships of similar sequences we computed the
posterior probability of the hypothesis - probabilities of the A and B having similar
functions after it is known that both A and B have similar sequences.
9
CHAPTER II
MATERIALS AND METHODS
This chapter addresses the strategies and operations used and implemented in our
studies. Mouse (Mus musculus) has been an important organism in biology and medicine
for research purposes. Sequence similarity approach, in particular Smith-Waterman
algorithm was proposed by Temple Smith and Michael Waterman in 1981. A more faster
and popular algorithm which approximates Smith-Waterman is Basic Local Alignment
Search Tool (BLAST) was developed by Stephen Altschul, Warren Gish, David Lipman,
which primarily compares biological sequence information.
2.1. Dataset (Chromosome 1 of Mus Musculus)
The protein sequences for first chromosome of mouse (Mus Musculus) were
downloaded from the (EBI - UNIPROT format) [20] in May, 2006. Each line of an
experiment entry in the file begins with a two character line code (identifier) which
suggests the type of information contained in the line. The identifiers and the information
they suggest are shown in the Table 2.1.
Table 2.1 Information contained in UniProt flat file [20]
Code
Meaning
Description
ID Identification Contains identifying information and characteristics of the
sequence.
10
Table 2.1 Information contained in UniProt flat file [20]
DT Date When the entry was created, or when the sequence or
annotation was modified.
DE Description The gene(s) that code for the protein.
GN Gene name(s) The organism from which the sequence is derived.
OS Organism species If the sequence is non-chromosomal in origin.
OG Organelle The taxonomic class to which the organism belongs.
OC Organism classification The NCBI TaxID for the OC line.
OX Taxonomy cross-
reference(s)
The sequential number of the literature citation within the
entry.
RN Reference number Bibliographic cross-reference, such as PubMed ID.
RX Reference cross-
reference(s)
Authors of the citation.
RA Reference authors Title of the citation.
RT Reference title Source of the citation, such as journal, book, or unpublished
data.
RL Reference location Free text notes about the protein.
CC Comments Pointers to sources or related information for the entry.
DR Database cross-
references
Annotation of specific residues of the sequence.
FT Feature table Marks the beginning of the sequence and provides summary
data.
SQ Sequence header The sequence itself.
(no
code)
Sequence data End of entry.
// Termination line
UniProt dataset was picked up [20] for this thesis as it comes along with a lot of
information related to any particular protein other than the amino acid sequences
comprising it.
Table 2.2 List of unique proteins for each chromosome pair (Mus Musculus)
Genome component Length (bp) Number of unique proteins
11
Table 2.2 List of unique proteins for each chromosome pair (Mus Musculus)
Chromosome 1 197069962 1870
Chromosome 2 181976762 3709
Chromosome 3 159872112 1547
Chromosome 4 155029701 2811
Chromosome 5 152003063 1869
Chromosome 6 149525685 1728
Chromosome 7 145134094 2583
Chromosome 8 132085098 1565
Chromosome 9 124000669 1780
Chromosome 10 129959148 1450
Chromosome 11 121798632 3367
Chromosome 12 120463159 1088
Chromosome 13 120614378 1179
Chromosome 14 123978870 1177
Chromosome 15 103492577 1178
Chromosome 16 98252459 1017
Chromosome 17 95177420 1580
Chromosome 18 90736837 773
Chromosome 19 61321190 1063
Chromosome X 165556469 1378
Chromosome Y 16029404 38
UniProt sets for 19 chromosome pairs, 1 X and 1 Y pair were taken and base pairs
(bp) per chromosome and number of unique proteins in each of them were listed in Table
2.2 above. Two nucleotides on opposite complementary DNA or RNA strands that are
connected via hydrogen bonds are called base pairs. Chromosome 1 has the largest length
(bp) so it picked up for this thesis. There were 1870 protein sequences in the first
chromosome.
Figure 2.1 Chromosome 1 using Ensembl site tool
12
2.2. Sequence Similarity Approach
There are varieties of sequence similarity tools that align the amino acid sequence
pairs (from two different proteins) and find the regions of high similarity scores between
them. Local or global alignments are the two main approaches to compute the regions of
high similarity between sequence pairs. Global alignment approach aligns the entire
amino acid sequences between the pairs. By contrast, local alignment scheme identifies
the similar regions within the long sequences thus increasing the chances of getting more
number of similar regions as compared to former method which tries to globally optimize
the entire sequence over the other [21].
Smith-Waterman is one of the most popular local sequence alignment schemes to
determine the similarities between the regions of the query sequence and a sequence
database (proteins or nucleotides).
This algorithm is based on the dynamic programming approach, which finds the
solutions to the smaller chunks of a problem and combines them on the whole to find a
complete optimal solution to the problem. It recursively performs the local alignment
comparison on the segments of all possible paths and picks up the one which has the
maximum similarity score as an optimal solution until a threshold has been reached.
Based on the above calculations, character-to-character comparison is done and scores or
weights are assigned to each comparison. It’s positive for exact matches/substitutions,
and negative for insertions/deletions. A weight matrix is build, scores are added and
highest scoring alignment is reported.
This technique is more sensitive and superior as compared to BLAST and FASTA
as it does pair wise comparisons which results in covering large number of possibilities
13
but the time taken to run this algorithm is higher as compared to the other two. This
explains the popularity of the BLAST algorithm.
For example, there are two nucleotide sequences A = a
1
a
2
a
3 …
a
n
and B = b
1
b
2
b
3 …
b
m
. s (a, b) denotes the similarity between sequence elements a and b. W
k
denotes
the deletions of length k. A matrix H to find pairs of segments with high degrees of
similarity is set up
H
k0
= H
0l
= 0 for 0
≤
k
≤
n and 0
≤
l
≤
m
H
ij
is the maximum similarity of two segments ending in a
i
and b
j
respectively is
calculated from the equation [22]
ij i-1, j-1 i j i-k, j k i, j-1 1
H = max {H + s(a , b ), max{H - W }, max{H - W
}, 0}
(Eq. 2.1)
Where, 1
≤
i
≤
n and 1
≤
j
≤
m
The calculation of H
ij
from equation 2.1 considers the following possibilities for ending
segments at any a
i
and b
j
.
1)
If a
i
and b
j
are associated, then new score is the previous score plus the similarity
scores for the two residues.
H
i-1, j-1
+ s (a
i
, b
j
)
2)
If a
i
is at the end of a deletion of length k, the similarity is
H
i-1, j-
W
K
3)
If b
j
is at the end of a deletion of length l, the similarity is
H
i-1, j-
W
l
14
4)
Finally, a zero is included to prevent calculated negative similarity, indicating that
no similarity up to a
i
and b
j.
Noticeably, we are transforming one string into another string by performing
certain operations on the individual characters that make up that string. So similarity
between two strings can also be defined as “the value of alignment between the two
strings that maximizes the total alignment value (highest score)”
Here’s an example to show the implementation of the Smith Waterman algorithm
more clearly [23]. Suppose there are two nucleotide sequences which are to be compared
against each other
Sequence 1: CAGCCUCGCUUAG
Sequence 2: AAUGCCAUUGACGG
Scores are derived from a simple similarity matrix, values chosen are:
→
Match = +1
→
Mismatch = -
1
3
→
Gap = -1+
1
3
×
k (k = extent of gap, number of residues included in the gap)
A similarity matrix is build up with all cell values = 0 and to ensure that a new
alignment path can start at any point the scores are not allowed to fall below 0. Values are
updated in the cell based on the value of the cell plus the highest value in sub row, sub
column or direct diagonal while keeping the gap penalties in account. These values can
rise, fall or stay same. The value in any cell is the highest score for an alignment of any
length ending at that cell.
15
Figure 2.2 Matrix H
ij
generated after applying the algorithm [23]
In the above example the alignment is obtained contains both a mismatch and an internal
deletion.
G-C-C-A-U-U-G
G-C-C-*-U-C-G
However, the Smith-Waterman algorithm is fairly demanding of time and memory
resources: in order to align two sequences of lengths m and n, O (mn) time and space are
required. In the next section we will be discussing about another comparison algorithm
popularly known as BLAST.
16
2.3 Basic Local Alignment Search Tool Algorithm
Basic Local Alignment Search Tool (BLAST), an approximation of Smith-
Waterman algorithm searches for high scoring sequence alignments between the query
sequence and the database of sequences. BLAST works in three major steps [24, 25, 26,]:
1)
Compile list of high-scoring strings (words) - BLAST filters out low complexity
regions from the query sequence and compiles a list of high-scoring words which
consists of all words with ‘
w’
characters that scores at least ‘
T’
with some word in
the query sequence. BLAST uses a scoring matrix (described below - BLOSUM
62 is by default for amino acids) to determine all matching words with high scores.
A Low complexity and small threshold score may result in reporting of large
number of statistical significant but biologically un-interesting results. The values
above a certain threshold are taken. There can be a tradeoff between speed and
sensitivity at this stage: higher threshold gives greater speed but might miss
biologically significant results [27].
2)
Search for hits - In the second step BLAST searches through the target sequence
database for exact matches to the word list generated either using a hash table or
finite state machine. Finite state machines are used are used to calculate state
transition table that tells what state to go is based on the next character in the
sequence. If a match is found, it is used to seed a possible alignment between the
query and the database sequences.
3)
Extend seeds to obtain segment pairs - In third step, BLAST method tries to
extend the alignment from these matching words in both directions as long as
score increases. The resulting segment pairs are called High Scoring Pair (H.S.P).