metals and mining industry primer credit suisse (2009)
Bạn đang xem bản rút gọn của tài liệu. Xem và tải ngay bản đầy đủ của tài liệu tại đây (2.83 MB, 120 trang )
DISCLOSURE APPENDIX CONTAINS IMPORTANT DISCLOSURES, ANALYST CERTIFICATIONS, INFORMATION ON
TRADE ALERTS, ANALYST MODEL PORTFOLIOS AND THE STATUS OF NON-U.S ANALYSTS. FOR OTHER
IMPORTANT DISCLOSURES, visit www.credit-suisse.com/ researchdisclosures or call +1 (877) 291-2683. U.S.
Disclosure: Credit Suisse does and seeks to do business with companies covered in its research reports. As a result,
investors should be aware that the Firm may have a conflict of interest that could affect the objectivity of this report. Investors
should consider this report as only a single factor in making their investment decision.
13 January 2011
Americas
Equity Research
Diversified Metals & Mining
Metals & Mining Primer
INDUSTRY PRIMER
Metals and Bulk Commodities
The following is a basic introduction to the underlying metals and bulk
commodities affecting most of the North American metals and mining industry.
Research Analysts
David Gagliano, CFA
212 538 4369
Richard Garchitorena, CFA
212 325 5809
Sean Wright, CPA
212 538 3284
Ralph M. Profiti, CFA
1 416 352 4563
Edward J. Yew, MBA, P.Eng
416 352 4677
Anita Soni, P. Eng., CFA
416 352 4587
Klay Nichol
416 352 4590
Alex Terentiew
+1 416 352 4599
13 January 2011
Metals & Mining Primer
2
Table of Contents
Base Metals 3
Aluminum 4
Copper 13
Nickel 23
Silicon Metal 31
Zinc 35
Precious Metals 42
Gold 43
Platinum Group Metals (PGMs) 55
Silver 65
Bulk Commodities 71
Coal 72
Molybdenum 87
Uranium 91
Steel 100
Steel 101
13 January 2011
Metals & Mining Primer
3
Base Metals
• Aluminum
• Copper
• Nickel
• Silicon Metal
• Zinc
13 January 2011
Metals & Mining Primer
4
Aluminum
Aluminum is the most abundant metallic element on earth, making up approximately 8% of
the planet’s crust. However, aluminum itself does not exist in nature as a metal. It is found
in the form of bauxite, the term for the ore carrying large amounts of aluminum oxide or
alumina. Although bauxite ore is relatively easy to mine, the aluminum production process
is much more complex, with the current process discovered and patented by Martin Hall
and Pall Heroult (the Hall-Heroult process) in 1886. This process remains the primary
method used to produce aluminum. Some of the many uses of aluminum include
transportation, packaging, construction, consumer durables, electrical transmission lines,
and machinery.
Properties of Aluminum
Weight. Aluminum has about one-third the weight of steel but is relatively strong, offering a
high strength-to-weight ratio. This helps to reduce the weight of vehicles, thus saving
energy, and is one of the reasons why aluminum consumption in transportation has been
the fastest growing application for the metal since 1994. In 2000, the average automobile
contained 257 lbs of aluminum. By 2006, aluminum surpassed iron to become the second
most used material in automobiles globally (after steel), and by 2010 the average vehicle
contained 340 lbs of aluminum content.
Corrosion resistance. Aluminum is highly resistant to weather, common atmospheric
gases, and liquids, holding up much better than other products such as iron (aluminum
does not rust and peel off like iron, but adheres to the metal’s surface).
Conductivity. Aluminum is one of the best heat and electricity conductors among the
metals, with 60% of the conductivity of copper but with a much lower density. Thus, it is
frequently used in power transmission lines and towers, as well as lower-voltage
applications, such as appliances.
Strength. Alloys can make aluminum extremely strong, enough to compete for use in
applications in place of construction steel. Additionally, aluminum’s high strength-to-weight
ratio makes it ideal for transportation applications.
Elasticity. Aluminum exhibits high elasticity, which reduces the load demand on
foundations in structures under shock loads (both industrial and residential). This is
another reason why it has been highly popular in its extruded form, in an unlimited number
of shapes and construction applications.
Ease of recycling. Aluminum is very conducive to recycling, as the metal has a fairly low
melting point (660 degrees Celsius), allowing for low energy requirements and high
usability (virtually anything made from aluminum can be recycled).
Uses of Aluminum
Given the numerous unique properties of aluminum (strength/weight ratio, low corrosion,
high conductivity, etc.), the uses of aluminum are varied and wide ranging.
Transportation. Aluminum is used extensively in automobiles, aerospace, rail, and marine
applications owing to its light weight, anticorrosiveness, and strength.
Construction. Aluminum’s anticorrosive nature makes it ideal for use in exterior
construction products such as roofing, siding, windows, gutters, etc.
Electrical. Aluminum is used in overhead power cable wiring, transport and industrial
electrical cable, power substations, and fluorescent tubes.
Packaging. One of the most common everyday uses of aluminum is in the form of
beverage cans, aluminum foil, and other forms of packaging (food, cosmetics, and
pharmaceuticals).
Periodic table symbol: Al
A
tomic number: 13
13 January 2011
Metals & Mining Primer
5
Others. Additional uses of aluminum include machinery/equipment, sports equipment,
medical devices, consumer durables, and furniture.
The vast range of aluminum end markets (i.e., transportation, packaging, construction,
power lines, and consumer durables) means that the industry’s demand growth is heavily
reliant on the overall health of the economy, with aluminum shipment demand often looked
at as an early indicator of an economy’s health.
The Production Process
The process of making aluminum begins with bauxite mining, moves to alumina refining,
and ends with aluminum smelting. The downstream businesses refer to the casting,
rolling, and extrusion of the primary ingots into various end products, semis, and the use of
recycling in those processes.
Normally, four to five tonnes of bauxite is used to produce two tonnes of alumina, and two
tonnes of alumina is required to make one tonne of aluminum.
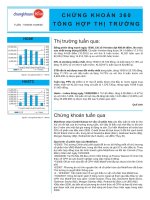
Exhibit 1: Integrated Aluminum-Making Process Flow Chart
Bauxite Mining
Alumina Refining
Aluminum Smelting
Processing
Extrusion
Rolling
Casting
Recycling
Stage 1
Stage 1
-
-
refining
refining
Stage 2
Stage 2
-
-
smelting
smelting
Source: International Aluminum Institute.
Stage 1: Refining
Bauxite deposits are found mostly in the tropical and subtropical regions of the world (i.e.,
the Caribbean, Latin America, Australia, Asia, and Africa). Bauxite ore is typically
composed of 30-55% alumina and lesser amounts of iron, silicon, and titanium. As the
bauxite ore is easily extracted with shovels, mining is a relatively simple process, not
requiring significant blasting. (Bauxite ore is typically found close to or at the earth’s
surface, typically in softer earth).
The ore is then refined into alumina, typically using the Bayer process. In the first step of
this process, the bauxite is crushed and mixed with lime and hot caustic soda. This
solution is put through thickener tanks, resulting in a red mud mixture that sinks to the
13 January 2011
Metals & Mining Primer
6
bottom of the tank. The red mud is washed with water and disposed of in tailings dams,
while the solution is placed into a pressurized digester at high heat, filtered, and then
cooled. What is left is a white powder (slightly finer than table salt) called alumina.
Exhibit 2: Alumina Refinery Operations Flow Chart
Source: MetSoc.
Stage 2: Smelting
The primary method used in smelting aluminum uses the Hall-Heroult Process, discovered
and patented in 1886 and still used today. Fundamental components of a smelting
operation are the electrolytic cell (or pot, which is a steel shell lined with carbon, which
serves as the cathode) and the carbon electrodes that extend into the pot, which serve as
the anodes. In the process, electrical currents are passed through the molten alumina,
thereby removing the oxygen. This results in molten aluminum, which upon being gathered
from the bottom of the cell, is degassed to remove impurities and then cast into products
at the fabricating plants.
Exhibit 3: Aluminum Smelting Process
Source: MetSoc.
Soderberg Anode Cells versus Prebaked Anode Cells
There are two basic anodes used in aluminum smelters today: Soderberg anode cells and
prebaked anode cells. In general, the prebaked anode cells are primarily used in the
United States and are typically preferred over Soderberg cells, as they use less electricity,
are more efficient, and generally less pollutive than the Soderberg process. The majority of
new smelters use prebaked anode cells, with more than 80% of current smelters using
prebaked anodes.
13 January 2011
Metals & Mining Primer
7
Exhibit 4: Soderberg Cell Exhibit 5: Prebaked Cell
Source: International Aluminum Association.
Source: International Aluminum Association.
The key distinction in Soderberg technology is the anodes; the Soderberg technology uses
a continuous anode, which is delivered into the pot in the form of a paste that bakes into
the cell itself, while prebake technology uses a number of prebaked recyclable anodes that
are attached to rods and suspended within the cell.
Components of Production Costs
Aluminum smelting is a highly energy-intensive process, requiring approximately
13,000-15,000 kilowatt hours of electricity to make one tonne of aluminum. In terms of raw
materials, on average four to five tonnes of bauxite is required to make two tonnes of
alumina, while two tonnes of alumina is required to make one tonne of aluminum. As such,
the major costs associated with the smelting process are alumina, electricity, labor, and
other raw materials (including lime, caustic soda, and carbon pitch).
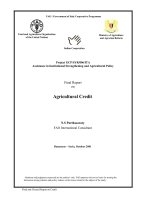
Exhibit 6: Alumina Refining Costs Exhibit 7: Aluminum Smelting Costs
Conversion, 36%
Fuel Oil, 14%
Natural Gas, 15%
Caustic , 10%
Bauxite, 25%
Conversion, 22%
Alumina, 36%
Carbon, 13%
Power, 26%
Materials, 3%
Source: Alcoa, Credit Suisse estimates. Source: Alcoa, Credit Suisse estimates.
Historically, alumina prices have been linked to the London Metals Exchange (LME) price
of aluminum, in general trading anywhere in the range of 14-16% of aluminum prices.
However, there is currently a push from alumina producers to de-link the price of alumina
so that it prices on its own supply and demand fundamentals. While this may take a
number of years to fully realize as multiyear alumina contracts slowly roll off, it should
13 January 2011
Metals & Mining Primer
8
push alumina prices up closer to $400/tonne, versus approximately $350/tonne were
prices to stay linked to LME aluminum.
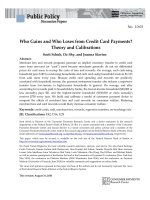
As of Q3 2010, the average cash cost of producing aluminum was approximately $0.82/lb,
with the top 15
th
percentile producing aluminum at $0.97/lb or higher (based on Wood
Mackenzie data).
Exhibit 8: Global Aluminum Smelter Cost Curve (Q3 2010)
$0.40
$0.50
$0.60
$0.70
$0.80
$0.90
$1.00
$1.10
$1.20
$1.30
Cumulative Production (Percentile)
C1 Cash Cost (US$/lb)
0 102030405060708090100
Source: Wood Mackenzie.
Recycling Process
Rather than producing aluminum from bauxite, recycling scrap aluminum is a significant
part of the downstream aluminum products industry. Roughly 30-35% of global aluminum
needs are satisfied through the recycling of aluminum. Recovering aluminum from used
aluminum appliances, cans, etc. is much cheaper and more sustainable than the
traditional route of producing the metal from ore. For example, recycling 1 kg of aluminum
saves up to 8 kg of bauxite, 4 kg of chemical products, and 14 kilowatt hours of electricity.
Recycling of aluminum products requires only 5% of the energy needed for primary
aluminum production.
Virtually all products made from aluminum have the ability to be recycled into the same
products for future use (i.e., beverage cans are recycled into new beverage cans, old
extruded window frames can be recycled to make new windows, etc.). The Aluminum
Association estimates that aluminum can recycling rates range anywhere from 25% to
more than 90%, depending on the country. Recycling rates for building and transport
applications range from 85% to 95% in various countries.
13 January 2011
Metals & Mining Primer
9
Global Supply
Bauxite
Guinea has the world’s largest bauxite reserves, with 27% of total reserves. This is
followed closely by Australia at 23% and Jamaica at 7%.
Exhibit 9: 2009 World Bauxite Reserves by Country (in 000s Tonnes)
Country Reserves* % of Total
GUINEA 7,400,000 27.4%
AUSTRALIA 6,200,000 23.0%
JAMAICA 2,000,000 7.4%
BRAZIL 1,900,000 7.0%
INDIA 770,000 2.9%
CHINA 750,000 2.8%
GUYANA 700,000 2.6%
GREECE 600,000 2.2%
SURINAME 580,000 2.1%
KAZAKHSTAN 360,000 1.3%
VENEZUELA 320,000 1.2%
RUSSIA 200,000 0.7%
UNITED STATES 20,000 0.1%
OTHER COUNTRIES 5,200,000 19.3%
TOTAL 27,000,000 100.0%
*Reserves refer to material that is economically viable at the time of determination. Source: USGS.
Alumina
Exhibit 10: Global Alumina Production (by Country)
8.1%
29.5%
7.0%
3.9%
8.0%
5.4%
6.8%
2.3%
2.6%
2.1%
30.5%
26.0%
11.1%
4.7%
3.9%
3.6%
2.3%
2.1%
2.0%
1.9%
0.0%
5.0%
10.0%
15.0%
20.0%
25.0%
30.0%
CH
IN
A
AUSTR
A
LIA
B
R
AZI
L
IN
DIA
USA
R
US
SI
A
JAMAI
C
A
K
AZ
AK
H
ST
AN
U
K
RA
IN
E
SPAIN
2000 2009
Source: Wood Mackenzie.
To support its growth in primary aluminum smelting, China has quickly increased its
alumina production and recently surpassed Australia as the world’s largest alumina
producer, despite its relatively small amount of bauxite reserves (just 2.8% of global
reserves). China’s alumina production has increased almost 450% since 2000.
13 January 2011
Metals & Mining Primer
10
Exhibit 11: China Domestic Alumina Production versus Consumption (000’s tonnes)
2000 2001 2002 2003 2004 2005 2006 2007 2008 2009
Domestic alumina production
4,339 4,733 5,480 6,180 6,985 8,536 13,740 20,900 25,137 23,792
Alumina requirements*
5,682 6,742 8,766 11,094 13,378 15,612 18,698 25,176 26,354 25,930
Aluminum production
2,841 3,371 4,383 5,547 6,689 7,806 9,349 12,588 13,177 12,965
Alumina surplus/(deficit)
(1,343) (2,009) (3,286) (4,914) (6,393) (7,076) (4,958) (4,276) (1,217) (2,138)
*Alumina needs based on two tonnes of alumina required per one tonne of aluminum production.
Source: Wood Mackenzie.
Exhibit 12: Percentage of Global Alumina Supply
0%
5%
10%
15%
20%
25%
30%
35%
2000 2001 2002 2003 2004 2005 2006 2007 2008 2009
% of global production
CHINA AUSTRALIA
Source: Wood Mackenzie.
Primary Aluminum
Exhibit 13: Global Primary Aluminum Production (by Country)
11.6%
13.2%
9.8%
15.0%
7.2%
5.2%
4.2%
2.6%
2.2%
2.1%
34.0%
10.0%
7.9%
4.5%
5.1%
4.0%
2.9%
3.9%
2.4%
2.2%
0.0%
5.0%
10.0%
15.0%
20.0%
25.0%
30.0%
35.0%
40.0%
CHINA RUSSIA CANADA USA AUSTRALIA BRAZIL NORWAY INDIA DUBAI BAHRAIN
% of global smelting capacity
2000 2009
Source: Wood Mackenzie.
Given the high cost of electricity among most of the Western World, aluminum production
has been gradually shifting away from the United States and Western Europe and into
emerging regions such as India, Dubai, and Bahrain, to name a few. The exception to this
is China, where aluminum production has been ramping up significantly in the past decade
to keep up with the tremendous growth in metals demand, driven by the industrialization of
the country. China is now the world’s largest aluminum producer, with roughly 34% of total
global production, versus only 11.6% in 2000.
13 January 2011
Metals & Mining Primer
11
Exhibit 14: Top Ten Primary Aluminum Producers (2009)
9.8%
9.1%
8.8%
8.3%
3.3%
3.0%
2.7%
2.1%
1.7%
1.5%
0.0%
2.0%
4.0%
6.0%
8.0%
10.0%
12.0%
UC Rusal Rio Tinto Chalco Alcoa Hydro Aluminium BHP Billiton Dubal Alba East Hope Yichuan Electrical
% of 2007 global production
Source: Wood Mackenzie.
After significant consolidation among the top producers in 2006-07, approximately 36% of
the global supply of primary aluminum is controlled by four producers: Alcoa, Rusal, Rio
Tinto, and Chalco. China accounts for 34% of global output and has three of the top ten
global producers.
Global Consumption
Exhibit 15: Global Primary Aluminum Consumption (by Country)
13.4%
24.9%
8.8%
6.5%
2.4%
3.3%
3.0%
2.0%
3.1%
3.2%
4.5%
39.1%
11.6%
4.7%
4.2%
2.9%
2.4%
2.2%
2.1%
1.6%
0.0%
5.0%
10.0%
15.0%
20.0%
25.0%
30.0%
35.0%
40.0%
45.0%
CHINA USA JAPAN GERMANY INDIA SOUTH KOREA RUSSIA BRAZIL ITALY CANADA
% of global demand
2000 2009
Source: Wood Mackenzie.
Since 2000, the industrialization of China has resulted in a secular shift in the percentage
of global metals demand away from the Western World and into the Far East. China is
now the largest consumer of base metals, accounting for 39% of aluminum demand in
2009, with the United States falling to second at roughly 12% of total demand.
13 January 2011
Metals & Mining Primer
12
Exhibit 16: North American Aluminum Demand by End Market (2009)
2009
Construction
13%
Transport
30%
Electrical
9%
Packaging
29%
Consumer
Goods
7%
Machinery &
Equipment
8%
Other
4%
Source: Wood Mackenzie.
Transportation and packaging are the two primary end markets for aluminum. In North
America, these two end markets account for almost 60% of aluminum demand, while
construction and electrical make up another 22% of end-market demand.
13 January 2011
Metals & Mining Primer
13
Copper
Copper, from the Greek word kyprios, is one of the oldest metals known to civilization. In
fact, the earliest recorded existence of known copper is around 9000 BC. However, the
glorious period for copper began in the Bronze Age (possibly as early as 3900 BC), when
copper was mixed with tin to create bronze, which then became heavily used in
applications from construction to the production of weapons, tools, and castings. Since
then, the use of copper has increased significantly and is found in a vast range of
applications ranging from brass musical instruments to electrical wiring, electric dynamos,
and solar cells.
Copper concentrate generally contains 25-30% copper and is the resulting product of mine
ore (which typically contains less than 1% copper) once the mined ore has been crushed,
milled, and concentrated. The concentrate is typically further refined and formed into
cathodes, which are typically up to 99.9% pure copper, weighing up to 300 pounds. These
cathodes are then shipped to mills or foundries to be formed into one of the following
forms: (1) wire rod, (2) billet, (3) cake, or (4) ingot. Copper is also combined with other
metals to form copper alloys, which include bronze (copper and tin), brass (copper and
zinc), and copper/nickel alloys.
Properties of Copper
Exhibit 17: Properties of Copper
Source: ICSG.
Corrosion resistance. Copper is resistant to weather, common atmospheric gases, and
liquids, holding up much better than other products, such as iron. For example, the Statue
of Liberty is made of roughly 81 tonnes of copper, with no corrosion from a century of
exposure to the elements. (The light green color is a result of the natural weathering of the
exterior copper covering.)
Conductivity. Copper is one of the best heat and electricity conductors among the metals
(only silver is a better conductor of electricity), with roughly two-thirds higher conductivity
than aluminum, although it has a much greater density. Thus, it is primarily used in power
transmission lines and towers, as well as in lower-voltage applications, such as
appliances.
Periodic table symbol: Cu
A
tomic number: 29
13 January 2011
Metals & Mining Primer
14
Ductile and malleable. Copper is easily molded, shaped, and drawn into various forms,
making it easy to use in a wide number of applications.
Strong and recyclable. Copper is a highly recyclable metal, with an infinite recyclable life
and properties that allow for the recycling of all forms of copper (melting point at 1,356
degrees Celsius), whether in its pure state or as a copper alloy (brass, bronze, etc.). As
such, copper scrap retains a high percentage of its value. While making up only 18% of
global refined copper supplies in 2009, copper recycling is of significant importance in the
United States, where approximately 30% of total U.S. copper supplies come from recycled
copper.
Uses of Copper
Construction (includes electrical). Copper is used in a wide variety of construction
applications, including plumbing, kitchen and bathroom fixtures such as taps, tubes, and
fittings, heating fixtures, electrical wiring and outlets, air conditioning, and roofing. Overall,
the Copper Development Association estimates that an average American home contains
roughly 400 pounds of copper. Copper’s high conductivity has made it the primary choice
for use in power cables, transformers, building wire, and motors.
Electronics and communication. Copper is a significant raw material in electronics and
telecommunications, including computers in the form of computer chips, electron tubes,
data cables, and telephone wire.
Transportation. Copper is found in automobiles, usually as a copper/nickel alloy in
applications such as radiators and hydraulic brakes, in addition to electrical wiring. In
marine applications, copper is frequently combined with nickel to create copper/nickel
alloys used for ship hulls, offshore units, desalination plants, etc., primarily owing to its
resistance to seawater corrosion.
Industrial machinery and equipment. Copper is used heavily in industrial applications as
an alloy, most commonly combined with tin to form bronze. Some uses include motors and
wiring, heat exchangers, turbine blades, and natural gas pipes.
Consumer goods. Copper is found in a variety of consumer products as well, including
microwave ovens, TV cathode rays, brass furniture and musical instruments, silverware,
and coins. (Pennies are only 2.5% copper, 97.5% zinc. Nickels are actually 75% copper,
while the dime, quarter, and half dollar coins contain 91.67% copper.)
Substitutability. Given the large number of similarities in physical properties (conductivity,
anticorrosiveness), aluminum is commonly mentioned as a potential substitute for copper
in a number of applications, including electrical wiring and home appliances. Plastics have
also replaced copper in plumbing applications.
13 January 2011
Metals & Mining Primer
15
Primary Production Process
Copper ores are typically found in two forms: sulfides (roughly 80% of global copper ores)
and oxides. The type of ore will dictate the method of processing, as oxide ores are
typically processed using Leaching and Electrowinning (SX/EW), while sulfide ores are
generally processed though smelting and refining.
A typical copper ore contains as little as 0.5-2.0% copper.
(For an animated process flow diagram provided by Minera Escondida, click the link:
/>)
Mining Methods
Copper is typically mined via either an open pit or an underground mine.
Open Pit Mining
As the name implies, open pit mining is used when the ore body is near the surface. In
open pit mining, the surface layer of waste rock covering the ore is removed. This exposes
the ore body, which can then be easily extracted.
Underground Mining
When the ore is further below the surface, underground mining is utilized. Underground
mining typically involves digging a vertical shaft into the earth up to some depth and then
digging horizontal tunnels into the ore body. Given the infrastructure and equipment
involved, underground copper mining is typically more expensive than open pit mining,
although higher-grade material is often found at depth, which mitigates the relative cost
disadvantage of underground mining.
Processing
After the ore has been mined, it needs to be processed to obtain refined copper. There are
primarily two broad routes of producing copper from copper ore: (1) the pyrometallurgical
route and (2) the hydrometallurgical route. As the names suggest, the pyrometallurgical
route involves very high temperature smelting, while the hydrometallurgical route works
with aqueous solutions. The pyrometallurgical route currently accounts for roughly 75% of
world copper production from copper ores.
Copper Production by the Pyrometallurgical Route (Smelting and Refining)
In the pyrometallurgical route (which is not typically used for oxide ores), the ore is first
crushed and ground to a fine powder. This powder is mixed with water to form slurry. Certain
chemicals that coat the copper minerals are added to the slurry and air is passed through the
material. The rising bubbles capture the coated mineral particles and float them to the
surface (froth-flotation process). The floating mineral is then skimmed and dried. This dried
material is called copper concentrate and typically contains about 25-35% copper and a
similar quantity of sulfur (the percentages vary depending on the ore that is used).
The concentrate is passed through a series of high-temperature processes of roasting and
smelting. These processes essentially oxidize the sulfur and other impurities in the ore and
produce copper of about 99.0% purity. This copper often contains trapped gases (mainly
sulfur dioxide). As the molten copper cools, these gases escape and make
blister-like marks on the surface of the metal. This metal is called blister copper.
Although 99.0% purity is a great improvement from the original grade of about 1% copper in
the ore, it is not good enough. Even 1% of impurities in copper can significantly deteriorate
its conductivity and other properties. Copper needs to be refined further through
electrorefining. In electrorefining, 99.0% purity copper (anode) is immersed in an acid bath.
As electric current is passed through the solution, two simultaneous processes take place. At
the anode, copper dissolves into the solution, while at the cathode, pure copper is deposited.
This results in more than 99.9% pure copper deposited at the cathode.
13 January 2011
Metals & Mining Primer
16
This whole process results in significant sulfur dioxide generation. (The process produces
more sulfur dioxide by weight than the copper it produces.) In the past, this gas used to be
dumped into the environment. But in the current regulatory environment, that is often not
possible. Therefore, most of this sulfur dioxide is converted into sulfuric acid. The acid thus
produced can either be used as a leaching agent in a related hydrometallurgical process
(described later) or sold (at times at a loss because the price of sulfuric acid may not cover
even transportation costs from remote mining locations to the nearest market).
Copper Production by the Hydrometallurgical Route (Leaching and Electrowinning,
or SX/EW)
The first step in the hydrometallurgical route involves leaching the ore. Leaching
essentially means dissolution of the copper ore in sulfuric acid. (Bacterial and alkaline
solutions can also be used in some cases.) Acidic leaching is typically the most effective
for oxide ores. Sulfide ores are typically first oxidized by bacterial leaching. The leaching
process (especially bacterial leaching) can be extremely slow and may take months or
even years if not modified. Using smaller crushed ore particles, more concentrated acid,
higher temperature, and pressure are some of the methods typically used to accelerate
the process. However, these modifications may significantly increase the cost of
production.
Leaching of ore results in a copper sulfate solution (with other impurities), which is then
contacted with an organic solvent in the solvent extraction (SX) stage. In the SX stage,
copper is extracted from the aqueous solution, and most of the other impurities remain in
the leach solution. A strong acidic solution is used to strip the copper from the organic
solvent.
The resultant purer copper sulfate solution goes to the electrowinning (EW) stage, where it
is electrochemically purified. The pure copper forms at the cathode, and it is as pure or
purer than copper produced by electrorefining of blister copper. The hydrometallurgical
route of producing copper is more environmentally friendly, uses less energy, and can be
used with ores with much lower grades. The process is less capital intensive than the
pyrometallurgical route and hence can be used when the ore body is not big enough to
justify the capital costs of the smelting route. However, recovery rates of copper for
SX/EW are typically lower when compared with the smelting/refining method, which is
offset by the fact that the SX/EW process is typically lower cost.
13 January 2011
Metals & Mining Primer
17
Production Costs
As of Q3 2010, the average cash cost of producing copper was approximately $0.93/lb,
with the highest 10% of global supplies produced at $1.55/lb or higher (based on Wood
Mackenzie cost data). The direct costs of mining are broken out in Exhibit 19 . Labor
accounts for approximately 21% of total mining costs on a global basis, while fuel and
electricity account for approximately 15% of production costs in total.
Exhibit 18: 2010 Global Cost Curve Exhibit 19: Copper Mine Site Production Costs by Type
(2010E)
-50
-30
-10
10
30
50
70
90
110
130
150
170
190
210
230
250
270
290
Cumulative Production (Percentile Paid Mlbs Cu)
C1 Cash Cost (c/lb Paid Cu)
0 102030405060708090100
Labor, 21.1%
Electricity, 14.9%
Fuel, 6.1%
Stores, 33.3%
Services & Other,
24.5%
Source: Wood Mackenzie, Credit Suisse estimates. Source: Wood Mackenzie, Credit Suisse estimates.
Stores includes items such as spare parts and consumables, while
Services covers costs such as water, drilling, security, and
food/housing.
Global Supply
Major Copper Producers
Copper is a high value-by-weight metal (compared with steel), and hence it is
economically transportable, with essentially a global supply chain. Since the average
grade of copper ore is approximately 1%, it is uneconomical to transport the ore without
processing. Typically, the ore is processed and converted into concentrate near the mine
site; however, copper concentrate is also traded widely through spot and contract markets.
A large number of producers have surplus mining capacity, as compared with smelting
capacity. For example, Codelco, the world’s largest copper miner, has smelting capacity
for roughly 65% of its 2010 mine production.
An interesting dichotomy in the copper industry lies in the fact that the mining companies
control a large proportion of the resources, while many smelters are standalone entities
without access to the copper ores. Further, the cost involved in mining and concentration
of the ores is significantly higher than the cost of smelting and refining the ores. Given the
separation of ownership between the miners and the smelters, treatment and refining
charges (TC/RC’s) paid by the miner to the smelters are typically negotiated annually.
These annual smelting and processing fee agreements are often viewed as an indicator of
the relative availability of upstream mine supply, with low smelting fees typically indicating
tight supplies of concentrates available to the smelters.
Exhibit 20 and Exhibit 21 display the major miners and smelters in the copper market.
13 January 2011
Metals & Mining Primer
18
Exhibit 20: Top 10 Copper Miners (2010E)
8.7%
6.8%
5.6%
4.2%
4.2%
2.7%
2.6%
2.6%
2.2%
10.8%
0.0%
2.0%
4.0%
6.0%
8.0%
10.0%
12.0%
Codelco F-McM Copper &
Gold
BHP Billiton Xstrata AG Anglo American
plc
Rio Tinto Southern Copper
(ex SPCC)
KGHM Polska
Miedz
RAO Norilsk Antofagasta plc
% of global copper production
Source: Wood Mackenzie, Credit Suisse estimates.
Chilean state-owned copper producer Codelco is the world’s largest copper miner, with
roughly 10%-plus of global copper production. The merger between Freeport-McMoRan
Copper & Gold and Phelps Dodge created the world’s second largest copper producer,
accounting for approximately 9% of global supplies.
Exhibit 21: Top Ten Copper Smelters (2010E)
7.5%
6.1%
5.0%
4.6%
4.2%
3.5%
3.4%
3.4%
3.4%
2.8%
0.0%
1.0%
2.0%
3.0%
4.0%
5.0%
6.0%
7.0%
8.0%
Codelco Jiangxi Copper
Company
Xstrata AG Aurubis Nippon Mining
and Metals
F-McM Copper &
Gold
KGHM Polska
Miedz
Sumitomo Metal
Mining
Mitsubishi
Materials
Southern Copper
(ex SPCC)
% of global mine supply
Source: Wood Mackenzie, Credit Suisse estimates.
Roughly one-half of the top players in the smelting and refining business are not among
the top copper miners, as marginal value creation and low margins make the smelting
business less attractive for miners. As such, smelters tend to be located close to their end
markets or in areas with lower relative power costs.
13 January 2011
Metals & Mining Primer
19
Major Producing Regions
Exhibit 22: Global Copper Mine Supply (by Country)
35.2%
4.1%
11.0%
4.3%
7.6%
6.2%
4.2%
2.1%
4.8%
3.2%
6.6%
2.9%
3.0%
4.3%
4.4%
5.3%
6.2%
7.5%
7.7%
34.1%
0.0%
5.0%
10.0%
15.0%
20.0%
25.0%
30.0%
35.0%
40.0%
CHILE PERU USA CHINA INDONESIA AUSTRALIA RUSSIA ZAMBIA CANADA Kazakhstan
% of global mine supply
2000 2009
Source: Wood Mackenzie, Credit Suisse estimates.
Chile remains the dominant copper-producing nation, accounting for approximately 34% of
global mine supply. As can be seen in Exhibit 23: Top Global Copper Mines (2009), Chile
has five of the top ten largest mines globally.
We expect a gradual regional shift away from current mining areas to newer regions where
the bulk of exploration and development is concentrated, including the Democratic
Republic of the Congo, Zambia, and Mongolia.
Exhibit 23: Top Global Copper Mines (2009)
Source: Reuters.
13 January 2011
Metals & Mining Primer
20
Exhibit 24: 2009 World Copper Reserves by Country (in 000s tonnes)
Reserves* % of Total
CHILE 160,000 29.6%
PERU 63,000 11.7%
MEXICO 38,000 7.0%
UNITED STATES 35,000 6.5%
INDONESIA 31,000 5.7%
CHINA 30,000 5.6%
POLAND 26,000 4.8%
AUSTRALIA 24,000 4.4%
RUSSIA 20,000 3.7%
ZAMBIA 19,000 3.5%
KAZAKHSTAN 18,000 3.3%
CANADA 8,000 1.5%
OTHER COUNTRIES 68,000 12.6%
TOTAL 540,000 100.0%
*Reserves refer to material that is economically viable at the time of determination. Source:USGS.
The biggest reserves of copper globally are located in Chile, Peru, Mexico, and the United
States, with the development of emerging regions such as Mongolia and the Congo
increasing in importance. Chile has the world’s largest copper reserves, accounting for
almost 30% of the world’s total economic reserves. This dwarfs the United States, which
has the fourth largest reserves at 6.5%.
Exhibit 25: Global Refined Copper Supply (by Country)
9.2%
17.9%
9.7%
12.1%
5.7%
1.8%
4.8%
3.2%
1.7%
3.3%
6.4%
22.4%
17.9%
7.9%
4.7%
3.9%
3.7%
2.9%
2.8%
2.7%
0.0%
5.0%
10.0%
15.0%
20.0%
25.0%
CHINA CHILE JAPAN USA RUSSIA INDIA GERMANY SOUTH KOREA ZAMBIA POLAND
% of global mine supply
2000 2009
Source: Wood Mackenzie, Credit Suisse estimates.
While Chile still refines a substantial portion of the world’s copper (given its predominance
as the world’s largest copper miner), refined copper production is sourced closer to the
end markets, with China now the largest producer of refined copper globally. This is
primarily driven by the economics; i.e., it is feasible to transport copper concentrates from
distant mine locations to the smelters, while adding only a small amount to the landed
cost. This makes it possible for the smelters and refiners to be located closer to the end
consumers. As such, Chinese smelting capacity has more than doubled over the past
decade, while that of the United States has fallen by approximately 45%, with the focus of
the smelting operations having shifted over the past decade from the Americas to Asia.
13 January 2011
Metals & Mining Primer
21
Breakdown of Global Supply
Exhibit 26: Makeup of Global Copper Supply (000’s tonnes)
Refined Ore
Concentrate
Scrap
SX/EW
-
2,000
4,000
6,000
8,000
10,000
12,000
14,000
16,000
18,000
20,000
1990 1991 1992 1993 1994 1995 1996 1997 1998 1999 2000 2001 2002 2003 2004 2005 2006 2007 2008 2009
Source: Wood Mackenzie, Credit Suisse estimates.
While refined ore still accounts for the bulk of global copper supplies (83%), SX/EW-based
copper production (which accounts for 17% of global copper supplies) has been the
fastest growing source of copper supplies, increasing by an average of almost 10% per
year since 1990, versus average annual growth of 2% for refined ores (although SX/EW
growth has dropped to an average of 4% since 2000, versus 2% for refined ores over the
same period).
Global Consumption
Differences in Copper Demand among Regions
Exhibit 27: Copper Consumption in the United States Exhibit 28: Copper Consumption in China
Building
Construction
49%
Electronics and
Communication
20%
Industrial
Machinery &
Equipment
9%
Transportation
11%
Consumer Goods
11%
Building
Construction
26%
Electronics and
Communication
42%
Industrial
Machinery &
Equipment
9%
Transportation
13%
Consumer Goods
10%
Source: Wood Mackenzie.
Source: Wood Mackenzie.
Globally, the major end markets for copper have been construction and electronics,
accounting for more than 60% of the global copper demand. However, regional variations
in the end use of copper continue to exist. For instance, in the United States, 49% of
copper consumption is by the construction sector, whereas in China the dominant use for
copper is in the electronics and communication sector, which takes 42% of total copper
consumption.
13 January 2011
Metals & Mining Primer
22
Copper Consumption by Region
Exhibit 29: Global Copper Consumption (by Country)
12.2%
19.8%
8.6%
8.9%
5.7%
1.9%
4.4%
4.1%
1.3%
2.2%
37.7%
9.4%
6.6%
5.1%
4.5%
3.2%
3.0%
2.9%
1.9%
1.9%
0.0%
5.0%
10.0%
15.0%
20.0%
25.0%
30.0%
35.0%
40.0%
CHINA USA GERMANY JAPAN SOUTH KOREA INDIA ITALY TAIWAN RUSSIA Brazil
% of global copper demand
2000 2009
Source: Wood Mackenzie, Credit Suisse estimates.
China is the leading copper-consuming nation in the world, accounting for approximately
37.7% of global demand, higher than the United States (9.4%).
Global Trade in Copper
Exhibit 30: Trade Flow of Copper Ores and Concentrate
Source: International Copper Study Group 2010 Factbook.
The global trade in copper can be divided into trade in concentrates and trade in the metal.
While concentrate flows originate in the Latin American countries (Chile and Peru) and
North America, the copper metal trade flows are dominated mainly by exports to Asia.
Regions with a copper surplus such as the Commonwealth of Independent States (CIS,
formerly the U.S.S.R.), North America, and Latin America export copper in large quantities
to the copper-short Asia region.
13 January 2011
Metals & Mining Primer
23
Nickel
Nickel, discovered in 1751, is a lustrous, silvery white metal. Nickel is common and widely
distributed. On average, the earth’s crust contains just about 0.0075% nickel. Taking the
entire earth into consideration (including the mantle and core along with the crust), nickel
is the fifth most common element. Nickel’s economic utility lies not in its standalone usage,
but in its excellent alloying characteristics.
Properties and Uses
Nickel has a melting point of 1,453 degrees Celsius, moderate thermal and electrical
conductivity, high resistance to corrosion and oxidation, and high strength and toughness
even at higher temperatures. It is the properties of corrosion, temperature resistance, and
high strength that make nickel a highly valuable addition in many alloys. Reflecting these
qualities, nickel is widely used in a variety of products ranging from consumer, industrial,
military, transport/aerospace, and marine to architectural applications. The public may
recognize nickel in coins, as it is used for this purpose in pure or alloy forms by many
countries, or as bright and durable electrolytically applied coatings on steel (nickel plating).
The biggest use, however, is as an alloying metal along with chromium and other metals in
the production of stainless and heat-resisting steels. These are mostly used in industry
and construction, but also for products in the home such as pots and pans and kitchen
sinks.
Approximately 65% of nickel is used for manufacturing stainless steel, and another 22% is
used to manufacture other ferrous and nonferrous alloys (including super alloys), which
are used for various specialty applications. About 9% is used in plating and 6% in other
uses, including coins and a variety of nickel chemicals.
Nickel processed directly from mineral deposits is referred to as primary nickel, while
nickel that has been previously used in consumer and industrial applications is called
secondary nickel. Most of the nickel recycled is in the form of nickel-bearing stainless
steel. Nickel’s resistance to corrosion, high strength over a wide temperature range,
pleasing appearance, and suitability as an alloying agent make it useful in a wide variety of
applications.
There are several grades of stainless steel, each with slightly different properties and alloy
content. The main alloying element in stainless steel is chromium that provides basic
corrosion resistance. Stainless steel is defined as steel containing a minimum of 10%
chromium. The various types may be subdivided into four main groups: ferritic, austenitic,
martensitic, and duplex stainless steels.
Periodic table symbol: Ni
A
tomic number: 28
13 January 2011
Metals & Mining Primer
24
Exhibit 31: Types of Stainless Steel
Grade UNS No. Family Cr
c
Ni
c
Mo
c
N
c
C(max) Other
c
PRE
c, e
Yi
e
ld
strength
MPa
(min)
b
Tensile
strength
MPa
(min)
b
Elong %
(min)
b
430 S43000 ferritic 17 0.12 17 205 450 22
420 S42000
martensiti
c 13 0.15 min 13 1480
c
1720 8
c
304 S30400 austenitic 18 9 0.08 18 205 515 40
760 1035 7
304L S30403 austenitic 18 9 0.03 18 170 485 40
316 S31600 austenitic 17 11 2.1 0.08 24 205 515 40
316L S31603 austenitic 17 11 2.1 0.03 24 170 485 40
904L N08904 austenitic 20 25 4.5 0.02 1.5Cu 35 220 490 35
S31803
S32205
17-4PH S17400
precipitati
on
hardening 16 4 0.07 4Cu 0.3Nb 16 1170 1310 10-May
Alloy 254 S31254
super
d
austenitic 20 18 6 0.2 0.02 0.75Cu 43 300 650 35
Alloy 2507 S32750
super
d
duplex 25 7 4 0.28 0.03 42 550 795 15
d
The term "super" is commonly used when the PRE number of the alloy is 40 or more
e
PRE = Pitting Resistance Equivalent (see text)
b
Annealed condition except for grades 420 and 17-4PH which have been heat treated and 304 ½ hard which has been cold worked, the intention in
each case being to increase strength and hardness
c
Typical values
450 620 25
a
0.2% proof stress
304 ½ hard
2205 duplex 22 5 3 0.15 0.03 34
Source: AISI, Credit Suisse estimates.
Ferritic stainless steels, which represent 22-25% of total stainless steel production, contain
little or no nickel. These stainless steels have fair to good corrosion resistance, particularly
to chloride stress corrosion cracking. They are magnetic and are not hardened by heat
treatment.
Austenitic grades represent about 74% of total world stainless steel production. The most
commonly used austenitic grade of stainless steel is grade 304, which contains 8.0-10.5%
nickel and 18-20% chromium and is frequently referred to as 18/8 grade. There are a
variety of variations of grade 304 that have been developed for more specialized
applications. These variations may involve the specification of lower carbon content or the
addition of other alloying elements such as copper or titanium. Variations of grade 304
may be used in a wide range of applications, from cutlery to pharmaceutical plant
equipment. In more aggressive environments, such as acids or seawater, higher corrosion
resistance is required.
Primary Production Process
Nickel occurs in nature principally as oxides, sulfides, and silicates. Ores of nickel are
mined in about 20 countries on all continents and are smelted or refined in about 25
countries. Primary nickel is produced and used in the form of ferronickel, nickel oxides and
other chemicals, and as more or less pure nickel metal. Nickel is also readily recycled in
many of its applications, and large tonnages of secondary or scrap nickel are used to
supplement newly mined metal.
The primary extraction processes can be simply defined as the processes that receive
nickel concentrate or prepared ore to produce final metal products, ferronickel, and nickel
oxide, as well as intermediate products such as matte and liquor.
Primary nickel extraction is carried out by two main methods:
■ Pyrometallurgical methods: typically used with sulfides
■ Hydrometallurgical methods: typically used with laterites
Nickel ores can be broadly classified into two types: sulfide ores, which are predominantly
extracted through underground mining, and lateritic hydrous ores, which are mainly
surface mined. Pentlandite (NiFe) is the principal sulfide nickel ore, and it often occurs
13 January 2011
Metals & Mining Primer
25
along with iron and copper deposits. Limonite and garnierite are the major lateritic ores
and contain elements such as iron, magnesium, and silica.
Exhibit 32: Total Nickel Production (Sulphides versus Laterites)
0
200
400
600
800
1000
1200
1400
1999 2000 2001 2002 2003 2004 2005 2006 2007 2008 2009 2010 2011 2012 2013 2014 2015 2016
Sulphides
Laterites
Source: Brook Hunt, Credit Suisse estimates.
Nickel sulfides are treated primarily by pyrometallurgy. For most of the sulfide ores, a part
of the refining and smelting process is devoted to separation of copper and iron from
nickel. Ore is concentrated through physical means, which includes floatation and
magnetic separation. A process of roasting, smelting, and converting is used to remove
sulfur and iron from sulfide ores. After roasting, the nickel matte consists primarily of nickel
subsulfides. Depending upon the final need, the matte is processed further. For example,
nickel sulfides can be roasted to yield nickel oxide, which can be used directly in steel
production; alternatively, electrochemical, carbonyl process, or pyrometallurgical refining
kiln reduction can be used to extract refined nickel.
Lateritic ores are not very amenable to physical concentration, and these ores are
concentrated through a chemical leaching process. Nickel ores typically have an initial
concentration of 1-3%. Lateritic ores can be processed through both the
hydrometallurgical and pyrometallurgical routes.
Pyrometallurgical smelting of nickel oxide ores typically poses design and operational
challenges, including the requirement of a large amount of energy. Instead, sulfur is
generally blended with the oxide furnace product to produce iron-nickel matte. The
smelting process is used to further yield a ferronickel alloy, which contains less than 50%
nickel content and can be used directly in steel making.
Hydrometallurgy of oxidic ores involves process routes to produce nickel cobalt liquor or
nickel cobalt sulfide. Nickel cobalt liquor is produced by drying and grinding, reducing, and
then leaching (with ammonia) an oxidic concentrate. Nickel cobalt liquor can then either be
precipitated by sulfiding, or the nickel and cobalt can be separated by solvent extraction,
which is then further processed by electrowinning into refined nickel.
Hydrometallurgy has been used to extract nickel for many years, but it has only been since
the mid-1990s that successful acid oxidative hydrometallurgical technology has been
developed for a wide range of nickel reserves. In 1998, three manufacturers started
facilities in Australia for hydrometallurgical processing of nickel ore through pressure