commodities primer Boom, Bust, Re-adjust rbs (2009)
Bạn đang xem bản rút gọn của tài liệu. Xem và tải ngay bản đầy đủ của tài liệu tại đây (1.35 MB, 166 trang )
1 October 2009
Quarterl
y
Commodit
y
Companion
Nick Moore
Head of Commodity Strategy
Stephen Briggs
Commodity Strategy
Daniel Major
Commodity Analyst
Jacques Cailloux
Chief European Economist
Brison Bickerton
Oil and Gas Analyst
Warren Edney
Mining Equity Analyst
www.rbsm.com/strategy
www.rbssempra.com
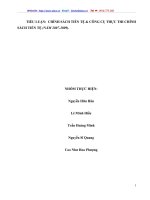
Source: Bloomberg, LME and RBS
Trade-weighted US dollar index vs the RBS Base Metal Price Index. The
weaker US dollar has breathed fresh life into metals.
70
110
150
190
230
Sep-07 Mar-08 Sep-08 Mar-09 Sep-09
70
75
80
85
90
RBS Base Metal Price Index (lhs) US Dollar Index (rhs)
Boom, Bust, Re-adjust
“There is a tide in the affairs of men, which, taken at the flood, leads on to
fortune; omitted, all the voyage of their life is bound in shallows and in
miseries. On such a full sea are we now afloat, and we must take the current
when it serves, or lose our ventures.” Shakespeare’s Julius Caesar
Commodities from zero to hero in just nine months
Commodities have gone from investment pariah to the ’darling of the diggin’s’ in
just nine months. Economies exiting recession, a sharply weaker US dollar and
the return of the consumer augur well for commodity prices. The RBS Base Metal
Price Index since its December 2008 nadir has risen 70%. Precious metals have
set hearts aflutter with gold recapturing the US$1,000/oz marker. Other
heavyweights such as oil, iron ore, coal and natural gas are also on the move.
It is now essential for real demand growth to take up the baton
We are now seeing the dismantling of the temporary bridges across the
recession, which included monetary and fiscal stimulus, hefty supply cutbacks,
Chinese commodity stockpiling and various ‘cash-for-clunkers’ schemes. It is
crucial for the delicate tendrils of real demand growth to become robust.
Watch out for the price relapse before sunny uplands come into focus
The world recession is over and we forecast world GDP growth will rebound by
3.6% in 2010. Commodity prices are now likely to pause for breath after their
strong rallies. Price-induced reactivation and the end to Chinese stockpiling will
likely temper pricing tension, but post 1H 11, markets look more robust. Stay with
precious metals, where platinum and palladium will likely outperform silver and
gold. Base metals are led by copper, lead-zinc then aluminium, with nickel least
favoured. Bulk commodities iron ore, thermal and coking coal and uranium are
stirring from their slumbers and should not be overlooked. Oil has risen, but has
struggled to maintain traction; 2010 should see a firmer tone as demand returns.
Natural gas looks to have bottomed and faces much improved prices ahead.
This material should be regarded as a
marketing communication and may have
been produced in conjunction with the RBS
trading desks that trade as principal in the
instruments mentioned herein.
The Royal Bank of Scotland
Quarterly Commodity Companion | 1 October 2009
2
Companion contents
Commodities in a nutshell 3
Commodity positioning 6
Overview – Boom, bust, re-adjust 7
Commodity price forecasts - 2009-13F 20
Economic focus – No straight line to sustained expansion 23
Economics – China special – The euphoria will fade 32
Commodity reviews
Industrial/base metals
Aluminium – Economically geared metal faces huge challenges 34
Copper – Remains our most favoured base metal 42
Nickel – Back from the abyss - but too fast too early? 51
Zinc – Middle order batsman biding its time 59
Lead – Destined for even greater glory 65
Tin – This laggard should start catching up in 2010 70
Precious metals
Gold – Agnostics become believers – well done gold! 72
Silver – Partying to the hilt 81
Platinum and palladium – PGMs comfortably eclipse gold 84
Bulk commodities
Iron ore – Structural change in iron ore 91
Coal – No return to previous price lows 100
Energy
Crude oil – Looking for Q4 09 economic recovery 111
US natural gas – Prompt prices have likely bottomed 117
Uranium – Uranium demand is on the rise 120
Quant analytics
Commodity & FX relationships – Currencies predict commodity prices 128
Commodity Companion appendix
Guide to everyday uses for commodities 131
A simple guide to commodity indices 134
Commodity indices – negative roll reduces returns 138
Precious metal ETFs – stabilisation 140
World’s top commodity producers and consumers 142
Global refined base & precious metal production and consumption 154
World’s top 50 central bank gold holdings 159
30-year real and nominal base and precious metal prices 160
Glossary of useful mining and industry websites 163
We thank our colleagues across asset classes for their invaluable contributions
to this Commodity Companion.
The Royal Bank of Scotland
Quarterly Commodity Companion | 1 October 2009
3
Commodities in a nutshell
Aluminium (transport, packaging, construction)
Aluminium’s price recovery from the lows has been the most
muted among the base metals. It may well have the
greatest upside potential from current price levels in the
longer term but we take a broadly neutral stance for 2010.
Aluminium is economically geared and we expect demand
growth of 10% pa in 2010-11. But nearly half the producer
cutbacks of ~7mtpa have already been unwound and we
forecast that the market will remain in surplus in 2010.
However, industry stocks are very low and we expect the
market to be tightening rapidly by 2012. We forecast that
the aluminium price will top US$3,000/t in 2013.
RBS aluminium price forecasts
Current 2008 2009F 2010F 2011F 2012F 2013F LT
US¢/lb
84
117 75 90 100 115 130 110
US$/t
1,850
2,571 1,645 2,000 2,200 2,525 2,875 2,425
Source: LME, RBS forecasts
Nickel (stainless steels and alloys)
Nickel is our least preferred industrial metal. It is burdened
with a big overhang of excess inventory and idled capacity,
plus a parade of new mines. All this will take time to be
absorbed and we expect the nickel price to drift in 2010.
However, nickel is economically highly geared and after a
sharp decline since 2006, we forecast that demand will rise
by 10% pa in 2010-13. This should tip the market into deficit
in 2012-13 and finally lead to some pricing tension.
RBS nickel price forecasts
Current 2008 2009F 2010F 2011F 2012F 2013F LT
US$/lb
7.87
9.53 6.67 7.05 7.95 8.75 10.45 6.80
US$/t
17,340
21,020 14,700 15,500 17,500 19,250 23,000 15,000
Source: LME, RBS forecasts
Lead (lead-acid batteries)
Lead has been the best performer of 2009 to date, partly
due to the relative resilience of demand. Production from
scrap cannot on its own meet future demand growth and
the primary sector is hampered by lead’s by-product status.
We expect the lead market to return to deficit in 2011-13,
leaving it just as tight as in 2006-07. After consolidating in
2010, the lead price is forecast to reach US$2,750/t in 2013.
RBS lead price forecasts
Current 2008 2009F 2010F 2011F 2012F 2013F LT
US¢/lb
103
95 77 102 109 115 125 77
US$/t
2,275
2,084 1,700 2,250 2,400 2,525 2,750 1,700
Source: LME, RBS forecasts
Copper (electrical cable, wiring and tubing)
Copper remains our most preferred base metal. It may not
have the greatest upside from current levels but we expect
the copper price to reach a new all-time high by 2013.
Copper’s demand prospects are not among the best but we
believe copper producers will have the most difficulty in
keeping up with growing demand. We forecast an
underlying market deficit by 2011 and that by 2013 it will be
fast approaching pre-recession tightness.
Before then, copper still has some work to do. A large
surplus has been disguised by Chinese stockpiling and
some material may resurface, so easing the path to deficit.
RBS copper price forecasts
Current 2008 2009F 2010F 2011F 2012F 2013F LT
US¢/lb
278
315 230 305 330 375 410 225
US$/t
6,135
6,951 5,075 6,750 7,250 8,250 9,000 4,950
Source: LME, RBS forecasts
Zinc (galvanized steel for corrosion protection)
Zinc has been in the middle of the base metal pack in 2009
and we expect it to remain there in 2010-11 before it comes
into its own in 2012-13. We forecast that zinc will grind
higher next year but that it will top US$2,500/t by 2013.
The zinc market has been in hefty surplus in 2009 and we
expect it to stay in (smaller) surplus in 2010-11 as producer
restarts offset strong demand growth. But the lean pipeline
of new mine capacity points to large deficit from 2012.
RBS zinc price forecasts
Current 2008 2009F 2010F 2011F 2012F 2013F LT
US¢/lb
87
85 72 92 98 109 116 82
US$/t
1,910
1,870 1,585 2,025 2,150 2,400 2,550 1,800
Source: LME, RBS forecasts
Tin (solders, food/beverage tinplate cans)
Tin has had its own drama but has lagged behind in this
year’s price recovery. We expect it to start catching up in
2010 and forecast that tin will eventually hit US$18,000/t.
Tin demand has fallen heavily since 2006 and a sizeable
surplus has developed this year. But we forecast that
supply will barely keep up with recovering demand next
year and expect growing market tightness from 2011.
RBS tin price forecasts
Current 2008 2009F 2010F 2011F 2012F 2013F LT
US$/lb
6.85
8.39 6.25 7.25 7.80 8.05 8.15 6.80
US$/t
15,100
18,487 13,775 16,000 17,250 17,750 18,000 15,000
Source: LME, RBS forecasts
The Royal Bank of Scotland
Quarterly Commodity Companion | 1 October 2009
4
Gold (jewellery, investment, coins)
Gold set to average ~US$950/oz in 2009, will uniquely
among the metals, have had 8 consecutive years of higher
yoy average annual prices. An enviable track record.
Gold above the US$1,000/oz marker is the canary in the
mine. Gold is a classic harbinger of future inflation (watch
out bonds). It has also drawn strength from the weaker US
dollar and acute investor interest despite weak jewellery
sales. These should reverse as we enter the Gifting Season
Physically backed gold ETFs are now worth a record
US$55bn. A new Central Bank Gold Agreement has come
into force, but even central bankers like gold, with the
CBGA2 ending with the lowest annual sales in 10 years!
RBS gold price forecasts
Current 2008 2009F 2010F 2011F 2012F 2013F LT
US$/oz
1,000
872 950 1,000 975 1,000 1,150 825
Source: LBMA, RBS forecasts
Platinum (vehicle auto catalysts, jewellery, coins)
Even after its impressive price recovery this year, we expect
platinum to trend much higher through 2010-13, outshining
gold and eventually returning towards US$2,000/oz.
Industrial and jewellery demand should recover strongly in
2010-11. We forecast that platinum producers will struggle
to keep pace, and buoyant physical investment demand
may lead to real market tightness in the years ahead.
RBS platinum price forecasts
Current 2008 2009F 2010F 2011F 2012F 2013F LT
US$/oz
1,285
1,572 1,200 1,450 1,550 1,600 1,800 1,400
Source: LBMA, RBS forecasts
Coal (power generation, steel production)
Annual contract metallurgical coal prices for 2009/10
slumped by about 60%, but the market has already
tightened since on strong Chinese steel production. Indian
demand should be supportive too and we forecast a 17%
recovery in hard coking coal price contracts for 2010/11.
Thermal coal remains a buyer’s market. However, we
expect Indonesian exports to decline and Indian imports to
rise in the coming years, necessitating more investment in
Australian capacity. With costs proving sticky, we forecast
modestly higher thermal coal prices in 2010 and beyond.
RBS coal price forecasts
US$/tonne 2008 2009 2010F 2011F 2012F 2013F LT
Hard
Coking
305 128 150 150 145 145 100
% yoy
211% -58% 17% 0% -3% 0%
Thermal
125 69 75 78 80 83 65
% yoy
125% -45% 9% 3% 3% 3%
Source: TEX, Platt’s, RBS forecast
Silver (photography, jewellery, investment)
In traditional fundamental terms, silver remains, in our view,
the weakest of the precious metals. Yet its price recovery
has been amongst the strongest. Silver is a geared play on
gold and investor appetite has been voracious.
Photography is likely to continue to decline and jewellery
demand is sensitive to price. Against this, scrap supply is
forecast to decline and mine output to stagnate, but we
expect underlying supply surplus to persist.
However, physical investment, chiefly through the ETFs, has
shown itself amply able to hoover up the surpluses. We see
no reason why this should not continue, given the outlook
for gold. Silver is forecast to trend up towards US$20/oz.
RBS silver price forecasts
Current 2008 2009F 2010F 2011F 2012F 2013F LT
US$/oz
16.40
14.99 14.50 17.50 16.00 16.75 19.00 13.00
Source: LBMA, RBS forecasts
Palladium (auto catalysts, jewellery, electronics)
We believe palladium has the most upside potential of all
exchange-traded metals and forecast that the price will
more than double in the next four years to US$700/oz plus.
Even with soaring scrap supply, rebounding industrial
demand will keep the palladium market in large underlying
deficit. Robust physical investment may further tighten the
market and crucial Russian state sales will eventually end.
RBS palladium price forecasts
Current 2008 2009F 2010F 2011F 2012F 2013F LT
US$/oz
290
351 250 350 400 475 650 400
Source: LBMA, RBS forecasts
Iron ore (raw material for steel production)
We have raised our forecast of the long-term iron ore price.
For fines we have raised it by fully 33%. With China, not
Japan, now the price setter, marginal costs in China must
be taken into account as well as the incentive price for
Australian and Brazilian production.
In the shorter term we still forecast a modest recovery in
annual contract iron ore prices for 2010/11 despite the
recent decline in spot prices. We expect a marginal under-
utilisation of iron ore production capacity in the next few
years but cutbacks in China should limit any surplus.
RBS iron ore price forecasts
US¢/dltu 2008 2009F 2010F 2011F 2012F 2013F LT
Fines
147 99 108 117 105 94 86
% yoy
80% -33% 10% 7% -10% -10%
Lump
205 114 125 135 124 112 102
% yoy
97% -44% 10% 8% -8% -10%
Source: TEX, Platt’s, RBS forecast
The Royal Bank of Scotland
Quarterly Commodity Companion | 1 October 2009
5
Crude oil (transport, petrochemicals)
The sharp contraction in global petroleum demand seen in
late 2008 and into 2009 led to the rapid build up of crude oil
and distillates inventories around the world.
Despite little recovery in real demand for petroleum
products and near record levels of crude and distillate
inventories, crude prices have rallied from their lows. YTD
crude oil has traded more in line with equity and currency
markets than the intrinsic supply/demand balance of crude.
Short term, oil markets need to see global distillate
inventories begin to draw down for WTI to trade significantly
above $80/bbl. Longer term we expect the upturn in the
business cycle drive a recovery in real demand that will
push prices back towards $100/bbl by 2013.
RBS crude oil price forecasts
US$/bbl Current 2008 2009F 2010F 2011F 2012F 2013F
WTI
67
99.75 62 78 85 90 100
% yoy
38% -38% 26% 10% 6% 11%
Brent
66
98.52 63 79 87 92 102
% yoy
36% -36% 26% 9% 6% 11%
Source: Bloomberg, RBS Sempra forecasts
US natural gas (heating, power generation)
We do not believe US production will exceed total storage
so as to cause an inventory glut in October. The prompt US
gas price has likely bottomed, but heavy inventories will
keep prices depressed until the onset of cold winter
.
The US year over year inventory surplus will slowly be
worked off over the course of this coming winter, supporting
prices in 2010
. However, a bull market in US natural gas is
unlikely to develop in the near term without signs of a larger
than expected decline in domestic production
.
Longer term we expect to see the prompt US natgas price
back towards $7/MMBtu. The Baker Hughes US rig count
remains at heavily depressed levels. As a result, when gas
demand picks up the supply response may be delayed.
This should underpin stronger prices in the longer term.
RBS US natural gas price forecast – prompt
NYMEX/Henry Hub
$/MMBtu Current 2008 2009F 2010F 2011F 2012F 2013F
H-Hub
4.80 8.90 4.25 6.25 6.50 6.75 7.00
% yoy
25% -52% 47% 4% 4% 4%
Source: Bloomberg, RBS Sempra forecasts
Uranium (power generation)
A steady stream of new reactors coming on line in the
coming years, predominantly in Russia and China, will
support stable uranium demand growth.
Supply of US-Russian HEU (highly enriched uranium) is due
to end in 2013. Forecast increases in mine production will
not offset the exit of US-Russian HEU; as a result we expect
the uranium market to move into deficit by 2014.
We believe the days of sub-US$20/lb uranium are history.
New mine operating costs are US$20-30/lb; this will provide
a firm floor to the uranium price. We forecast that the
uranium price will peak in late 2011 at US$95/lb as the
market tightens ahead of the expiry of the US-Russian HEU
down blending programme in 2013.
RBS spot uranium price forecasts
US$/lb 2008 2009F 2010F 2011F 2012F 2013F
63.4 47.4 58.8 82.5 82.5 65.0
% yoy
-25% 24% 40% 0% -21%
Source: UxC , RBS forecasts
The Royal Bank of Scotland
Quarterly Commodity Companion | 1 October 2009
6
Ranked forecast price moves for key exchange traded commodities from
September average price levels to the RBS forecasts 1 and 4 years ahead
Sept.’09 Av. Q4 10F Av. % Change H2 13F Av. % Change
Industrial
Aluminium US$/t 1,834 2,100 15% 3,000 64%
Copper US$/t 6,196 7,000 13% 9,500 53%
Zinc US$/t 1,884 2,100 11% 2,600 38%
Nickel US$/t 17,468 16,000 -8% 24,000 37%
Lead US$/t 2,204 2,250 2% 2,800 27%
Tin US$/t 14,858 16,500 11% 17,750 19%
Precious
Palladium US$/oz 293 375 28% 700 139%
Platinum US$/oz 1,289 1,500 16% 1,900 47%
Silver US$/oz 16.39 17.50 7% 20.00 22%
Gold US$/oz 997 1,000 0% 1,200 20%
Oil & Gas
H-Hub Natgas US$/MMBtu 3.46 6.50 88% 7.00 102%
Brent Crude Oil US$/bbl 68 82 21% 100 47%
Source: Bloomberg, RBS forecasts
Source: RBS
1-year preferences - Forecasts move from Sept. 09
average spot prices to RBS Q4 10F average forecasts
-8%
0%
2%
7%
11%
11%
13%
15%
16%
21%
28%
-20% -10% 0% 10% 20% 30% 40%
Nickel
Gold
Lead
Silver
Tin
Zinc
Copper
Aluminium
Platinum
Crude Oil
Palladium
Source: RBS
4-year preferences - Forecast move from Sept. 09
average spot prices to RBS H2 13F average forecasts
19%
20%
22%
27%
37%
38%
47%
47%
53%
64%
102%
139%
0% 20% 40% 60% 80% 100% 120% 140% 160%
Tin
Gold
Silver
Lead
Nickel
Zinc
Crude Oil
Platinum
Copper
Aluminium
Natgas
Palladium
Commodity positioning
The table below shows our commodity preferences over two time frames. The
first is a year ahead. We have taken the average spot price in September 2009
and compared it with our price forecast averages for the final quarter of 2010.
On this analysis we are from current levels most bullish on natural gas (+88%),
palladium (+28%), oil (+21%) and platinum (+16%). Our least favoured are
nickel (-8%); gold (n/c) and lead (2%).
However, the rankings change if we view current prices in relation to our H2
2013 expectations for deep inventory-draining deficits to have emerged, the
world economy to be fully back into its stride and commodities in general to be in
effervescent mood. Our top picks on a four-year view are palladium (+139%),
natural gas (102%), aluminium (64%) and copper (53%).
The Royal Bank of Scotland
Quarterly Commodity Companion | 1 October 2009
7
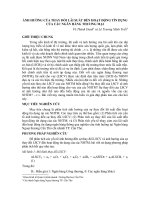
Source: LME and RBS
RBS Base Metal Price Index at its highest level in 12 months and up 70%
from its December ’08 low. V-shaped recovery is fact, not conjecture
0
50
100
150
200
250
300
350
73 75 77 79 81 83 85 87 89 91 93 95 97 99 01 03 05 07 09
RBS Base Metal Price Index
RBS Real Price Index RBS Nominal Price Index
Commodities
Boom, bust, re-adjust
“There is a tide in the affairs of men,
Which, taken at the flood, leads on to fortune;
Omitted, all the voyage of their life is bound in shallows and in miseries.
On such a full sea are we now afloat,
And we must take the current when it serves, or lose our ventures.”
Shakespeare’s Julius Caesar
The tide has turned for commodities
What a difference a few months make! Commodities have gone from investment
pariah to the ’darling of the diggin’s’ in a matter of just nine months. Yes,
commodity fund attention and a helpfully weaker US dollar have played their
part, but so too have the four key bridges across the recession that we spoke
about in our previous Commodity Companion, “Bridge over troubled water”.
A crucial phase has now been reached, with the baton passing from a financially
driven risk rally to the expected 2010 upturn in the world business cycle. In
effect, commodities have reached a junction at which the initial stimulus features
are on the wane and economic growth translates into real consumer demand. As
yet, it is very early days. Forward-looking economic and financial indicators have
certainly aligned; now to get the follow-through into genuine consumer offtake.
This year for commodities has been like a wedding at which everyone is
showered with confetti. All have shared the joy. Industrial, precious metals and
oil have all seen sharp rebounds from their price lows, even though their markets
have remained in fairly forlorn shape. Top of the pops in terms of price
performance have been lead, copper and zinc. We saw a substantial reversal of
fortune for lead, the worst performing metal of 2008 and thus far the best of
2009. Precious metals, notably palladium and silver, have also had an excellent
year, with gold setting the heather afire by not only breaking back above the
US$1,000/oz marker, but enjoying its longest-ever run of 10 consecutive days in
which it traded above US$1,000/oz. Despite this strong run, gold – the best
performing metal in 2008 – is thus far up 14% and the worst performing of 2009.
It’s no longer a matter of
conjecture, but fact that for base
and precious metals 2009 has
seen a V-shaped recovery
The monthly average RBS Base
Metal Price Index enters the final
quarter at a 12-month high,
recapturing nearly half its losses
The Royal Bank of Scotland
Quarterly Commodity Companion | 1 October 2009
8
Source: ICE and RBS
Brent oil has recaptured 29% of the
losses since its July 2008 peak
148
36
68
0
25
50
75
100
125
150
175
High Low Current
Source: LME and RBS
Copper has recaptured 54% of the
losses since its July 2008 peak
8,983
2,768
6,150
0
2,000
4,000
6,000
8,000
10,000
High Low Current
Source: LBMA and RBS
Gold has recaptured 91% of its
losses since its March 2008 peak
1,033
682
1,000
0
250
500
750
1000
1250
High Low Current
Source: LME and RBS
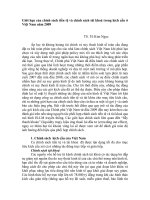
Overlapped chart of the RBS Base Metal Price Index progression in months
from the cycle lows of 1975, 1982 and 2008. Strong fit – relapse ahead?
90
110
130
150
170
190
210
0 1 2 3 4 5 6 7 8 9 10 11 12 13 14 15 16 17 18 19 20 21 22 23 24
Months following cycle low (forecasts in red)
Dec-1975 Nov-1982 Dec-2008
We are here
Recovery began Dec. '08. Now 9
months into the recover
y
, up 70%
and eclipising the two previous
recoveries. We forecast a suppl
y
reactivation induced pause in our
index before better times return
Dec. '75 index peaked after 7 months, up 30% then had a
second peak 8 months later before relapsing for 11 months
Nov. '82 recovery peaked after 9 months, up 42% and
then relapsed for 27 months before the next bull market
Many commodity prices are already halfway back to their peak levels
History warns us to expect a relapse in commodity prices
Base metals prices across the board have had an excellent 2009, but let us not
forget that commodity markets have not yet reached equilibrium. There are still
massive supply surpluses and huge inventory mountains to be eroded. We must
not be fooled into thinking that the price gains we have seen are a natural
precursor to even better prices ahead. That would be nice, but let us introduce
some prudence into our strategic thinking.
History can be a useful guide to the future. The chart below shows the monthly
progression of the RBS Base Metal Price Index from its lows in the two previous
oil–shock-inspired declines of the mid-1970s and the early 1980s. First, all three
price cycles bottomed towards the end of the year – the final capitulation and
perhaps clearing of the decks before the new year began. Despite the worldwide
economic crisis, the recovery in base metal prices as represented by the RBS
Index has been eerily similar to the two previous examples. The rally of 1975
peaked after seven months, up 30%, then began a meandering relapse. The
rally of 1982 peaked after nine months, up 42%, then relapsed for 27 months.
This cycle bottomed in December, has tracked the previous recoveries and
outpaced them in rising 70%, but at nine months also seems to be running out
of momentum. The common themes here are the fear of price-induced
production reactivation and the handing over of the baton, from hope that
springs eternal to the reality of the cycle. Batons are easily dropped!
This economic recession has
been the worst since 1945, but we
have had a telescoped
commodity cycle – peak to
trough in nine months against an
average of 41 months for
previous price recessions, and
trough halfway back to peak
levels in just nine months
The Royal Bank of Scotland
Quarterly Commodity Companion | 1 October 2009
9
Source: Bloomberg, RBS
Reuters/Jefferies CRB commodity index vs the trade-
weighted US dollar Index
250
300
350
400
450
500
Sep-06 Mar-07 Sep-07 Mar-08 Sep-08 Mar-09 Sep-09
70
74
78
82
86
90
RJ CRB Spot Index DXY Index (rhs)
Source: Bloomberg, RBS
Reuters/Jefferies CRB index vs the S&P 500 VIX
volatility Index
250
300
350
400
450
500
Sep-06 Mar-07 Sep-07 Mar-08 Sep-08 Mar-09 Sep-09
0
16
32
48
64
80
RJ CRB Spot Index VIX Index (rhs)
Risk appetite and US dollar risk to commodity attitude
Not only do we have the price gains running out of upside momentum, but we
also must consider two other potential headwinds. The first is the path of the US
dollar. Commodities are priced in US dollars, so as a rule, the weaker the US
dollar, the better it is for purchasers of commodities in stronger currencies such
as euro or yen. The trade-weighted US dollar begins Q4 09 at 12-month lows.
The left-hand chart shows the broad-based Reuters/Jefferies CRB commodity
index against the trade-weighted US dollar and shows an antithetic relationship.
If you think the US dollar will strengthen, commodities are a sell.
The right-hand chart shows a measure of investor appetite for risk, the S&P 500
volatility or VIX index. As the chart shows, until mid-2008, the RJ/CRB index was
able to cruise higher, with the VIX index range trading and showing no signs of
what was about to befall markets. As the financial crisis erupted, the VIX
ballooned to record levels and the market-sold risk and commodities were prime
candidates for selling. This year has seen the VIX index subside towards levels
associated with pre-Lehman days, and commodities have rebounded as
investors have been happy to take on board the risk trade.
.
Job done for the temporary bridges across the
recession – now the unwind and dismantling
In our April Commodity Companion, we identified four bridges across this
recession that would provide temporary solace to the commodity sector while it
waited for the genuine recovery in world demand. Each of these has been
successful and all are now being unwound. As a reminder, we identified:
Bridge 1: Global monetary and fiscal stimulus, zero interest rate policies
and quantitative easing. Rates are now on hold and some central banks have
begun raising rates. Unwind of QE and rescue packages under way.
Bridge 2: Massive supply cutbacks. Reactivation is now beginning, notably in
aluminium, but all the other metals have shown fraying at the edges. There is a
strong yin/yang between price-induced reactivation and demand-induced
reactivation. Our preference is for the latter.
The Royal Bank of Scotland
Quarterly Commodity Companion | 1 October 2009
10
Source: LME, LBMA, Reuters and RBS
Percentage rise in commodity prices from their cycle
lows. Impressive gains show worst is behind us
17%
42%
47%
48%
57%
59%
73%
84%
87%
89%
96%
99%
102%
122%
157%
0% 40% 80% 120% 160%
Thermal Coal
Iron ore
Gold
Aluminium
Tin
S&P 500
Platinum
Palladium
Zinc
Brent Oil
Silver
Natgas
Nickel
Copper
Lead
Source: LME, LBMA, Reuters and RBS
Percentage declines from price cycle peaks. Gold has
fallen the least, natural gas and nickel the most
-67%
-65%
-63%
-58%
-55%
-54%
-50%
-44%
-44%
-43%
-39%
-33%
-32%
-22%
-3%
-80% -60% -40% -20% 0%
Nickel
Natgas
Thermal Coal
Zinc
Iron ore
Brent
Palladium
Platinum
Aluminium
Lead
Tin
S&P 500
Copper
Silver
Gold
Bridge 3: Chinese stockpiling. Has been substantial in 2009, but the past two
months have shown significant reduction in commodity imports into China across
the commodity spectrum. Copper imports in August were down 25% mom and
43% lower than their record high of 0.373mt in June 2009. Our view is that
Chinese stockpiling was in part to sterilise some of its US$2.12trn of US dollar
reserves, but also, access to raw materials must not be an impediment to
Chinese growth. This is why China is also seeking ownership of commodities. If
company equity ownership is blocked, then China will seek access to operating
projects.
Bridge 4: ‘Cash-for-clunkers’. Schemes were put in place by various
governments and auto registrations have soared. Germany and the US have now
closed their schemes; others, such as the UK (which has just been extended),
are close to reaching funding limits. The market does fret that the schemes have
merely brought forward purchases and that auto sales will swoon in 2010.
Keep an eye on important headwinds yet to come
Other factors may come into play during 2010, to provide stronger headwinds to
the commodity complex. These include: 1) higher taxes around the world to help
pay for the financial crisis; 2) the spectre of a long-term unemployed burden with
still rising unemployment numbers; 3) reduced leverage by financial institutions;
4) massive cuts in government capital spending programmes; 5) rising world
interest rates; and 6) the removal in the US of real estate housing tax credits.
There may then arise later in H1 2010 a sense that ’is this really as good as it
gets?’. Déjà vu plays its part and trend growth slumps lower, as for example in
OECD Industrial Production post the 1974 and 1981 oil shocks.
Commodity price winners and losers
The two charts below provide insight into investor attitudes towards the
commodity suite. The chart on the right shows the percentage price declines
from commodity cycle price peaks. Note that the top 2 commodities are precious
metals. Investors are hanging onto precious metal exposure as a hedge against
future inflation and as a play on US dollar weakness. Natural gas and nickel were
two of the biggest price boomers caught up in the fund euphoria and remain
furthest from their price peaks. We believe the chart on the left should offer
comfort. Many of the commodities bottomed in Q4 08 and for those seeking
evidence of price stabilisation and a turning point, these impressive increases
from their lows should provide comfort that the worst is well and truly over.
Watch out for a number of
economic and financial
headwinds that have yet to come
into play
The Royal Bank of Scotland
Quarterly Commodity Companion | 1 October 2009
11
Source: Company releases and RBS
Producer cutbacks and restarts as a percentage of 2008 world output –
restarts are mounting, stark and worrying differences between the metals
0% 5% 10% 15% 20% 25%
Nickel (mine)
Aluminium
Zinc (smelter)
Zinc (mine) *
Lead (refinery)
Lead (mine) *
Copper (smelter)
Copper (mine)
Cutbacks still in place Restarts
* Excludes China
Forget cutbacks; production restarts have begun
The flood of producer cutbacks in the base metal industry in Q4 08 and Q1 09
slowed to a mere rivulet in Q2 09 as price stabilisation hardened into recovery.
Moreover, there were just a handful of further cutbacks in the third quarter,
outnumbered by announcements of restarts as prices continued to firm. Even in
the second quarter China, which had been in the forefront of the cutbacks, was
quietly and not so quietly reactivating capacity across most base metal
industries, and it was joined in Q3 by several producers elsewhere.
We see some potentially worrying aspects to recent developments. In the first
place, restarts have been induced more by price than by demand. Chinese
stockpiling, which by its nature may be only temporary, played a significant
behind-the-scenes role in triggering reactivation within China, and globally, there
were still only tentative signs of a pick-up in genuine base metal demand.
Second, the restarts paradoxically have been heavily concentrated in one of the
most oversupplied markets, aluminium. Third, there remains a huge overhang of
closed nickel capacity. Ironically, few of the admittedly modest cutbacks in the
fundamentally strongest market, copper mining, have yet been reversed.
Our chart below shows estimates of the capacity cutback since mid-2008 and
the reactivation of that capacity, both expressed as a percentage of 2008 world
production. Although our figures do not capture big, hard-to-monitor cutbacks
and restarts in the Chinese lead/zinc mining industry, aluminium really stands
out. We estimate that the proportion of previously closed aluminium smelter
capacity (over 7mtpa at its peak) that has now restarted is fast approaching
50%. In aluminium, both cutbacks and restarts have been dominated by China.
Our estimates probably do not capture all the mines feeding the Chinese nickel
pig iron industry, but the chart shows that there remains a huge overhang of
idled nickel mine capacity worldwide, representing c20% of 2008 world output.
With the exception of copper and perhaps lead, we would urge producers to
be very cautious about embarking on price-induced as opposed to demand-
induced reactivation. For some metals, notably aluminium and nickel, this would
risk derailing the impressive recovery seen this year.
Producer cutbacks have ended
and reactivation is now the
theme; nickel and aluminium saw
the biggest cuts as a percentage
of world output
We prefer demand-induced
reactivation, but some producers
will not wait and will implement
more risky price-induced
reactivation
The Royal Bank of Scotland
Quarterly Commodity Companion | 1 October 2009
12
RBS long-term metal prices raised
We provide two sets of commodity prices, medium term through to 2013
reflecting our market supply-demand balance outlooks. These forecasts are
subject to frequent revision reflecting changes in the global economic
environment and the dynamics of supply and demand. The second set of longer-
term prices are those which we expect to prevail over, say, a 10-year time
horizon. Our longer-term real forecasts move less frequently. We try to provide
a ballpark price required to bring on new capacity. We have looked at industry
cost curves and made an assessment of the currency impact of a weaker US
dollar and a more robust inflation profile post 2013 on our long-term prices.
As a rule, long-term prices have tended to decrease over time. Since the 1960s,
real prices have tended to decline by around 2% pa. Economies of scale
developed as bigger mines and processing facilities were built, technological
advances were made and a shift of production to lower-cost labour areas
occurred, as well as the type of operation. In copper, an underground sulphide
operation will likely have higher costs than an open pit sulphide or a heap leach
oxide operation. In the case of nickel ferro – nickel laterite ores are notoriously
more expensive than sulphide ores to process. But production costs have been
on the increase. Factors have included increased cost of environmental
compliance and land rehabilitation; water and air pollutant capture; energy;
wages, health care and pension benefits; and adverse currency movements.
RBS checklist for commodity recovery
On the next page we have updated our Commodity Checklist to Recovery of
signs needed before we reach the next boom for commodities. Lots more ticks
are now in the boxes. There is not one Messianic chart or indicator. The recovery
is a process, so we have divided our list into financial, economic and commodity
market drivers and arranged them in roughly chronological order, but please
view it as a guide to events that may occur as markets work their way through
this maelstrom.
The strengthening of commodity
currencies such as the rand,
Canadian dollar and Australian
dollar has pushed up production
costs; inflation, too, could
become an issue
RBS long-term price forecasts – these have mostly been raised as production coats have risen reflecting such
factors as adverse currency movements on the weaker US dollar, inflation expectations, and wage and power
Current Previous Change (unit) Change %
Aluminium
c/lb
110
110 0.00 0%
$/t
2,425
2,425 0.00 0%
Copper
c/lb
225
175 50 29%
$/t
4,950
3,850 1,100 29%
Lead
c/lb
77
60 17 31%
$/t
1,700
1,300 400 31%
Zinc
c/lb
82
70 12 16%
$/t
1,800
1,550 250 16%
Nickel
$/lb
6.80
6.00 0.80 13%
$/t
15,000
13,225 1,775 13%
Tin
$/lb
6.80
6.50 0.30 5%
$/t
15,000
14,325 675 5%
Gold
$/oz
825
750 75 10%
Silver
$/oz
13.00
11.50 1.50 13%
Platinum
$/oz
1,400
1,200 200 17%
Palladium
$/oz
400
350 50 14%
Iron ore - fines
USc/dltu
86
65 21 33%
Thermal coal
US$/t
65
55 10 18%
Hard coking coal
US$/t
100
86 14 16%
Source: RBS forecasts
The Royal Bank of Scotland
Quarterly Commodity Companion | 1 October 2009
13
RBS Commodity Checklist to Recovery
Financial signals
Resumption of more normal lending a priority and a pre-requisite for a business cycle recovery
9
Financial arteriosclerosis begins to unblock – letters of credit and resumption of lending
9
Value investors begin to return to commodity markets/indices
9
World equity markets find a floor and begin pricing in the business cycle recovery
9
Commodity currencies (AUD, ZAR, CAD) come back into vogue
9
Interbank lending rates return to ‘normal’ levels
9
S&P VIX index falls back from its extreme levels (peaked at 90) to more normal levels below 30
9
Cross-asset class selling pressure ends and funds begin to register steady positive fund inflows as risk appetite returns
9
Key central bank interest rates begin to rise as headline and then core inflation data starts to increase
Economic signals
Pace of growth contraction stabilises
9
Various key economy PMIs begin to rise as consumer confidence improves
9
US ISM rebounds
9
Key economy IP/GDP data series turn positive. Technical recession has ended in the US, Japan, Germany, France, the UK, Sweden and Brazil
9
Automobile sales begin to recover (spurred by the various ‘cash-for-clunkers’ incentive schemes)
9
Baltic Dry/Capesize Freight indices make demonstrable rises as ships begin to move cargo as international trade improves
US payroll numbers finally begin to consistently improve and unemployment starts to decline
Commodity market signals
Economic recession causes commodity to demand collapse. Declines yoy are toe-curlingly harrowing
9
Reported inventories rise alarmingly and stock:consumption ratios rise well away from critical/comfort levels.
9
Commodity prices slump well below marginal costs of production. Un-crowded bottom cycle trade based upon value and accumulation
9
Metals and mining companies implement price-induced production cutbacks
9
Miners slash exploration and capital expenditure budgets and defer/slow-track new projects
9
Commodity price stabilisation as cutbacks bite, supply surplus contained and funds start value investing in earnest
9
Precious metals gold, silver, platinum and palladium advance ahead of industrial and bulk commodity prices
9
Industrial metal prices step up smartly, leaving deep lows well behind as the recovery phase of the pricing cycle occurs
9
Better prices and improving demand outlook halts production cutback announcements
9
Oil price recovers, spurred by OPEC constraint, and hopes that world business cycle upturn will stimulate energy usage
9
Re-stocking by consumers and distributors starts to deplete the inventory pipeline
9
Exchange inventories finally begin to erode to feed consumer re-stocking and nascent demand
Period of onerous supply surpluses ends and market surpluses diminish and begin to switch from surplus to deficit
Capacity reactivation in full swing, both price and demand induced. Capex spending on the rise. Bubble charts of new projects reappear
Hiatus in price progression (relapse) while market awaits confirmation that price recovery is not a false dawn
Business cycle really gets into its stride and world interest rates begin to rise to combat rising headline and core inflation
Commodity markets bathed in above-trend genuine commodity demand growth.
Stock: consumption ratios fall to critical levels as inventory-draining supply shortfalls occur, spurring prices even higher
Momentum buyers arrive in full force, drinking from the horn of plenty. Backwardations and market squeezes reappear
Bearish analysts are rarer than hen’s teeth and those that survive are like Victorian children: seen but not heard.
End-cycle bull market takes off. Super-cyclists return. Words like ‘paradigm shift’ appear again and miners declare special dividends
Don’t forget to book your ticket to the Bahamas!
Source: RBS
The Royal Bank of Scotland
Quarterly Commodity Companion | 1 October 2009
14
Source: IMF, LME and RBS economic forecasts
World GDP growth and the RBS Base Metal Price Index in real terms. Worst
recession in living memory, but metals already in the sunny uplands
-1
0
1
2
3
4
5
6
7
72 74 76 78 80 82 84 86 88 90 92 94 96 98 00 02 04 06 08 10F
World GDP growth, %
0
40
80
120
160
200
240
280
320
RBS - BMPI (real)
World GDP growth RBS - Base Metal Price Index (real)
RBS world GDP growth forecast of +3.6% yoy for 2010
In the ‘Economic Focus’ section of this report, the RBS economists offer their
thinking on the world macroeconomic outlook. The good news is that since our
April report, countries have been lining up to declare themselves as now out
of technical recession. Europe’s two largest economies, Germany and France,
set the ball rolling with Japan, the US, Sweden, the UK and Brazil all declaring
their recessions over. Our enthusiasm towards the commodity sector derives
much support from our expectation that world GDP growth in 2010 will rebound
to 3.6% with risks to the upside. Base effect will of course flatter.
The chart below shows the RBS Base Metal Price Index and world GDP growth.
It shows how the final fanfare in commodity prices usually comes towards the
end of a period of sustained economic growth. Note also the powerful increases
in metal prices in the period immediately following recession years. History has
repeated itself. History also shows that prices tend now to relapse.
Hallelujah, the world recession is
over; economies are already
clawing their way out of the
abyssal depths; we forecast
world GDP growth of 3.6% yoy in
2010, with risks to the upside
RBS macroeconomic forecast summary, 2008-10F. Worldwide recessions
are ending. World GDP growth in 2010 should rebound to at least 3.6%.
% change yoy 2008 2009F 2010F
Real GDP
US 1.1
-2.6
3.2
Euro area 0.6
-3.8
0.9
Germany 1.0
-4.8
1.3
Japan
-0.7 -5.8
0.9
China 9.0 8.0 8.0
Asia (ex China & India) 3.1
-1.1
4.6
World GDP
2.8 -0.8 3.6
Industrial production
US
-2.2 -5.6
3.7
Euro area
-3.6 -13.5
2.3
UK
-3.1 -9.7
1.8
Japan
-3.4 -23.0
13.0
Policy rate (end period)
US 0.14 0.15 3.00
Euro area 2.50 1.00 1.00
UK 2.00 0.50 1.50
Japan 0.10 0.10 0.10
Source: RBS economic forecasts
The Royal Bank of Scotland
Quarterly Commodity Companion | 1 October 2009
15
Source: LME and RBS
Total LME warehouse inventory is at record levels of 5.72mt – and is
dominated by aluminium. Total inventory worth over a record US$14bn
0
1,000
2,000
3,000
4,000
5,000
6,000
83 85 87 89 91 93 95 97 99 01 03 05 07 09
'000 tonnes
45
80
115
150
185
220
255
RBS Base Metal Index (real terms)
Total LME inventory (lhs) RBS Base Metal Price Index in Real Terms (rhs)
Source: LME, RBS
Aluminium is 81% of total LME
inventory and copper just 6%
81%
8%
6%
2%
2%
0.4%
0%
15%
30%
45%
60%
75%
90%
Al Zn Cu Pb Ni Sn
Source: LME, RBS
But by value, aluminium is 60%
with copper 15% (US$bn)
60%
15%
14%
6%
2%
2%
0
2
3
5
6
8
9
Al Cu Ni Zn Sn Pb
LME inventories still at record highs
Total LME warehouse inventories at 5.72mt have now exceeded the previous
record high of 4.77mt seen at the end of April 1993. Industry destocking and
collapsing consumption have enabled the LME to live up to its mantra of being
the market of last resort. Warehouse inventory is now valued at over US$14bn.
The good news is that the pace of inventory accretion is slowing. Indeed,
September saw the lowest level of inventory build in 17 months.
Metal held in LME-registered warehouses is dominated by aluminium holdings.
Aluminium accounts for 81% of the inventory tonnage, zinc 8% and copper 6%.
In terms of inventory value, aluminium is 60%, copper 15% and nickel 14%.
Base metal refined production and consumption should rise in 2010F
Base metal refined production and consumption will contract across the board in
2009, with aluminium showing the worst demand fall, down 7.5% yoy and
stainless steel the biggest production slump down 12%. For much of the
commodity boom, we had price- and demand-induced capacity expansion and
price-induced demand destruction. The phase of price-induced production cuts
and the concept of idling swing capacity are also coming to an end. The game
now is about reactivation and first mover advantage. We forecast that all metals
will show yoy production expansion in 2010, with nickel and stainless steel
showing the greatest rises. This should be but the first year of significant
production additions from reactivated as well as new and expanded operations.
Contraction in world supply and
demand in 2009; shared pain,
shared gain as producers rapidly
implemented closures; watch out
now for across-the-board
reactivation
Base metal annual yoy refined metal production growth, 2006-13F (%)
2006 2007 2008 2009F 2010F 2011F 2012F 2013F
Aluminium
5.9% 12.4% 5.3%
-6.6%
4.0% 8.3% 6.5% 6.7%
Copper
4.3% 3.9% 0.9%
-3.8%
3.2% 4.2% 4.0% 4.0%
Nickel
5.1% 6.3%
-3.5% -7.5%
9.0% 6.5% 9.0% 6.5%
Stainless steel
14.4%
-1.0% -6.0% -12.0%
10.0% 9.0% 14.0% 8.0%
Zinc
4.6% 7.3% 2.3%
-7.0%
4.6% 6.6% 3.3% 3.2%
Lead
3.5% 2.5% 6.0%
-4.1%
4.2% 4.7% 4.2% 4.8%
Source: CRU, RBS forecasts
The Royal Bank of Scotland
Quarterly Commodity Companion | 1 October 2009
16
Our estimates of metal consumption post 2009 have remained robust. We still
expect the economically geared metals aluminium and nickel to register the
strongest growth at 10% pa in 2010 and well above trend growth in 2010-13F.
We also envisage a strong measure of consumer and distributor restocking in
2010, which will flatter the yoy numbers as well as a base effect phenomenon.
The declines in 2009 were every bit as bad as the 1980-82 post-oil-shock
recession.
All the base metals markets in supply surplus in 2008-09
The following tables provide summaries of our implied supply/demand market
balances through to 2013F and the derived stock consumption ratios. We
highlight periods of supply deficit in bold. The world supply deficits of 2006 were
progressively replaced in 2007-09 by supply surpluses. We can’t even begin to
think what state the industry would be in had aggressive cutbacks not been
made. We forecast that 2011 will be a transition year to the better, with supply
surpluses diminishing and shortfalls reappearing. By 2012, all the metals should
be in price-supporting supply deficit.
The table below shows total industry inventories expressed in terms of weeks of
consumption. The stock ratio rose sharply in 2008, notably for aluminium and
nickel, the two more economically geared metals, and we forecast that the stock
ratios will peak by the end of 2010. Based on our demand forecasts for 2010, in
the case of aluminium, one week of stock equates to 0.665mt, for copper
0.340mt, for zinc 0.215mt and nickel 0.025mt.
Base metal annual yoy world consumption growth, 2006-13F (%)
2006 2007 2008 2009F 2010F 2011F 2012F 2013F
Aluminium
8.0% 10.0%
-1.2% -7.5%
10.0% 10.0% 8.0% 7.0%
Copper
3.2% 3.8%
-1.7% -6.0%
7.0% 6.0% 4.2% 3.8%
Nickel
12.0%
-4.5% -5.0% -3.0%
10.0% 8.0% 13.5% 8.0%
Zinc
5.2% 2.0%
-0.5% -6.3%
7.1% 6.7% 5.8% 4.3%
Lead
4.1% 1.5% 2.7%
-2.7%
4.9% 5.2% 4.7% 4.5%
Source: CRU and RBS forecasts
Hefty supply surpluses in 2008-
10, but 2011 should see transition
towards the first supply deficits,
notably copper and lead; by 2012
all markets should be in deficit
Implied world base metal supply/demand balances, 2006-13F. Markets
have migrated from supply deficits in 2006 to supply surpluses
2006 2007 2008 2009F 2010F 2011F 2012F 2013F
Aluminium
-620
150 2650 2850 850 300
-250 -500
Copper
-120 -110
360 750 150
-150 -200 -200
Nickel
-60
90 105 45 35 15
-45 -75
Zinc
-390
145 460 350 100 100
-200 -350
Lead
-160 -85
175 50 0
-50 -100 -75
Source: CRU and RBS forecasts
Base metal market stock consumption ratios, 2006-13F (weeks of stock).
These have rapidly moved from below critical levels to above comfortable
2006 2007 2008 2009F 2010F 2011F 2012F 2013F
Aluminium
4.0 3.8 6.3 10.0 9.5 8.5 7.5 6.5
Copper
3.4 2.9 3.4 3.6 4.1 3.6 3.2 2.8
Nickel
5.7 7.8 10.4 12.6 12.2 12.0 9.0 6.2
Zinc
2.6 2.9 3.8 5.2 5.8 6.3 5.3 4.0
Lead
1.7 1.7 1.9 2.5 2.7 2.3 1.9 1.6
Source: LME, ICSG, ILZSG, ICSG, IAI and RBS estimates and forecasts
The Royal Bank of Scotland
Quarterly Commodity Companion | 1 October 2009
17
Source: Bloomberg and RBS
Gains in our commodity suite since end 2008 in US
dollars have been eye-catching
-12%
13%
15%
23%
42%
43%
44%
49%
56%
59%
65%
106%
128%
-50% -25% 0% 25% 50% 75% 100% 125% 150%
Thermal Coal
Iron Ore
Gold
Aluminium
Platinum
Brent Oil
Tin
Silver
Nickel
Palladium
Zinc
Copper
Lead
Source: Bloomberg and RBS
… but in stronger South African rand the gains are
lower and indeed some gains have turned to losses
-31%
-12%
-11%
-5%
10%
11%
12%
16%
21%
24%
29%
60%
77%
-50% -25% 0% 25% 50% 75% 100% 125% 150%
Thermal Coal
Iron Ore
Gold
Aluminium
Platinum
Brent Oil
Tin
Silver
Nickel
Palladium
Zinc
Copper
Lead
Weaker US dollar currency impact has been dramatic
The world has now moved away from a strong US dollar environment. Indeed,
the trade-weighted US dollar begins Q4 09 at its lowest level in over 12 months.
The two charts below show the impact of the weaker US dollar on a suite of spot
commodity prices. We have chosen the South African rand as our example, but
a similar though less extreme picture emerges for the Canadian and Australian
dollars.
The charts show that the percentage gains in commodity prices when translated
into local currency terms are dramatically lower. South African miners with costs
in appreciating rand (not to mention higher wage settlements and Eskom power
tariffs) but product revenues in weaker US dollars face a tough margin squeeze.
The value and accumulation trade now completed
In 2008, with the exception of gold, every one of the key traded commodities
experienced significant price declines of 30-60%. By year-end, commodities had
fallen so far and so deep into industry cost curves that they offered financial
funds a bargain basement entry opportunity. Philanthropy is not a feature of the
mining industry and by and large, miners are not going to produce at a loss for
too long. That said, there has been an element of shared-pain, shared-gain
about this cycle.
Given the often extreme price volatility and daily moves of above 5% for a metal
are not uncommon, entry into the commodity space in Q4 08 was very much for
the brave hearted and it was all about executing the bottom of the cycle trade.
This tends not to be a crowded trade, but one where given the oversold nature of
commodities; longer-term investors are attracted by value and the opportunity
to accumulate exposure. Those who this year have followed the risk trade rather
than the economic trade have been handsomely rewarded.
Commodity markets are now entering the twilight zone, where the baton has to
be handed over from hope and anticipation to genuine economic demand pull
as the business cycle recovers. It becomes more and more a macroeconomic
trade as the business cycle moves into recovery and expansion. This is about
momentum and value stretch and will become a much more crowded trade.
Risks remain, such as a relapse
in the pace and magnitude of the
economic recovery; that
producers prematurely reactivate
too much idled capacity; the
ending of Chinese SRB buying
and even perhaps stockpile
selling, prompts a sell-off
The Royal Bank of Scotland
Quarterly Commodity Companion | 1 October 2009
18
Source: RBS
The four phases of a typical business cycle. Many economies have now
declared the technical recession over. Now in Phase 4 - Recovery
Recovery
Expansion
Slowdown
Expansion
Recession
Momentum
Time
Growth
1 2
1
3
4
Source: RBS
RBS Business Cycle Screener: Dynamics of the four different phases of a
typical business driven by Growth and Momentum
Recovery: Growth remains
negative and momentum
turns positive
Expansion: Growth turns
positive and the momentum
remains positive
Slowdown: Growth remains
positive and the momentum
turns negative
Recession: Growth turns
negative and the
momentum remains negative
Direction of the
Business C
y
cle
MOMENTUM
GROWTH
1
2
3
4
We are now in the recovery phase of the business cycle
As we said earlier, for commodity markets, 2009 has all been about recovery in
prices from dismally low levels, levels that were deep into industry cost curves
and in which huge swathes of the industry were losing money. By definition,
economic commodity production must be that which can be
extracted/produced at a profit (some state-owned enterprises seem to operate
for quota and have a subtle shift along the lines of merely that which can be
extracted). It has been about recession in key developed world economies and
temporary bridges to stimulate growth, not very much about the macroeconomic
environment. This is now changing. It is now all about the macro.
So where are we in the business cycle? The two diagrams below are from the
RBS Business Cycle Screener published by our colleagues in European
Economics. Commodity markets have – correctly in our opinion – this year been
discounting that the world business cycle is moving from Recession Red Phase
3 into Recovery - Red Phase 4. As shown in our explanatory boxes below, Phase
4 is when growth remains in negative territory but momentum turns positive.
Crucially, although the phases of this cycle have been pretty much textbook, the
speed at which the slowdown and recession phases have completed their
moves has been staggeringly swift. In our January Commodity Companion,
“Metamorphosis”, we noted that historically, base metal prices as represented
by the RBS Base Metal Price Index have taken 41 months to move from peak to
trough. This time around, that journey was achieved in just nine months
from March to December 2008 – a telescoped cycle. But look at the symmetry.
It has also taken just nine months for our index to rise 70%, recapturing half its
losses. Meanwhile, governments around the world are declaring their recessions
(as defined as two consecutive quarters of negative GDP growth) over.
The Royal Bank of Scotland
Quarterly Commodity Companion | 1 October 2009
19
Source: IMF, LME, RBS forecasts
Metals have experienced a telescoped price cycle and have had their very
own V-shaped recovery. Time now to pause for breath before greater glory
0
50
100
150
200
250
300
350
72 74 76 78 80 82 84 86 88 90 92 94 96 98 00 02 04 06 08 10F 12F
RBS Real Base Metal Price Index RBS Nominal Base Metal Price Index
London Metal Exchange Week 12 October − coming into focus
It’s that time of year again for the annual LME Week, kicking off what is known
affectionately in the metals world as the “mating season”. LME Week this year
begins on Columbus Day, Monday 12 October, and will see thousands of
commodity producers, consumers, traders, analysts and media descend on
London for a week-long festival of metal markets and their outlooks. It provides
an opportunity for crystal ball gazing into 2010. It will be held in a much better
price and financial environment to that of October 2008, when the world was
already sliding into the depths of the recession. With just three months of the
year remaining, 2009 should go down as a banner year for commodities, a year
in which gold spent its longest period above the US$1,000/oz marker and a year
in which many of the world’s key commodities – oil, copper, lead and nickel –
doubled in price during the worst recession in living memory.
The chart below shows the RBS Base Metal Price Index in real and nominal
terms and our forecast (in red) for the index. The message is that base metals
have had their very own V-shaped price recovery. We forecast that in common
with previous price cycle recoveries, which relapsed after 7-9 months,
commodities in general are likely to pause for breath while the fundamentals
catch up with the business cycle recovery. It will be crucial for real demand in
western developed world economies to flourish and compensate for the ending
of temporary stimulus packages and Chinese stockpiling. The path of the US
dollar, attitudes to risk appetite and the macroeconomic outlook are now
the three key common denominators for the commodity complex.
If our forecasts are fulfilled, then commodity prices of base and precious metals
through to bulks and energy appear set to enjoy handsome gains through to
2013. We forecast the RBS Base Metal Price Index will track essentially sideways
and rise around 17% in US dollar terms by Q2 11 as producer reactivation
delivers hundreds of thousands of tonnes of commodities into world markets.
This phase will coincide with fears of economic growth relapse and with a
number of financial and economic headwinds such as higher taxes, hefty cuts in
government capital spending programmes and of course rising interest rates.
Beginning in H2 11, we expect commodity markets to get truly into their stride.
Supply deficits should re-emerge; inventories should be drawn down; capacity
utilisation rates should rise to high levels; freight rates should rise sharply and all
the ingredients should then be in place for a good old-fashioned bull market. We
forecast a 35% rise in the RBS Base Metal Index from H1 11 to H2 13, providing
an overall rise in our index from current to end-2013 of an impressive 60%.
The Royal Bank of Scotland
Quarterly Commodity Companion | 1 October 2009
20
RBS annual commodity price actuals and forecasts, 2008-13F
2008A 2009F 2010F 2011F 2012F 2013F LT
Base metals
Aluminium US¢/lb 117 75 90 100 115 130
110
US$/t 2,571 1,645 2,000 2,200 2,525 2,875
2,425
Copper US¢/lb 315 230 305 330 375 410
225
US$/t 6,951 5,075 6,750 7,250 8,250 9,000
4,950
Lead US¢/lb 95 77 102 109 115 125
77
US$/t 2,084 1,700 2,250 2,400 2,525 2,750
1,700
Zinc ¢/lb 85 72 92 98 109 116
82
US$/t 1,870 1,585 2,025 2,150 2,400 2,550
1,800
Nickel US$/lb 9.53 6.67 7.05 7.95 8.75 10.45
6.80
US$/t 21,020 14,700 15,500 17,500 19,250 23,000
15,000
Tin US$/lb 8.39 6.25 7.25 7.80 8.05 8.15
6.80
US$/t 18,487 13,775 16,000 17,250 17,750 18,000
15,000
Precious metals
Gold US$/oz 872 950 1,000 975 1,000 1,150
825
Silver US$/oz 14.99 14.50 17.50 16.00 16.75 19.00
13.00
Platinum US$/oz 1,572 1,200 1,450 1,550 1,600 1,800
1,400
Palladium US$/oz 351 250 350 400 475 650
400
Bulks
Fe - fines US¢/dltu 147 99 108 117 105 94
86
Fe - lump US¢/dltu 205 114 125 135 124 112
102
Coal - Hard coking US$/tonne 305 128 150 150 145 145
100
Coal - Semi soft coking US$/tonne 240 79 84 87 92 84
74
Coal - LV PCI US$/tonne 245 86 98 98 90 90
80
Coal - Thermal US$/tonne 125 69 75 78 80 83
65
Oil & Natural Gas
WTI Crude Oil US$/bbl 99.75 62 78 85 90 100
100
Brent Crude Oil US$/bbl 98.52 63 79 87 92 102
102
Henry Hub Natural gas US$/MMBtu 8.90 4.25 6.25 6.50 6.75 7.00
7.00
Uranium US$/lb 63.4 47 59 83 83 65
65
Annual yoy percentage changes in actual and RBS commodity price forecasts, 2008-13F
2008A 2009F 2010F 2011F 2012F 2013F
Base metals
Aluminium
-3% -36%
22% 10% 15% 14%
Copper
-2% -27%
33% 7% 14% 9%
Lead
-20% -18%
32% 7% 5% 9%
Zinc
-42% -15%
28% 6% 12% 6%
Nickel
-43% -30%
5% 13% 10% 19%
Tin 27%
-25%
16% 8% 3% 1%
Precious metals
Gold 25% 9% 5% -3% 3% 15%
Silver 12% -3% 21% -9% 5% 13%
Platinum 21% -24% 21% 7% 3% 13%
Palladium -1% -29% 40% 14% 19% 37%
Bulks
Fe – fines 80%
-33%
10% 7%
-10% -10%
Fe - lump 97%
-44%
10% 8%
-8% -10%
Coal - Hard coking 211%
-58%
17% 0%
-3%
0%
Coal - Semi soft coking 281%
-67%
6% 4% 5%
-8%
Coal - LV PCI 263%
-65%
14% 0%
-8%
0%
Coal - Thermal 125%
-45%
9% 3% 3% 3%
Oil & Natural Gas
WTI Crude Oil 38%
-38%
26% 10% 6% 11%
Brent Crude Oil 36%
-36%
26% 9% 6% 11%
Henry Hub Natural gas 25%
-52%
47% 4% 4% 4%
Source: LME, LBMA, LPPM, TEX, NYMEX, RBS forecasts
The Royal Bank of Scotland
Quarterly Commodity Companion | 1 October 2009
21
RBS quarterly average commodity price forecasts, 2009-10F
2009F 2010F
1QA 2QA 3QA 4QF
2009F
1QF 2QF 3QF 4QF
2010F
Base metals
Aluminium US¢/lb 62 67 82 87
75
85 95 85 95
90
US$/t 1,360 1,488 1,806 1,925
1,645
1,900 2,100 1,900 2,100
2,000
Copper US¢/lb 156 212 265 290
230
295 320 295 320
305
US$/t 3,435 4,675 5,839 6,350
5,075
6,500 7,000 6,500 7,000
6,750
Lead US¢/lb 53 68 87 101
77
102 107 98 102
102
US$/t 1,159 1,505 1,924 2,225
1,700
2,250 2,350 2,150 2,250
2,250
Zinc US¢/lb 53 67 80 87
72
88 95 88 95
92
US$/t 1,173 1,475 1,756 1,925
1,585
1,950 2,100 1,950 2,100
2,025
Nickel US$/lb 4.74 5.89 8.00 8.05
6.67
7.25 7.05 6.60 7.25
7.05
US$/t 10,455 12,986 17,608 17,750
14,700
16,000 15,500 14,500 16,000
15,500
Tin US$/lb 5.00 6.14 6.60 7.25
6.25
7.05 7.50 7.05 7.50
7.25
US$/t 11,012 13,538 14,563 16,000
13,775
15,500 16,500 15,500 16,500
16,000
Precious metals
Gold US$/oz 908 922 960 1,010
950
1,050 1,000 950 1,000
1,000
Silver US$/oz 12.60 13.76 14.69 17.00
14.50
18.50 17.50 16.50 17.50
17.50
Platinum US$/oz 1,023 1,172 1,230 1,375
1,200
1,400 1,450 1,450 1,500
1,450
Palladium US$/oz 199 234 272 295
250
325 350 350 375
350
Oil & Natgas
WTI Crude Oil US$/bbl 43 60 68 75
62
75 75 80 80
78
Brent Crude Oil US$/bbl 46 60 69 77
63
77 77 82 82
79
Henry Hub
Natural gas
US$/MM
Btu
4.47 3.81 3.44 5.25
4.25
5.75 6.25 6.50 6.50
6.25
Half-year average price assumptions, 2009-13F
2009F 2010F 2011F 2012F 2013F
1HA 2HF 1HF 2HF 1HF 2HF 1HF 2HF 1HF 2HF
Base metals
Aluminium US¢/lb 65 85 90 90 95 105 110 120 125 135
US$/t 1,424 1,865 2,000 2,000 2,100 2,300 2,425 2,625 2,750 3,000
Copper US¢/lb 185 278 308 308 320 340 365 385 385 430
US$/t 4,055 6,095 6,750 6,750 7,000 7,500 8,000 8,500 8,500 9,500
Lead US¢/lb 60 94 105 100 107 111 111 118 120 125
US$/t 1,332 2,075 2,300 2,200 2,350 2,450 2,450 2,600 2,700 2,800
Zinc US¢/lb 60 84 92 92 95 100 107 111 115 120
US$/t 1,324 1,841 2,025 2,025 2,100 2,200 2,350 2,450 2,500 2,600
Nickel US$/lb 5.30 8.03 7.15 6.90 7.50 8.40 8.40 9.05 10.00 10.90
US$/t 11,721 17,679 15,750 15,250 16,500 18,500 18,500 20,000 22,000 24,000
Tin US$/lb 5.55 6.93 7.25 7.25 7.70 7.95 7.95 8.15 8.30 8.05
US$/t 12,275 15,281 16,000 16,000 17,000 17,500 17,500 18,000 18,250 17,750
Precious metals
Gold US$/oz 915 985 1,025 975 1,000 950 1,000 1,000 1,100 1,200
Silver US$/oz 13.18 15.85 18.00 17.00 16.50 15.50 16.50 17.00 18.00 20.00
Platinum US$/oz 1,098 1,303 1,425 1,475 1,600 1,500 1,600 1,600 1,700 1,900
Palladium US$/oz 217 284 338 363 400 400 450 500 600 700
Source: LME, LBMA, LPPM, TEX, NYMEX, RBS forecasts
The Royal Bank of Scotland
Quarterly Commodity Companion | 1 October 2009
22
Changes in RBS commodity price forecasts since our April 2009
Commodity Companion - Bridge over troubled water
2009F 2010F 2011F 2012F LT
Base metals
Aluminium 6% 7% 5% -1% 0%
Copper 21% 23% 21% 25% 29%
Lead 27% 45% 41% 29% 31%
Zinc 11% 9% 2% 4% 16%
Nickel 27% 17% 18% 17% 13%
Tin 12% 9% 15% 13% 5%
Precious metals
Gold 0% 0% 8% 18% 10%
Silver 10% 23% 28% 49% 13%
Platinum 0% 4% 19% 33% 17%
Palladium 0% 0% 0% 36% 14%
Bulks
Fe - fines 0% 5% 5% 5% 33%
Fe - lump 0% -2% -2% 3% 0%
Coal - Hard coking 0% 15% 11% 12% 16%
Coal - Semi soft coking 1% 3% 2% 2% 18%
Coal - LV PCI 0% 11% 5% 0% 14%
Coal - Thermal 0% 7% 3% 0% 18%
Oil & Natural gas
WTI Crude Oil 37% 41% 13% 20% 33%
Brent Crude Oil 35% 41% 14% 20% 34%
Henry Hub Natural gas 0% 4% n/a n/a 8%
Source: RBS forecasts
The Royal Bank of Scotland
Quarterly Commodity Companion | 1 October 2009
23
Economic focus
No straight line to sustained expansion
Q3 09 back to expansion: Q3 GDP reports and the earnings season is still a
month away but the evidence available to date suggest that G7 GDP will be up
around 2.5% q/q annualised. This would follow deepest and longest post war
contraction of close to 6% on average over the previous 3 quarters. Q3 G7 GDP
is now forecast to be a little stronger than was the case a month ago, as the
upside risks we had highlighted in Europe have materialised.
However, in light of the contraction experienced, this would still be a relative
modest expansion, leaving G7 output close to 4% lower than a year ago. With
the global economy having successfully returned to positive growth in Q3, the
focus remains squarely on its ability to sustain any expansion into next year.
Importantly, we expect the economic news flow to become more mixed over Q4,
a development which will no doubt leave the debate about the shape of the
recovery wide open.
Fears of double dip to regain traction momentarily: Our view that the
probability of double dip is low remains unchanged. At the same, we recognise
that the path to sustainable recovery is unlikely to be a straight line. The first
important test to that view will come in the coming weeks as we expect a
temporary slowdown in the pace of expansion in G7 output in Q4. This forecast
is largely based on the idea that part of the expansion in Q3, especially in the
US, was borrowed from Q4/Q1. A temporary contraction in US consumer
spending in Q4 – which remains our base case scenario – will likely be the most
significant bad news to digest for the market as this will no doubt revive fears of
a double dip.
The end of the “cash for clunkers” and of the homebuyer tax credit
(expiring on November 30
th
) are the main culprits behind this moderation in
growth in Q4. Europe also appears to be exposed in the short term to the
phasing out of the car scrappage incentive schemes which is expected to
dampen euro area GDP in Q4 relative to Q3.
Road to sustainable recovery unlikely to be a straight line: Navigating
through what we believe is going to be a much more mixed batch of economic
data will not be easy. In that context, labour market developments will become
the most relevant gauge to assess how sustainable the recovery will be. The key
signposts are in the US, a bottoming out of the contraction in payrolls over Q4
and in Europe a further slow down in the pace of increase in unemployment.
Should labour market developments depart significantly from our expectation,
we would be forced to reassess our forecast for H1.
Economics editor
Jacques Cailloux
Chief European Economist
+ 44 207 085 4757
Economics - contents
Page
Key economics and FX forecasts
24
Regional updates
United States
25
Euro area
27
Japan
29
Non-Japan Asia
30
FX
31
China Special
32
The Royal Bank of Scotland
Quarterly Commodity Companion | 1 October 2009
24
2006 2007 2008 2009F 2010F
Real GDP - Calendar % ch YOY
US 2.8 2.0 1.1
-2.6
3.2
Japan 2.0 2.4
-0.7 -5.8
0.9
China 11.6 13.0 9.0 8.0 8.0
Euro area 3.0 2.6 0.6
-3.8
0.9
UK 2.9 3.0 0.6
-4.3
1.5
World GDP
5.1 5.2 2.8 -0.8 3.6
Industrial production - % change YOY
US 1.3 2.0
-2.2 -5.6
3.7
Euro Area 5.0 1.7
-3.6 -13.5
2.3
UK 0.5 1.0
-3.1 -9.7
1.8
Japan 5.4 2.9
-3.4 -23.0
13.0
Consumer Price Inflation – headline - end year, % change YOY
US 3.23 2.00 3.8 1.2 2.6
Japan 0.25 0.06 1.4
-1.4 -1.4
China 1.47 4.77 5.9
-0.9
2.0
Euro area 2.18 2.13 3.3 0.3 1.1
UK 2.3 2.3 3.6 2.1 2.0
World
3.5 3.8 4.7 1.6 2.3
Policy rate - end year, %
US 5.25 4.25 0.14 0.15 3.00
Japan 0.25 0.50 0.10 0.10 0.10
Euro Area 3.50 4.00 2.50 1.00 1.00
UK 5.00 5.50 2.00 0.50 1.50
Key commodity currency - FX forecasts – end period
Q3 09 Q4 09 Q1 10 Q2 10 Q3 10 Q4 10 Q1-11 Q2-11
Rates per US dollar
AUD* 0.86 0.89 0.86 0.84 0.82 0.80 0.78 0.78
CAD 1.08 1.02 1.00 1.05 0.99 0.98 1.02 1.04
ZAR 7.60 8.00 9.00 9.00 8.70 8.60 8.60 8.60
CLP 553 540 550 580 550 500 490 490
CNY 6.83 6.80 6.70 6.60 6.50 6.40 6.30 6.20
INR 48.6 43.0 44.0 45.0 45.0 46.0 47.0 48.0
RUB 30.7 36.0 37.0 36.0 35.0 35.0 34.0 34.0
TRY 1.50 1.55 1.65 1.57 1.55 1.53 1.62 1.67
JPY 91 91 89 90 93 96 99 102
GBP* 1.67 1.66 1.62 1.63 1.68 1.71 1.62 1.62
Rates per euro
USD 1.46 1.48 1.42 1.40 1.38 1.35 1.28 1.26
JPY 133 135 126 126 128 130 127 129
GBP 0.87 0.89 0.88 0.86 0.82 0.79 0.79 0.78
Source: RBS forecasts
* Currency at head column per currency at end row
Source: IMF, RBS forecasts
RBS world GDP growth forecast %
change yoy. Rebound on its way
-1
0
1
2
3
4
5
6
90 94 98 02 06 10F
Source: Bloomberg, RBS forecasts
Federal funds target rate %
0
1
2
3
4
5
6
7
8
9
1990 1994 1998 2002 2006 2010F
Source: Bloomberg, RBS forecasts
EUR/USD
0.80
0.90
1.00
1.10
1.20
1.30
1.40
1.50
1.60
1990 1994 1998 2002 2006 2010F
RBS economics, rates and FX forecasts
The Royal Bank of Scotland
Quarterly Commodity Companion | 1 October 2009
25
US
Minding our levels and changes
There are instances when the economy is especially difficult to forecast, most
notably around turning points. The present situation is particularly tricky, even for
a turning point, for a variety of reasons. This recession has been the longest and
most severe since the 1930s, and has included a major financial sector crisis
that has not been entirely resolved. Thus, at this stage, there are very few
appropriate precedents to fall back on, especially since the only two recessions
in the past 25 years were both extraordinarily shallow and short, followed by
extended periods of halting, sub-par growth.
One distinction that is absolutely critical is the difference between levels and
changes. This sounds simple enough, but judging from the discussions in the
markets over the past few months, it has proven quite difficult. This distinction is
most critical when coming out of a recession, especially a deep one, since the
level of activity is low (disastrously so in the current episode) and will remain so
for quite some time no matter how fast the economy recovers. It may seem
paradoxical to some, but the lower the level of activity, the more vigorously
growth can (and should) rebound to bring the economy back toward equilibrium.
Indeed, this idea is embodied in the so-called Zarnowitz rule (named after Victor
Zarnowitz): deep recessions are almost always followed by rapid rebounds.
The Zarnowitz rule amounts to empirical support for a V-shaped recovery, but
there is widespread skepticism that the economy will be able to generate
momentum, even from the current depressed levels of activity. Indeed, even our
relatively optimistic forecast falls well short of a full-fledged V-shaped recovery
(in the 1970s and 1980s, recessions that were severe but less so than the latest
one were followed by bursts of around 6% real growth in the first year of
recovery). Still, we believe that at least some of the pessimism currently being
exhibited regarding the forthcoming recovery reflects confusion between levels
and changes. In particular, because the focus is almost always on changes (we
typically think about output in terms of GDP growth, about prices in terms of
inflation, and employment in terms of the change in payroll jobs), many ideas
these days are being applied to changes that more appropriately should be
thought about in level terms.
Two concepts may help to clarify the distinction
1. Activity will be depressed for a long time but growth can be explosive.
Having contracted by about 4% over the past 18 months, the economy stands at
incredibly low levels of activity, as illustrated by an unemployment rate nearing
10% and a capacity utilisation rate below 70%.
Indeed, in a variety of sectors, the level of activity swooned to an unsustainably
depressed level in early 2009, as businesses and households were paralysed by
uncertainty amid a financial and economic crisis. The best example is residential
construction, but a similar story can be told to varying degrees for other sectors,
such as auto sales and business investment in equipment and software.
Changes in production (ie output) tend to be even more volatile than demand
coming out of a deep recession due to the inventory cycle. In the early stages of
a recession, firms tend to be caught flat-footed, and they do not adjust output
downward fast enough to keep up with weakening sales. At some point in the
cycle, businesses slash production to a level that is even lower than the
depressed pace of sales (eg the automakers in the spring).
Stephen Stanley
Chief US Economist
+1 203 897 2818