The Copper Market scotia capital (2006)
Bạn đang xem bản rút gọn của tài liệu. Xem và tải ngay bản đầy đủ của tài liệu tại đây (2.37 MB, 278 trang )
November 2006
Alec Kodatsky, MBA – (416) 863-7141
Onno Rutten, MSc, MBA – (416) 863-7484
Jasmit Gouri, MBA – (416) 863-7623
Alex Terentiew, P.Geo. – (416) 863-7284
Materials – Metals & Mining Research
Down to the Wire
Metals & Mining
The Copper Market
Copper_Nov06_Cover:Copper_Nov06_Cover.qxd 11/16/2006 10:41 AM Page 1
1
The Copper Market – Down to the Wire November 2006
Contents
1. The Copper Market: Down to the Wire 5
Copper Price and Equity Outlook 5
Long-Term Price Outlook – Modestly Moving Higher 7
Three Key Copper Themes – Chinese Demand, Resources, and Industry Costs 8
Zinc and Molybdenum Outlook – No Relief Until 2008 11
Target Prices and Recommendations 12
2. Copper Market Outlook 15
Macroeconomic Outlook – Solid but Slower 15
Price Modelling – The Fund-Driven Supercycle 18
Copper Price Outlook – Walking the Tightrope in 2007 19
Supply – Mines, Smelters, Refineries, and Disruptions 21
Demand Outlook – After the Rebound 23
Scrap and Substitution – Should We Be Worried? 26
3. The Future of Copper Demand 31
Spotlight on China – Critical to the Copper Story 31
Measuring China’s Appetite – What’s in a Number? 34
Current Demand – Is China Living up to Expectations? 37
Historical Perspective – Emerging vs Maturing Demand 38
Stress Testing Our China Forecast – Going Aggressive 41
The Other BRICs – Synchronized Growth? 44
4. Long-Term Copper Industry Outlook 49
Copper Reserves – Regional Disparities 49
Project Analysis – Timing, Quality, and Location 54
Mine Supply – Lower Grade and Higher Cost 58
Operating Costs – A Trend Reversal? 61
Industry Operating Margins – At The Peak? 65
Long-Term Pricing – Modestly Moving Higher 66
Industry Break-Even Analysis – The Alternate Approach 68
Real Copper Prices – The Historical Perspective 69
5. Zinc – No Relief Until 2008 71
The Perfect Peak Price Scenario 71
Strong Chinese Zinc Production – No Need for Alarm 73
A Physical Surplus Should Emerge in 2008 75
Increasing Our Long-Term Zinc Price to $0.60/lb 76
6. Molybdenum – By-Product No More 79
Demand Analysis – Stainless Steel Production the Key Driver 80
Supply Analysis – The Ever-shifting Supply Bottleneck 82
Price Forecast 88
For Reg AC Certification and important disclosures see Appendix A of this report.
2
November 2006 The Copper Market – Down to the Wire
7. Equity Valuation – Pick Your Spot in the Cycle! 91
Valuation Multiples and Targets – Cyclical Compression 91
Growth and Leverage – Torque for the Cycle 95
Net Asset Value – The Acquirer’s Viewpoint 98
Comparative Pages – Copper and Zinc Equities 104
First Quantum Minerals Ltd.: Not Your Average African Copper Play 109
Investment Highlights 109
An African Copper Play with Substantial Growth & Expansion Upside 110
Short-Term Strategy – Execution of Existing Project Portfolio 117
Long-Term Strategy – Growth Through Acquisition and Exploration 118
Key Financial Assumptions 120
Management 123
Investment Risks 124
Valuation 126
Frontera Copper Corporation: Pure-Play Mexican Copper 135
Investment Highlights 135
Frontera – Pure-Play Copper 137
Short-Term Strategy – Successful Mine Development and Operational Execution 140
Long-Term Strategy – Where Will Growth Come From? 140
Key Financial Assumptions 141
Management 143
Investment Risks 144
Valuation 146
HudBay Minerals Inc.: Integrated Value 153
Investment Highlights 153
Investment Thesis: Integrated Value and the Search for Growth 154
Business Description 155
Short-Term Strategy: De-leverage 158
Long-Term Strategy: Search for Growth 158
Key Financial Assumptions 160
Management 164
Investment Risks 165
Valuation 167
Lundin Mining Corporation: Striving for Senior Status 177
Investment Highlights 177
The Near-Term Future of Lundin – Growth Through Zinc 181
Short-Term Strategy – Increased Zinc Leverage 187
Long-Term Strategy –
Search for Growth; Opportunities Limited Only by Imagination 188
Key Assumptions 189
Management 193
Investment Risks 195
Valuation 197
3
The Copper Market – Down to the Wire November 2006
Phelps Dodge Corporation: In the Eye of a Copper Storm 207
Investment Highlights 207
Investment Thesis – Pure Copper/Moly Exposure 209
Business Description 210
Operational Structure 214
Reversible and Irreversible Trends in Production and Costs 218
Reserve Outlook 223
Phelps Dodge’s Core Assets – Low-Grade, Long Life 225
The Project Pipeline – Gaining Momentum 229
Management 234
Investment Risks 235
Valuation 236
Appendix 1 – A Primer on Copper 251
Where Does Copper Come From? 251
What Do We Do with All This Refined Metal? 252
Primary First-Use Product Groups 252
Primary Industry Sectors 253
The Regional Nature of the Copper Business 253
Appendix 2 – Mine, Smelter, and Refinery Project Listing 255
Sources of New Mine Supply 255
Appendix 3 – Copper Technology Overview 261
Glossary of Terms and Abbreviations 269
All share prices and unit prices as at November 3, 2006, unless otherwise stated.
All figures in U.S. dollars, unless otherwise stated.
4
November 2006 The Copper Market – Down to the Wire
This page intentionally left blank.
5
The Copper Market – Down to the Wire November 2006
1. The Copper Market: Down to the Wire
Copper Price and Equity Outlook
In recent years the global copper industry has struggled with the challenge of bringing
adequate supply to market to satisfy increased metal demand. This struggle has resulted
not only in fundamental tightness throughout the industry value chain but has also attracted
the attention of the speculative community, introducing a new, perhaps alternative, dimension
to the forecasting of base metal prices. We see future copper demand growth, particularly in
China, and the evolution of the mine supply response as being critical fundamental factors for
copper prices for the foreseeable future. We expect this to be further enhanced by the
continued influence of the speculative elements in the market.
While we acknowledge that currently the physical market remains tight and there is a
lack of mine supply, we do not foresee a critical shortage of copper in the near to
medium term and believe that what is now a roughly balanced refined market is set to
swing into a modest surplus in 2007. With the physical market set to turn, leading to a
sympathetic decline in copper prices, we are entering a critical juncture in the current
commodity price cycle, with significant implications for North American copper equities.
Although eventually softening from current levels, we do expect copper prices to remain
well supported at levels significantly above historical norms. Existing producers should
therefore enjoy a protracted period of above-average margins, generally making for a
favourable investment climate within this segment. In this report, we provide a
comprehensive overview of the copper industry, specifically addressing a number of topical
technical and market issues related to future supply and demand for copper. To supplement
this review of the global copper landscape, we are also introducing research coverage on five
copper producing equities, while noting that some of these companies also produce
significant amounts of other metals (namely, zinc).
Our new coverage includes Phelps Dodge Corporation (2-Sector Perform), Lundin
Mining Corporation (2-Sector Perform), HudBay Minerals Inc. (2-Sector Perform),
Frontera Copper Corporation (2-Sector Perform), and First Quantum Minerals Ltd.
(3-Sector Underperform). This supplements our existing coverage of Teck Cominco Ltd.
(1-Sector Outperform), Inmet Mining Corp. (1-Sector Outperform), and Aur Resources
Inc. (2-Sector Perform). We base our valuations on a 2007E copper price of $2.27/lb, and a
long-term copper price assumption of $1.15/lb – refer to Exhibit 1.1.
Exhibit 1.1 – Scotia Capital Copper Forecast
2004 2005 2006E 2007E 2008E Long-Term
Scotia Fundamental Forecast ($/lb LME Cash) $1.30 $1.67 $1.45 $1.48 $1.30 $1.15
Scotia Fund Affected Forecast ($/lb LME Cash) $3.11 $2.27 $1.47 $1.15
Global Refined Production (000 tonnes) 15,918 16,660 17,749 18,643 19,629
Change in Global Refined Production (YOY % change) 4.2% 4.7% 6.5% 5.0% 5.3%
Global Refined Consumption (000 tonnes) 16,983 16,905 17,746 18,485 19,235
Change in Global Refined Consumption (YOY % change) 9.3% -0.5% 5.0% 4.2% 4.1%
Annual Copper Surplus (Deficit) (000 tonnes) -1,065 -265 2 158 394
Mine Supply (000 tonnes) 11,897 12,264 12,581 13,210 13,590
Total Exhange Stocks (000 tonnes) 125 156 147 239 860
LME Stock Level (000 tonnes, year-end) 49 78 95 144 516
LME Stock Level (days of consumption) 1.1 1.7 2.0 2.8 9.8
U.S. Dollar - Trade-Weighted (mid-2004 = 1.00) 0.970 0.962 0.940 0.901 0.927 0.927
Source: Reuters; Brook Hunt (2004-2005); FAME; Scotia Capital estimates (2006 onwards).
6
November 2006 The Copper Market – Down to the Wire
Near term, we expect positive fundamental demand and sustained speculative
investment in commodities to prove highly supportive of copper prices through at least
Q1/07. Only towards the middle of 2007 do we see the stage set for substantial declines in
copper prices as the market begins to enter its traditional seasonally weak demand period, and
we expect commodity investment will begin to wane as a result of a weakening global
economic outlook. Exhibit 1.2 outlines our quarterly copper price estimates through 2008.
Going forward, we expect fairly flat but benign growth in Industrial Production (IP) in
the G7 of 2% in 2007 and 2008, a factor that should prove supportive to copper
demand. Our stable economic outlook is premised on our expectations that past interest rate
hikes in the G7 economies have led to a gradual slowing in global economic activity. We
believe this view is playing out, as witnessed by moderating IP growth in the United States
and Japan, and the outlook provided by the OECD leading indicator signals that G7 IP growth
should begin to decline in all main economies in 2H/06. We would note that, historically,
base metal prices in general follow the direction of IP growth. All current indicators suggest
that the major Western world economies remain reasonably healthy, a factor that is highly
supportive of the underlying demand for base metals. The rapid deterioration of the U.S.
housing sector in recent months has heightened market concerns regarding the health of the
U.S. economy, and we believe a worse-than-expected slowdown in this sector poses the most
direct threat to our economic outlook as we are only projecting a modest U.S. slowdown.
Chinese IP growth continued at a rate of approximately 19% for most of 2006; however,
we would view further acceleration from here as unlikely. Therefore, our expectation is
for continued strong but stable Chinese metal consumption growth in 2007, with similar
absolute incremental levels in demand as those observed in 2006. We expect metal
consumption growth to be contained by a slowdown in IP growth from current levels as the
quality of economic growth deteriorates and a base effect takes hold. We forecast Chinese IP
growth of some 19% in 2006, 16% in 2007, and 14% in 2008.
We base our copper supply/demand balance and copper price forecast on the following:
Forecast supply of refined copper is expected to increase 6.5% to 17.7 million tonnes
in 2006 and by an additional 5.0% to 18.6 million tonnes in 2007 (including SX-EW
output). We believe that the expected capacity utilization improvements in 2006 and 2007
will yield modest incremental increases in output.
Expected global refined copper demand to increase 5.0% to 17.7 million tonnes in
2006 and by a further 4.2% to 18.5 million tonnes in 2007. Our expected demand
figures reflect our view of softer but positive levels of Western world and Chinese IP
growth in 2007 of 2% and 16%, respectively.
We do not believe that widespread inventory restocking will take place at current
high commodity price levels and 2007 consumption levels should therefore more
closely reflect regional IP growth rates. Therefore, we do not expect that demand will
exceed historical trend growth rates in 2006 or 2007.
We expect a moderation of investment fund flows into copper in 2007 relative to
estimated 2005 and 2006 inflows. This view is backstopped by our belief that commodity
investors will begin cashing out existing positions in order to realize profits and that the
market will begin to step away from highly levered instruments to the economic cycle
(such as commodities) at the back end of the current economic cycle.
Exhibit 1.2 – Scotia Capital Quarterly Copper Price Forecast
Q4 2006E Q1 2007E Q2 2007E Q3 2007E Q4 2007E Q1 2008E Q2 2008E Q3 2008E Q4 2008E
Copper, LME Grade A Spot (US$/lb) $3.46 $3.28 $2.12 $1.83 $1.83 $1.70 $1.49 $1.38 $1.31
Source: Scotia Capital estimates.
7
The Copper Market – Down to the Wire November 2006
In our view, the biggest downside risk to our near-term copper price forecast is a
slowdown in the U.S. and/or Chinese economies resulting in copper consumption
significantly below our forecast. We believe it is unlikely that the supply side will be
able to substantially outperform our expectations and the risks are therefore skewed
towards the demand side.
On a fundamental basis, taking into account historical inventory/price relationships, we
believe that copper prices should average approximately $1.45/lb in 2006 and $1.48/lb in
2007. However, based on the observed and expected level of investment inflows, we
forecast average realized copper prices of $3.11/lb and $2.27/lb in 2006 and 2007,
respectively, substantially above our fundamental price levels.
Long-Term Price Outlook – Modestly Moving Higher
We have upwardly revised our long-term copper price assumption to $1.15/lb from
$1.00/lb, previously. This revision follows a more critical review of the revised industry
project incentive curve and deeper analysis of industry break-even copper prices. Our longer-
term expectations for copper are underpinned by the following assumptions:
The copper industry has had a very good success rate in replacing reserves and the
discovery of new economic ore bodies. There are currently approximately 28 years of
annual global consumption contained in identified global reserves. While this is one of the
lowest levels of consumption-weighted supply in the past 25 years, it is not what we would
consider a critical shortage and is sufficient to service demand requirements for the
foreseeable future.
Displacement between sources of mine supply, the smelting/refining conversion
complex, and end-users of copper is a feature of the industry that we believe will
remain intact for the medium term. For equity investors, we believe that this will mean
increased exposure to mine projects in riskier regions. Significant exploration work is
required around the globe to further expand the existing reserve base and identify the
potential of other “non-traditional” regions. We believe that given the increased levels of
capital intensity associated with developing mining operations, companies will be slow to
increase their appetite for risk in politically unstable regions in the absence of an adequate
return promoted by higher metal prices.
We believe that ultimately the copper industry will be capable of achieving our mine
production growth expectation given the geographic diversity of the projects and the
strong balance sheets of mining companies thanks to the current metal price
environment. Near to medium term, an adequate amount of new projects have been
identified and future supply is therefore dependent upon project execution. Significant
risks to project development remain, including permitting, financing risk, and development
risk. Equipment and labour availability also remains a key constraint, as copper projects
must directly compete with other mining and infrastructure projects. The copper industry
will be forced to build and commission a tremendous amount of new supply in order to
meet our forecast consumption levels. We believe this presents a substantial upside risk to
prices should our expectations fail to be met.
We do not see a material change in the operating cost profile in the next 10 years that
would cause a directional bias in our long-term forecast. While the projects coming
onstream are more capital intensive, operating costs are expected to remain near current
levels, so in our view, there is no structural trend towards a higher cost structure that would
necessitate higher long-term pricing.
We believe our $1.15/lb long-term copper price incites adequate new mine capacity
(even at a 15% IRR assumption) and allows the industry to realize our base case supply-
demand forecast. Given the capital cost expectations for longer-term development projects,
we believe this price is adequate to encourage the industry to continue to add new mine
supply beyond the 2010 horizon.
8
November 2006 The Copper Market – Down to the Wire
Three Key Copper Themes – Chinese Demand,
Resources, and Industry Costs
In this report we identify three key elements of the current copper market that we believe will
allow both the development of adequate new supply and the balancing of the physical market
in conjunction with lower forecast copper prices:
Spotlight on China – Critical to the Copper Story
We expect Chinese demand will remain healthy for the foreseeable future, but moderate
from recent growth rates. This makes the task of adding adequate supply to match
demand somewhat easier. Rapid economic growth and the urbanization of China have
precipitated an increase in copper consumption, but the investment community as a whole
struggles with the question: is this just the beginning, and when and where will it end? We
assert that monitoring five output metrics can capture seventy percent of Chinese copper
consumption, which makes the task of forecasting Chinese demand somewhat easier. These
metrics are: (1) installed power capacity, (2) air conditioner production, (3) refrigerator
production, (4) washing machine production, and (5) automobile production. We believe that
getting a good sense of how the demand from these sources will evolve over the 2006-2010
timeframe provides a good indication of total demand in the market, as we see little in the
way of the relative amounts of consumption held by each of these constituents changing by
the end of the decade.
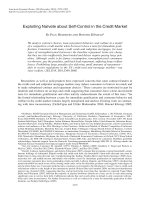
We believe that China’s copper demand will continue to grow until the end of the
decade at a CAGR of 7% (see Exhibit 1.3). Based on the analysis of historical per-capita
urban copper consumption rates in the U.S. and Japan, we believe that China will reach an
average copper consumption rate of 12 kg/urban person, subject to cyclical fluctuations. In
our base case forecast, we expect China to first achieve this consumption rate in 2015.
We expect another 10 years of consistent growth in Chinese copper consumption, but
believe we are already over halfway through the current developmental cycle as we are
already 16 years into the consumption expansion process. The implication is that we do
not expect the current growth to extend by another 20-30 years.
Exhibit 1.3 – We Expect China’s Copper Consumption Growth Trend to Stay Intact
Until 2015
0
2
4
6
8
10
12
14
19
50
195
3
1956
1
959
196
2
1965
1
968
19
71
1974
1977
19
80
1983
1986
19
89
19
92
1995
19
98
20
01
200
4
20
07
20
10
201
3
Copper Consumption (kg/person)
0%
5%
10%
15%
20%
25%
30%
35%
40%
45%
50%
Urbanization Rate
Total Urban Urban Pop (%)
ForecastHistorical
Source: Brook Hunt; UN; Scotia Capital estimates.
9
The Copper Market – Down to the Wire November 2006
Copper Resources Are Adequate – Project Execution Is Key
In our view, there are adequate resources of copper already identified to serve near- and
medium-term demand needs, but the key to its development is dependent upon
economics and project execution.
In looking at the historical evolution of copper reserves on an absolute and relative
basis, we conclude that future copper supply may not be as tenuous as the market
believes. Exhibit 1.4 outlines stated proven and probable reserves for each key producing
region dating back to 1980. It is important to note that the total reserves presented exclude the
significant amount of material categorized as resources (potentially from the same ore bodies
containing identified proven and probable reserves), which over time could be upgraded into
the reserve category. From a general perspective, we would note that:
The absolute tonnage of copper in reserves has substantially increased over the past 25
years. The total amount of identified copper reserves on an absolute basis has increased
roughly 50% over the past 25 years, currently totalling 471 million tonnes of copper.
Over the past 25 years, identified reserves in terms of annual consumption have declined
by only five years, suggesting that the industry has had a very good success rate of
replacing reserves and discovering new economic ore bodies. There are currently
approximately 28 years of annual global consumption contained in identified global
reserves. While this is one of the lowest levels of consumption-weighted supply in the past
25 years, it is not what we would consider a critical shortage.
Exhibit 1.4 – There’s More Than Enough Copper to Go Around!
Mt Contained Copper P&P Reserves 1980 1985 1990 1995 2000 2001 2002 2003 2004
2
7
12
17
22
23
24
25
26
1 Chile 66 86 87 120 130 131 120 139 144
2 Congo D.R. 60 60 60 60 60 60 55 55 57
3 Peru 6 5 5 19 26 27 24 27 37
4Indonesia 1 1 7283234343536
5Mongolia 88887761525
6Mexico 141121162525272622
7 USA 34 21 30 33 28 24 25 24 22
8 Kazakhstan 0 0 0 0 12 12 12 18 19
9Australia 5 5 6192019191918
10 Poland 26 26 26 18 16 17 16 18 17
11Canada 161311111098911
12 Others 78 60 73 101 90 91 87 64 63
Total Identifed Reserves 313 297 333 431 455 454 433 448 471
Years of Identified Reserves @ Consumption
of the day
33 30 30 35 30 31 29 29 28
©Brook Hunt Ltd. 2006
Source: Brook Hunt.
10
November 2006 The Copper Market – Down to the Wire
Operating Margins Are Unsustainable
Despite the observed industry cost pressures, 2006 real cash margins for copper
producers are at their highest point in 30 years and we expect they will remain above
historical norms through 2008. Exhibit 1.5 demonstrates the significant increase since
2003 in copper industry cash margins, which we
have defined as the LME average copper price in
the year less the average cash cost for the industry
(shown in real 2005 dollars). Based on our forecast
copper prices and industry costs, we expect cash
margins in the copper industry to remain robust in
2007 and 2008, with the industry reporting an
estimated average cash margin of $1.51/lb and
$0.75/lb in those years.
Generally, we believe current cash operating
margins in the copper industry are at
unsustainably high levels. As highlighted in
Exhibit 1.6, we estimate that industry cash margins
on a real 2005-dollar basis averaged $0.53/lb during
the 1975-2004 period, over which time the copper
industry was able to function sustainably.
Given the ability of the industry to generate above-
average margins at our forecast copper prices,
which are well below current price levels, even in
an elevated operating cost environment, we do not
believe recent operating cost increases are
substantial enough to (1) justify the current copper
price or (2) act as a supportive element for pricing at
current levels in the future. We feel the industry is
currently experiencing real cash costs similar to the
levels seen in the 1995-1996 period, when the average
LME price was $1.50/lb in real terms. This suggests to
us that even at current cost levels, the copper industry
can operate profitably and sustainably at prices
substantially below current levels.
Exhibit 1.6 – Unprecedented Industry Margins
$/lb
% of Ave LME
Price
$0.53 38%
$1.44 65%
$2.33 73%
Average Cash Margin 1975-2004
Average Cash Margin 2005-2008E
Average Cash Margin 2006E
Note: All data based on Q4/05 analysis and 2004$ Capital and
Operating Costs.
Source: Base Case – © Brook Hunt; Stretch Case – Scotia
Capital estimate (beyond 2005).
Exhibit 1.5 – Real Cash Margins Remain at
Unsustainable Levels
$0.00
$0.50
$1.00
$1.50
$2.00
$2.50
1980
1981
1982
1983
1984
1985
1986
1987
1988
1989
1990
1991
1992
1993
1994
1995
1996
1997
1998
1999
2000
2001
2002
2003
2004E
2005E
2006E
2007E
2008E
0%
10%
20%
30%
40%
50%
60%
70%
80%
Average Cash Margin($/lb) AverageCash Margin (% of LME Average)
Note: All data based on Q4/05 analysis and 2004$ Capital and
Operating Costs.
Source: Base Case – © Brook Hunt; Stretch Case – Scotia
Capital estimate (beyond 2005).
11
The Copper Market – Down to the Wire November 2006
Zinc and Molybdenum Outlook – No Relief Until 2008
In conjunction with this report we have also updated our zinc outlook. Our 2006 zinc
price estimate is largely unchanged at $1.49/lb, while we have increased our 2007
forecast to $2.06/lb, from $1.48/lb previously. The higher price forecast in 2007 reflects our
expectations for zinc inventories to hit critically low levels equating to two days of
consumption in the second quarter of 2007, as well as the shift in market attitudes now that
zinc has broken through the $4,000/tonne price barrier. We are also revising our 2008 zinc
price estimate to $1.56/lb from $1.00/lb; our 2008 estimate is premised on our expectations
for the zinc market to turn into a decisive surplus due mainly to the completion of several zinc
projects (expansions and new mine start-ups) currently under construction around the globe,
see Exhibit 1.7.
Given its significance as a by-product of the global copper industry, we are also launching
formal coverage on the global molybdenum market. Our molybdenum price forecast for
2007 and 2008 is $25.25/lb and $19.25/lb, respectively. While taking into account an expected
expansion in Chinese production and at Cerro Verde, combined with roaster capacity additions,
we believe that continued strong growth rates in stainless and non-stainless applications will
continue to keep the molybdenum supply chain, both at the mine level and at the roaster level,
relatively tight. As approximately 72% of our modelled molybdenum consumption is tied
directly to austenitic output growth, we predict that molybdenum consumption will rise by 6.2%
in 2007 and 3.9% in 2008. Annual molybdenum production growth is expected to be limited to
five to six percent per annum until at least 2008, with the potential for significant growth only
emerging in 2009 and 2010, see Exhibit 1.8.
Exhibit 1.7 – Scotia Capital Zinc Forecast: We Do Not Expect a Definitive Surplus Until 2008
2004A 2005A 2006E 2007E 2008E Long-Term
Scotia Fundamental Zinc Forecast ($/lb LME Cash) $0.47 $0.63 $0.89 $1.21 $0.77
Scotia Fund Affected Zinc Forecast ($/lb LME Cash) $1.49 $2.06 $1.56 $0.60
Global Slab Zinc Supply (000 tonnes) 10,141 10,088 11,021 11,995 12,960
Change in Global Slab Zinc Supply (YOY % change) 2.6% -0.5% 9.3% 8.8% 8.0%
Global Slab Zinc Consumption (000 tonnes) 10,383 10,653 11,320 11,906 12,497
Change in Global Slab Zinc Consumption (YOY % change) 7.4% 2.6% 6.3% 5.2% 5.0%
Annual Slab Zinc Surplus (Deficit) (000 tonnes) (243) (566) (299) 89 463
Annual Zinc Concentrate Surplus (Deficit) (000 tonnes) (327) 20 (81) (2) 310
Mine Supply (000 tonnes) 9,585 9,858 10,715 11,720 12,753
LME Stock Level (000 tonnes, year-end) 629 394 87 165 475
LME Stock Level (weeks of consumption) 3.2 1.9 0.4 0.7 2.0
Source: Brook Hunt (2004, 2005); Scotia Capital estimates (2006E onwards).
Exhibit 1.8 – Scotia Capital Molybdenum Forecast: Also Expected to Remain Tight Until 2008
2004
A
2005
A
2006E 2007E 2008E 2009E Long-Term
Scotia Fundamental Molybdenum Oxide Price Forecast ($/lb) $17.14 $32.15 $26.25 $25.25 $19.25 $8.00 $7.50
Global Molybdenum Concentrate Production (million pounds) 389.8 389.2 411.6 432.6 460.2 500.2
Global Molybdenum Concentrate Production Growth (YOY% change) 14.5% -0.1% 5.8% 5.1% 6.4% 8.7%
Global Molybdenum Consumption (million pounds) 382.9 385.6 410.6 436.1 453.2 485.5
Global Molybdenum Consumption Growth (YOY% change) 11.3% 0.7% 6.5% 6.2% 3.9% 7.1%
Global Molybdenum Concentrate Surplus (Deficit) (M lbs) 6.9 3.6 1.1 (3.5) 7.0 14.7
Western World Stock Level (M lbs, year end) 123.6 123.9 123.3 120.5 126.2 138.3
Western World Stock Level (months of consumption) 4.4 4.7 4.4 4.0 4.0 4.2
World Stainless Steel Production Growth (YOY% change) 6.7% -1.0% 5.8% 5.4% 2.1% 6.7%
Source: CRU (2004, 2005); Scotia Capital estimates (2006E onwards).
12
November 2006 The Copper Market – Down to the Wire
Target Prices and Recommendations
Teck Cominco and Inmet remain our preferred equities, both
rated 1-Sector Outperform
Teck Cominco (C$90.00 per share one-year target, valued using a 4.25x 2007E
EV/EBITDA multiple), exhibits very strong cash generation in the current commodity
price environment and is expected to accumulate roughly C$6.5 billion in cash by year-end
2007. We expect that there is a good probability that much of this accumulated capital will
be reinvested in large-scale oil sands investments. The company is also expected to remain
active in the acquisition of mining assets in non-LME linked commodities to diversify its
revenue base following the failed attempt to enter the nickel market. We anticipate the
company will complete the production ramp-up of its Pogo gold mine in early 2007,
followed by a spin-off of the company’s gold asset portfolio. As metallurgical coal and
copper prices are expected to decline in 2007, our preference for Teck Cominco is
predominantly premised on the anticipated strength in the zinc markets.
Inmet Mining (C$69.00 per share one-year target, valued using a 3.5x 2007E
EV/EBITDA multiple), should, we expect, achieve near-term zinc production growth in
2007 resulting from a significant capacity expansion at its Cayeli mine, allowing the
company to benefit from our expectations for record zinc prices in that year. We also
forecast a fairly sizeable increase in copper production in 2008 and beyond following the
commissioning of the Las Cruces copper project in Spain. In our view, 2006 has seen a
relative lack of fundamental catalysts for Inmet, with metal price exposure explaining
much of the share price gains observed year-to-date. The company maintains a very strong
balance sheet and has suggested that potential growth initiatives would be sizeable in
nature that, while challenging in our view given the company’s relatively smaller size,
could provide shareholders with further growth. We remain attracted to the name in light
of the noted future metal production growth which we expect will emerge as an upside
catalyst for the company in 2007, as well as its diversified revenue base (60% copper, 25%
zinc and 15% gold), and extreme financial leverage to metal prices. We find Inmet shares
very compelling value at current levels.
Exhibit 1.9 – Scotia Capital Metals & Mining Research – Copper & Zinc Equity Ratings and Rankings
Target Target Target Target
Price 1-year Rate of EV/EBITD
A
P/E P/CF P/NAV
Ticker 3-Nov-06 Target Return Rating
A
nalyst 2007E 2007E 2007E (@ 8%) Div (NTM)
Copper
Phelps Dodge
PD-N $99.58 $96.00 6.6% 2-Sector Perform Rutten 4.00 8.1 5.1 1.75 $10.13
First Quantum
FM-T C$61.32 C$58.00 -4.3% 3-Sector Underperform Kodatsky 3.75 7.0 5.4 1.50 $0.64
Aur
AUR-T C$21.00 C$23.00 10.0% 2-Sector Perform Kodatsky 3.50 7.9 5.1 1.47 $0.09
Inmet
IMN-T C$55.40 C$69.00 24.9% 1-Sector Outperform Kodatsky 3.50 6.5 5.8 1.45 C$0.20
Frontera
FCC-T C$4.65 C$5.20 11.8% 2-Sector Perform Kodatsky 3.00 5.1 4.3 1.23 $0.00
Zinc
Teck
TEK.B-T C$84.07 C$90.00 9.4% 1-Sector Outperform Rutten 4.25 9.1 7.8 1.31 C$2.00
Lundin
LUN-T C$40.90 C$43.50 6.4% 2-Sector Perform Kodatsky 3.75 6.6 5.1 1.23 $0.00
Hudbay
HBM-T C$19.28 C$20.00 3.7% 2-Sector Perform Kodatsky 3.50 5.9 4.4 1.18 C$0.00
Source: Reuters; Scotia Capital estimates.
13
The Copper Market – Down to the Wire November 2006
Phelps Dodge, Lundin, HudBay, Aur, and Frontera Are Rated
2-Sector Perform
Phelps Dodge ($96.00 per share one-year target, valued using a 4.0x 2007E
EV/EBITDA multiple), is a significant copper and molybdenum producer with many long-
life core assets in North and South America ranking fourth in terms of contained copper in
reserves and third in total production. Beyond the anticipated 16% increase in Phelps
Dodge’s pro-rated copper output in 2007E resulting from the Cerro Verde expansion,
another 10% growth in output by 2009-2010 is dependent on the decision to bring the
Tenke Fungurume project into production. Our target valuation multiple is in excess of the
multiple that has historically been awarded to Phelps Dodge at this point of the copper
price cycle, as we believe that an argument could be made for the expansion of valuation
multiples awarded to copper producers, relative to those awarded historically. Our target
price is supported by the valuation of Phelps Dodge, according to the copper forward curve
(estimated at $96 per share) and does not include a speculative M&A control premium,
which we believe could reach approximately 20% – i.e., a takeover value of $116 per share
can be projected based on recent precedent transactions. Alternatively, additional return of
capital to shareholders could provide upside, as we estimate that Phelps Dodge could
return $8.10 per share in regular and special dividends to its shareholders in 2007. Based
on our estimates, there remains ample further scope for the return of additional capital to
shareholders depending on management’s view on the commodity price cycle and its
corporate M&A ambitions.
Lundin Mining (C$43.50 per share one-year target, valued using a 3.75x 2007E
EV/EBITDA multiple) is a growth-oriented company with a primary operating base in
Western Europe. We estimate roughly 42% of 2006 revenues are derived from the sale
of zinc and 50% from copper. The underlying corporate strategy is to grow the company
into the senior ranks and fill the investment void left in the Canadian equity market by
the recent acquisitions of Inco and Falconbridge. The company’s near-term growth
opportunities are focused primarily on zinc, although we believe further acquisitions are
in the offing acting as a potential catalyst and value creator. Two of the company’s
longer-term development projects are located in Russia and Iran (creating increased
investment risk relative to the low-risk location of the company’s existing operating
assets) and while not currently integral to the company’s near-term valuation, could
change the risk profile of the company in the future should significant capital
expenditures be made. We would suggest the company is likely to make a copper/zinc
acquisition in the next 12 to 18 months; the size of the acquisition could be as high as
C$5 billion, according to management.
HudBay Minerals (C$20.00 per share one-year target, valued using a 3.5x 2007E
EV/EBITDA multiple) represents a rare investment in a completely integrated copper and
zinc producer operating exclusively within North America. Despite being vertically
integrated, HudBay’s operations are relatively high cost due to higher labour costs associated
with the North American labour force, but the company enjoys a level of stability seen in few
other mining regions in the world. We believe the market is willing to pay a premium for
HudBay’s integrated value, although, in our view, this should be somewhat offset until the
future growth profile of the company becomes clearer and a true catalyst can be identified.
We estimate that approximately 60% of HudBay’s 2007 revenues will be derived through the
sale of zinc, although our valuation suggests that much of our higher zinc price expectations
for 2007 already appear priced into HudBay’s shares.
14
November 2006 The Copper Market – Down to the Wire
Aur Resources (C$23.00 per share one-year target, valued using a 3.5x 2007E
EV/EBITDA multiple) is a mid-cap pure-play copper company whose valuation is
strongly tied to the direction of copper prices. The company maintains its core, stable low-
risk asset base in South America, with incremental copper and zinc production coming
online in early 2007 with the commencement of commercial production at the Duck Pond
project in Newfoundland. Further incremental copper production is expected to come by
way of the company’s Andocollo Hypogene project, which commenced development
during Q3/04 with the initial production target of late 2009. Record prices for copper have
allowed the company to generate strong cash flows enhancing what was already a strong
balance sheet. Aur has perpetually been the subject of take-out speculation given the
relatively good quality of its existing operating assets. While we have been of the view
that the company’s assets are likely too small to be of interest, we believe M&A
speculation has proven to be highly supportive of the company’s share price in recent
years and appears unlikely to dissipate in the near term.
Frontera Copper (C$5.20 per share one-year target, valued using a 3.0x 2007E
EV/EBITDA multiple) is an investment in a pure-play copper producer with a single
operating mine in Mexico. We look for sustained copper production growth throughout
1H/07 to act as a catalyst for Frontera’s share price despite our expectations for a
weakening copper price environment in 2007. We expect that copper prices will remain
significantly above historical averages throughout 2007, resulting in strong cash flow
generation which, we believe, will be a supportive factor for Frontera’s share price. Since
the company has limited growth prospects and remains unhedged, an investment in the
company should not only represent a degree of confidence in the long-term copper market
but should also represent a degree of confidence in the economics of the Piedras Verdes
open-pit project. We would also note the highly qualified professional backgrounds of the
company’s senior management, which we believe is a significant asset to Frontera and, in
our view, increases the chances of success at Piedras Verdes.
First Quantum is rated 3-Sector Underperform
First Quantum Minerals (C$58.00 per share one-year target, valued using a 3.75x
2007E EV/EBITDA multiple) is an almost pure-play copper producer, and we expect that
movements in the share price of First Quantum will closely reflect the direction of copper
prices. Generally, we expect the company’s project pipeline to yield sustained copper
production growth over the 2006-2008 time frame, but believe that much of this benefit is
already built into First Quantum’s share price. In our view, maintaining the current
production growth rate will become increasingly difficult going forward as the company
undertakes more challenging projects. Investor sentiment towards copper and the political
risk environment in Zambia and the Democratic Republic of Congo (DRC), we expect,
will also be influential intangible factors for the company’s valuation.
15
The Copper Market – Down to the Wire November 2006
2. Copper Market Outlook
Macroeconomic Outlook – Solid but Slower
Global economic growth proved modestly better than our expectations in 1H/06;
however, we believe that the initial signs of a slowdown have begun to emerge. The
continuation of strong economic growth resulted in the physical copper market being
somewhat tighter than we had forecast and, as a result, copper prices remained at levels well
in excess of our prior expectations. Although we have substantially increased our forecast
copper prices, we still believe macroeconomic conditions are softening, leading in part to a
softening of metal demand and prices in 2007.
Going forward, we expect fairly flat but benign growth in Industrial Production (IP) in
the G7 of 2% in 2007 and 2008, a factor that should prove supportive to copper
demand. Our stable economic outlook is premised on our expectations that past interest rate
hikes in the G7 economies have led to a gradual slowing in global economic activity. We
believe this view is playing out, as witnessed by moderating IP growth in the United States
and Japan, and the outlook provided by the OECD leading indicator signals that G7 IP growth
should begin to decline in all main economies in 2H/06 (Exhibit 2.1). Exhibit 2.2 highlights
that, historically, base metal prices (represented by the consumption-weighted LME Index) in
general follow the direction of IP growth. All current indicators suggest that the major
Western world economies remain reasonably healthy, a factor that is highly supportive of the
underlying demand for base metals. The rapid deterioration of the U.S. housing sector in
recent months has heightened market concerns regarding the health of the U.S. economy, and
we believe a worse-than-expected slowdown in this sector poses the most direct threat to our
economic outlook.
Exhibit 2.1 – OECD Leading Indicator Remains Strong but Is Softening…
-8%
-6%
-4%
-2%
0%
2%
4%
6%
8%
1987
1988
1989
1990
1991
1992
1993
1994
1995
1996
1997
1998
1999
2000
2001
2002
2003
2004
2005
2006
% Change Last 6 Month
s
G7 IP - 6 months ahead OECD Leading Indicator - G7
Source: OECD; Bloomberg; Scotia Capital estimates.
16
November 2006 The Copper Market – Down to the Wire
As noted above, we expect interest rates, particularly those in the United States, to begin
to have an indirect impact on metal pricing in 2006 and into 2007 due to their slowing
effect on global economic activity. Exhibit 2.3 highlights the relationship between the U.S.
Fed funds rate and the year-over-year change in the consumption-weighted LME Index.
Unsurprisingly, we observe that increases in base metal prices tend to coincide with rising
Fed rates. However, we would note that historically: (1) base metal prices rise most rapidly
two to three rate hikes prior to the last increase in the Fed funds rate and (2) prices begin to
enter a negative year-over-year trend shortly after the Fed stops raising rates. If we are to
believe that the Fed ended its series of rate hikes in August, and historical trends remain in
place, then we could be approaching a protracted period of declining gains in LME pricing.
Exhibit 2.2 – … Will the LME Complex Start to Weaken?
-40%
-20%
0%
20%
40%
60%
80%
1987
1988
1989
1990
1991
1992
1993
1994
1995
1996
1997
1998
1999
2000
2001
2002
2003
2004
2005
2006
6-month % Change in LME Inde
x
-6.0%
-4.0%
-2.0%
0.0%
2.0%
4.0%
6.0%
6-Month % Change in OECD L
LME Index (Primary Axis) OECD Leading Indicator - G7
Source: OECD; Bloomberg; Scotia Capital estimates.
Exhibit 2.3 – End of Fed Rate Hikes Historically Suggests Lower Metals Prices
0%
1%
2%
3%
4%
5%
6%
7%
8%
9%
10%
Mar-88
Mar-89
Mar-90
Mar-91
Mar-92
Mar-93
Mar-94
Mar-95
Mar-96
Mar-97
Mar-98
Mar-99
Mar-00
Mar-01
Mar-02
Mar-03
Mar-04
Mar-05
Mar-06
Fed Funds (%)
-40%
0%
40%
80%
120%
160%
Fed Funds LME Index (YOY%) - RHS
Source: Bloomberg; Scotia Capital estimates.
17
The Copper Market – Down to the Wire November 2006
We believe that based on current economic indicators, the G7 economies are unlikely
to produce IP or metal consumption growth significantly above our estimates. While
the OECD leading indicator shows positive but weakening growth in the United States,
other important indicators, such as a rapidly cooling U.S. housing sector and the persistence
of inflationary pressures, would suggest that a sharp reacceleration of the economy is
unlikely and undesirable. Exhibit 2.4 identifies the relationship between the U.S. yield
curve (ahead 12 months) and global industrial production growth. This chart suggests that
the recent flattening of the U.S. yield curve has created an environment that makes a strong
reacceleration in G7 IP unlikely and that the current positive trend in U.S. IP growth is
likely to begin slowing.
Chinese IP growth continues at a rate of approximately 19% year over year; however,
we would view further acceleration from here as unlikely. Therefore, our expectation is
for continued strong but stable Chinese metal consumption growth in 2006, with similar
absolute incremental levels in demand as those observed in 2005. We expect metal
consumption growth to be contained by a slowdown in IP growth from current levels as the
quality of economic growth deteriorates and a base effect takes hold. We now forecast
Chinese IP growth of some 19% in 2006, 16% in 2007, and 14% in 2008.
We witnessed a sharp rebound in global metals demand in 2006 to more normalized
growth levels; however, we do not believe that restocking will take place at current high
commodity price levels, and 2007 consumption levels should therefore more closely
reflect regional IP growth rates. While we had expected that base metal demand would re-
emerge from the generally low levels that were observed in 2005, we do not believe that
demand will exceed historical trend growth rates in 2006 or 2007. We believe that the
primary catalyst for above-trend metal consumption would be extensive restocking of the
metals supply chain. For restocking to occur, we believe that either prices will have to come
down to entice a refill of the value chain or a sharp acceleration in the global economy from
the current already solid levels would have to occur, which we believe is unlikely. We do
believe that the global supply chain is currently operating on reduced inventory levels and
will eventually need to be replenished. However, in our view, the extent and timing of this
restocking will be highly dependent upon the state of the global economy in 2006 and early
2007. We expect that the spectre of a slowing global economy will likely keep restocking
activities in check near term.
Exhibit 2.4 – U.S. Yield Curve Traditionally Leads IP Growth…
Is Current Strength Sustainable?
-10%
-5%
0%
5%
10%
15%
Feb-97 Feb-98 Feb-99 Feb-00 Feb-01 Feb-02 Feb-03 Feb-04 Feb-05 Feb-06
% change over previous year
-1.0
-0.5
0.0
0.5
1.0
1.5
2.0
2.5
3.0
G7 IP US IP US Gvt Bond - T Bill (12 month lead) - RHS
Source: Bloomberg; Scotia Capital estimates.
18
November 2006 The Copper Market – Down to the Wire
Price Modelling – The Fund-Driven Supercycle
Our fundamental commodity forecasts are based primarily on forecast LME inventory
levels that result from our global supply and demand assumptions. Our global supply
forecasts are determined by the net changes in expected production through the addition of new
projects and capacity increases, offset by expected closures or impairment of production. Global
metal consumption estimates are collectively based on our regional IP growth expectations. We
utilize the historical relationship between metal consumption and IP growth for each specific
region to derive our expected level of regional metal consumption. The price output from our
commodity price models is then subsequently adjusted for our U.S. trade-weighted dollar
expectations to incorporate the expected future impact of currency fluctuations on price. Further
to our fundamental pricing outlook, we add an incremental investment-driven level of
demand for copper based on estimated existing and expected levels of speculative fund
investments into the commodity space.
Our outlook for the level of investment demand for copper remains unchanged, as
generally on a net basis we expect moderation of fund flows into 2007 relative to
estimated 2005 and 2006 inflows. This view is backstopped by our belief that commodity
investors will begin cashing out existing positions in order to realize profits and that the
market will begin to step away from highly levered instruments to the economic cycle (such
as commodities) at the back end of the current economic cycle. In Exhibit 2.5 and 2.6, our
estimates show that year-to-date we have seen a net reduction in the level of speculative
investment in copper, which we believe supports our view. Beyond 2006, we expect
stabilization of investment fund flows, but at levels well below what we believe were
cyclical peak inflows in 2005. We would refer readers to our April 2006 report A
Financially Engineered Supercycle for further information on the details of our fund-
affected pricing methodology.
A strengthening fundamental picture supported copper prices in 1H/06 despite a decline
in the net levels of speculative investment in copper. However, Q3/06 saw a resurgence
in investment levels that kept copper prices supported at levels beyond our expectations.
Based on year-to-date pricing, we estimate that the copper market experienced an average net
daily inflow of approximately $1.9 million, much of which entered the market in July and
August compared with estimated average daily inflows of $2 million per day in 2005. We
believe that an acceleration of fund flows into the commodity space, contrary to our
expectations, could spur copper prices higher and present the biggest upside catalyst to our
forecast. However, year-to-date it does appear as though investment interest into copper has
remained fairly stable.
Exhibit 2.6 – …Along with Fund Inflows
$(10)
$(8)
$(6)
$(4)
$(2)
$-
$2
$4
$6
$8
$10
Jul-05
Aug-05
Sep-05
Oct-05
Nov-05
Dec-05
Jan-06
Feb-06
Mar-06
Apr-06
May-06
Jun-06
Jul-06
Aug-06
Sep-06
Oct-06
Nov-06
Dec-06
Jan-07
Feb-07
Mar-07
Apr-07
May-07
Jun-07
Jul-07
Aug-07
Sep-07
Oct-07
Nov-07
Dec-07
Daily Fund Flow (US$ M
)
0
500
1000
1500
2000
2500
3000
Cummulative Fund Flow (US$
M
Cumulative Fund Flow Daily Fund Flow (60-Day MA)
Source: Scotia Capital estimates.
Exhibit 2.5 – Prices Expected to Moderate…
$1,000
$2,000
$3,000
$4,000
$5,000
$6,000
$7,000
$8,000
$9,000
$10,000
Jan-00
May-00
Oct-00
Mar-01
Aug-01
Jan-02
May-02
Oct-02
Mar-03
Aug-03
Dec-03
May-04
Oct-04
Mar-05
Jul-05
Dec-05
May-06
Oct-06
Feb-07
Jul-07
Dec-07
May-08
Sep-08
Feb-09
Jul-09
Nov-09
Apr-10
Sep-10
Copper Price (US$/tonne)
Forecast Fund Flow price (actual prior to Oct 31/06), Fund Buying Driven Price (after Nov. 1/06)
Forecast Fundamental Price - USDTW and GDP adjusted
Source: Reuters; Scotia Capital estimates.
19
The Copper Market – Down to the Wire November 2006
Copper Price Outlook – Walking the Tightrope in 2007
Global copper demand has rebounded in 2006, with demand numbers trending above our
previously expected 3.9% growth rate. As a result of stronger-than-expected European and
Japanese consumption, we are upwardly revising our 2006 global demand growth expectations
to 5.0% (Exhibit 2.7). We believe global demand growth will soften in 2007 as a function of the
slowing global economy, and forecast growth of 4.2% in 2007. Higher-than-expected 2006
demand has been the significant factor in the upward revision of our forecast copper prices.
Near term, we expect positive fundamental demand and sustained speculative
investment in commodities to prove highly supportive of copper prices through at least
Q1/07. Only towards the middle of 2007 do we see the stage set for substantial declines in
copper prices as the market begins to enter its traditional seasonally weak demand period, and
we expect commodity investment will begin to wane as a result of a weakening global
economic outlook. Exhibit 2.8 outlines our quarterly copper price estimates through 2008.
We estimate that the global refined copper market remained in a substantial deficit
position of 224,000 tonnes in 2005, but down significantly from the 994,000 tonne deficit
reported in 2004. We expect the market to move into a negligible surplus of 2,000 tonnes
in 2006 increasing to a 158,000 tonne surplus in 2007, leading to a fundamental
softening of pricing over this period (see Exhibit 2.9 for our longer-term supply/demand
forecasts). Throughout 2006, copper prices have remained near record levels as the supply
side struggles to return the market to balance. Prices rose consistently to peak levels of nearly
$4.00/lb in May; prices have softened from their highs as concerns over global economic
growth have emerged, currently holding at approximately $3.15/lb. In our view, the observed
prices have not been solely fundamentally driven as numerous, well-publicized supply
disruptions and increased fund flow levels throughout 2005 and 2006 played a substantial role
in pushing prices higher by spurring renewed speculative investment into copper.
Exhibit 2.7 – Scotia Capital Fundamental Copper Forecast
2004 2005 2006E 2007E 2008E Long-Term
Scotia Fundamental Forecast ($/lb LME Cash) $1.30 $1.67 $1.45 $1.48 $1.30 $1.15
Scotia Fund Affected Forecast ($/lb LME Cash) $3.11 $2.27 $1.47 $1.15
Global Refined Production (000 tonnes) 15,918 16,660 17,749 18,643 19,629
Change in Global Refined Production (YOY % change) 4.2% 4.7% 6.5% 5.0% 5.3%
Global Refined Consumption (000 tonnes) 16,983 16,905 17,746 18,485 19,235
Change in Global Refined Consumption (YOY % change) 9.3% -0.5% 5.0% 4.2% 4.1%
Annual Copper Surplus (Deficit) (000 tonnes) -1,065 -265 2 158 394
Mine Supply (000 tonnes) 11,897 12,264 12,581 13,210 13,590
Total Exhange Stocks (000 tonnes) 125 156 147 239 860
LME Stock Level (000 tonnes, year-end) 49 78 95 144 516
LME Stock Level (days of consumption) 1.1 1.7 2.0 2.8 9.8
U.S. Dollar - Trade-Weighted (mid-2004 = 1.00) 0.970 0.962 0.940 0.901 0.927 0.927
Source: Reuters; Brook Hunt; FAME; Scotia Capital estimates.
Exhibit 2.8 – Scotia Capital Quarterly Copper Price Forecast
Q4 2006E Q1 2007E Q2 2007E Q3 2007E Q4 2007E Q1 2008E Q2 2008E Q3 2008E Q4 2008E
Copper, LME Grade A Spot (US$/lb) $3.46 $3.28 $2.12 $1.83 $1.83 $1.70 $1.49 $1.38 $1.31
Source: Scotia Capital estimates.
20
November 2006 The Copper Market – Down to the Wire
Generally, we believe there is good fundamental support for copper prices in 2006 and
2007 as well as longer term; however, we maintain our view that current pricing is well
above fundamentally justified levels. On a fundamental basis, we believe that copper prices
should average approximately $1.45/lb in 2006 and $1.48/lb in 2007. However, based on our
expected level of investment inflows, we have made significant upward revisions to our
average copper prices, forecasting $3.11/lb ($2.16/lb previously) and $2.27/lb ($1.35/lb
previously) in 2006 and 2007, respectively. Our forecast price deck is substantially above our
fundamental price levels given our expectations for the speculative pricing element to remain
present throughout 2006-2007, albeit to a lessening degree.
The copper market appears set to remain tight for the remainder of 2006 and into 2007;
we expect LME copper inventories to decline to 95,000 tonnes by year-end 2006, rising
modestly to 144,000 tonnes by the end of 2007. These inventories are low by historical
standards, and are what we would characterize as “critical,” remaining below what we believe
to be the key level of 3.5 days of consumption (roughly 175,000 tonnes) that has historically
proven to be a turning point in market sentiment. Based upon our estimates, we do not expect
LME inventories to breach the 3.5 days of consumption threshold until August 2007, thus
providing underlying fundamental support for pricing. We would note that LME inventories
have increased for the past eight months and currently stand at roughly 145,000 tonnes, up
substantially from a record low of 25,525 tonnes in mid-2005. We would note that the end of
the year is traditionally a seasonally strong demand period, underpinning our expectations for
LME inventories to decline from current levels.
Exhibit 2.9 – Production Increases Sufficient to Meet Consumption Increases
Refined Production (kt Cu) 2005 2006E 2007E 2008E 2009E 2010E Delta*
North America 1,773 1,891 2,022 2,024 2,019 2,029 256
Western Europe 1,841 1,881 1,893 1,933 2,010 2,020 179
Africa 513 621 791 878 890 886 373
Latin America 3,985 4,133 4,590 4,836 5,051 4,877 892
Australia and Asia 3,701 4,249 4,575 4,744 4,811 4,803 1,102
Former Eastern Bloc 4,847 5,273 5,855 6,600 7,160 7,396 2,549
Disruption Allowance 0 -150 -300 -300 -300 -300 -300
Total Production 16,660 17,749 18,643 19,629 21,640 21,710 5,050
* Delta represents the change from the 2005 to 2010 time period
Refined Consumption (kt Cu) 2005 2006E 2007E 2008E 2009E 2010E Delta*
North America 2,549 2,615 2,681 2,736 2,760 2,769 220
Western Europe 3,559 3,759 3,811 3,869 3,924 3,921 362
Africa 205 231 263 283 296 303 98
Latin America 965 1,014 1,041 1,077 1,104 1,120 155
Australia and Asia 4,706 4,824 5,021 5,167 5,273 5,321 615
Former Eastern Bloc 4,921 5,305 5,667 6,103 6,546 6,940 2,019
Total Consumption 16,905 17,746 18,485 19,235 19,903 20,375 3,469
* Delta represents the change from the 2005 to 2010 time period
Source: Brook Hunt (2005); Scotia Capital estimates (2006E-2010E).
21
The Copper Market – Down to the Wire November 2006
Supply – Mines, Smelters, Refineries, and Disruptions
Mine Supply Outlook – Growth in Sulphides and SX-EW
We forecast that the global supply of copper concentrate will increase 2.6% to 12.6
million tonnes in 2006 and by a further 5.0% to 13.2 million tonnes in 2007. We currently
anticipate a deficit market for copper concentrate in 2006 and 2007, as installed concentrate
production is currently insufficient to meet anticipated smelter production. We estimate that a
global concentrate stockpile of 750,000 tonnes was established in 2004 and 2005, from which
the recent decline in treatment and refinery charges (TC/RCs) would suggest the industry has
already begun to draw upon. We expect a drawdown of 300,000 tonnes of concentrate in
2006 and a further 100,000 tonnes in 2007, which should result in a material decline in
TC/RCs relative to 2005 levels. There have been indications from the major Chinese copper
smelters that they will refuse to purchase spot concentrate with TC/RC terms below
$100/tonne and $0.10/lb, while we note that current spot terms in China have been reported
around $20/tonne and $0.02/lb.
Given the expected tightness in the market, it is almost a certainty that spot terms will
be under pressure to head lower, but what is more uncertain, however, is whether the
large-scale Chinese smelters will hold to their statements (to the point of curbing output)
or sustain market share in a strong price environment. Given the substantial investment in
new smelting capacity in China (outside of the eight large producers) coming on line later this
year and into 2007, we suspect there is a willingness to acquire concentrate below the
threshold levels in order to start up new facilities rather than keep them idle, forcing the larger
smelters to abandon their crusade to artificially support TC/RCs.
We believe our view has been further supported by recent indications that Tongling, one
of China’s largest copper producers, recently settled mid-year contract TC/RCs with
Escondida at terms of $73/tonne and $0.073/lb compared with $95/tonne and $0.095/lb
last year. Also included in the terms is an increase in the copper price participation base to
$1.20/lb with a capped maximum of $0.06/lb payable to the smelters. This contract represents
a substantial deviation from the long-standing norm of unlimited price participation for the
smelters beginning at a base price of $0.90/lb. We estimate that at a $3/lb copper price,
smelters would traditionally receive $0.21/lb in price participation payments, making the
newly agreed upon cap of $0.06/lb a substantial reduction of roughly $0.15/lb to smelter
revenues (and net benefit to the cash costs of the miners).
Given this development, we feel it is unlikely that an organized reduction in refined
copper output, aimed at supporting TC/RCs, will occur in China in the near term. In our
opinion, this deal indicates a propensity for even the large-scale copper smelters to sustain
production by enduring not only a decline in TC/RC terms below the $100/tonne and $0.10/lb
threshold, but a willingness to give up a substantial amount of price participation in the process.
SX-EW production is expected to increase by a strong 15.1% to 3.1 million tonnes in
2006 and 13.5% to 3.5 million tonnes in 2007, providing a significant proportion of the
expected production additions over these two years. The expected incremental year-over-
year increase in mine supply in 2006, from both concentrate and SX-EW sources, can be
attributed primarily to Kansanshi (+38,000 tonnes), Spence (+25,000 tonnes), Cerro Colorado
(+20,000 tonnes), Milpillas and Piedras Verdes (+47,000 tonnes combined), Lisbon Valley
(+17,000 tonnes), Nifty Mill (+32,000 tonnes), and Tuwu Yangdong (+20,000 tonnes).
Nickel projects with copper by-products such as Voisey’s Bay (+25,000 tonnes) should also
contribute to global copper concentrate supply. A number of new projects can also be
expected on line in the next two years (Exhibit 2.10), which should help somewhat to ease the
current tightness in the copper market. These mine supply increases are partially offset by
year-over-year production declines from key operations Toquepala (-11,000 tonnes), Batu
Hijau (-60,000 tonnes), Grasberg (-129,000 tonnes), and Ernest Henry (-39,000 tonnes)
adversely affecting the mine supply picture.
22
November 2006 The Copper Market – Down to the Wire
Supply Disruptions – Cyclical or Structural?
Supply disruptions remain a key feature for the market in 2006. Continued high prices of
copper may provide increasing incentive for labour disruptions from workers seeking higher
wages. Most significantly, by the end of 2006 Codelco will be entering labour negotiations
with a number of operations that account for approximately 1.4 million tonnes of annual
copper mine production. Currently, many of these contracts (with the notable exception of the
Codelco Norte operations) have already been successfully renegotiated well in advance of
expiry and with no supply disruption. Although now appearing increasingly unlikely, a
possible strike at Codelco Norte would only exacerbate the tightness in the market, and would
underpin market sentiment for the remainder of the year. Labour disputes have not been the
sole impact on supply, as other operating issues, such as the rock fall at Codelco’s
Chiquicamata, have had a negative impact on copper output in 2006.
Supply disruptions have been a significant driving force for copper prices during the
past 12-16 months, although the somewhat muted price response to recent events at
Escondida and Chiquicamata could suggest supply-driven speculation in copper is
losing steam. It is virtually impossible to predict the net effect of these disruptions on a go-
forward basis; for conservatism, however, we have assumed in our forecasts that
approximately 2.0% of global refined copper output, or 300,000 tonnes, will be lost due to
unexpected production disruptions in 2007 onwards. Year-to-date 2006 figures suggest that
our 300,000 tonne supply disruption allowance was adequate, reinforcing our view that it
should remain unchanged going forward.
Exhibit 2.10 – Several New Mines Expected on Line in 2006 and 2007
Mine Projects - Probable
Location
Annual Production
Capacity
(000 tonnes)
Start-up
Balcooma Australia 20 2006
Cerro Verde Mill Expansion Peru 200 2006
Chapada Brazil 40 2006
Escondida L.G. Sulphides Proj. SX-EW Chile 235 2006
Mantos de la Luna SX-EW Chile 25 2006
Milpillas SX-EW Mexico 65 2006
Nifty Mill Australia 70 2006
Phoenix (Battle Mountain) USA 17 2006
Piedras Verdes SX-EW Mexico 32 2006
Sin Quyen Vietnam 10 2006
Spence SX-EW Chile 185 2006
Sungun Iran 47 2006
Tocopilla SX-EW Chile 20 2006
Tuwu-Yandong SX-EW China 50 2006
Yangla China 20 2006
Aguas Tenidas Restart Spain 25 2007
Carlota SX-EW USA 27 2007
Browns Australia 10 2007
Lady Annie Australia 13 2007
Minto Canada 15 2007
Frontier (ex Lufua) Congo DR 15 2007
Kimpe Congo DR 1 2007
Varvarinskoye Kazakhstan 10 2007
Fiftieth Anniversary October Kazakhstan 40 2007
Marcapunta Peru 18 2007
Didipio Phillipines 12 2007
Mineral Park Mill USA 12 2007
Lumwana Zambia 75 2007
Source: Brook Hunt; Scotia Capital estimates.
23
The Copper Market – Down to the Wire November 2006
Smelter/Refinery Outlook – Strong
Improvements in 2006-2007
We forecast that supply of refined copper will
increase 6.5% to 17.7 million tonnes in 2006 and
by an additional 5.0% to 18.6 million tonnes in
2007 (including SX-EW output). This compares to
an estimated increase of 4.8% in 2005 refined copper
supply. Although we can expect some incremental
refined production increases in 2006 and 2007
(Exhibits 2.11 and 2.12), it will not be until 2008
that we see any new greenfield projects with
additional refining production (with the exception of
Sarcheshmeh). Nonetheless, we believe that with the
expected capacity utilization improvements in 2006
and 2007 due to improved concentrate availability,
refining capacity will be able to meet expected levels
of primary copper demand.
Demand Outlook – After the
Rebound
We expect global refined copper demand to
increase 5.0% to 17.7 million tonnes in 2006 and
by a further 4.2% to 18.5 million tonnes in 2007;
global copper demand unexpectedly declined by
an estimated 0.1% in 2005 after rising an
exceptionally strong 9.2% in 2004. Our expected
demand figures reflect our view of softer but positive
levels of Western world and Chinese IP growth in
2007 of 2% and 16%, respectively.
Based on the figures provided by the International
Copper Study Group (ICSG), global copper
consumption has increased by 2.6% year over year in
1H/06, suggesting that the prolonged period of
inventory de-stocking, which led to minimal consumption growth in 2005, is largely over.
However, despite tight inventories throughout the global supply chain, we still expect hand-
to-mouth buying behaviour from consumers at current price levels, with a minimal chance of
widespread restocking.
We expect China to remain the primary driver of global consumption growth, and
forecast Chinese refined consumption to increase by 7.0% in 2006 and 6.5% in 2007.
China’s IP growth remains very strong; however, given the implementation of numerous
tightening measures in recent months, we expect to see a moderation in the rate of IP growth
in the next two to three years. Our expectation of 19% IP growth in 2006 is extremely strong,
and sustaining recent growth rates becomes more difficult as the size of the economy
continues to expand and the base effect takes hold. Specifically, we expect the plateauing of
power infrastructure installation growth and air-conditioning tube production to somewhat
constrain growth in copper consumption compared to recent years. We address the issue of
future Chinese consumption growth more fully in Section 3.
Exhibit 2.11 – Only One New Refinery Expected on Line
Until 2008….
New Refinery Projects Location
Annual
Production
Capacity
(
000 tonnes
)
Start-up
Sarcheshmeh Expansion Iran 60 2006
Baotou Expansion China 100 2008
Daye Expansion China 200 2008
Yantai Expansion China 140 2008
Sterlite Expansion India 100 2008
Chambishi (NFC) Zambia 100 2008
Source: Brook Hunt; Scotia Capital estimates.
Exhibit 2.12 – But Production Increases Should Keep
Us Going
Incremental Increases in
Refinery Production*
Location
Incremental
Production
Increase
(
000 tonnes
)
Start-up
Montreal East (CCR) Canada 70 2006
Cerro Colorado Chile 27 2006
Spence Chile 125 2006
Indo Gulf (Dahej) India 150 2006
Sterlite (Tuticorin) India 35 2006
Onahama Japan 34 2006
Toyo (I) Japan 90 2006
Amarillo USA 70 2006
Mufulira (I) Zambia 60 2006
Indo Gulf (Dahej) India 80 2007
Tamano Japan 24 2007
Toyo (II) Japan 40 2007
Mufulira (II) Zambia 40 2007
* - This table only highlights some of the larger projects
Source: Brook Hunt; Scotia Capital estimates.
24
November 2006 The Copper Market – Down to the Wire
Chinese trade data suggests that despite strong year-to-date IP growth, domestic
apparent copper consumption is actually down roughly 8% year over year; this
translates into a fall of roughly 214,000 tonnes of refined copper in absolute terms. In
our view, this has largely been the result of a significant decline in the level of net imports of
refined copper and is not truly reflective of the underlying level of demand in China. Year-to-
date growth in apparent consumption of semis is up 4.3% year over year, highlighting that
there is a substantial fundamental discrepancy between refined copper and downstream semis
consumption, which suggests to us that refined copper is entering the supply chain from
unreported sources. Anecdotally it is believed that China’s State Reserve Bureau (SRB) has
released roughly 200,000 tonnes of stockpiled material into the domestic market year-to-date,
and is not intending to make any further physical deliveries into the market, which would
account for a substantial portion of the decline. Domestic copper production is up sharply (by
roughly 350,000 tonnes year over year), further reducing the need for imported material. The
remainder of the observed discrepancy between refined and semis consumption could be
accounted for by increased use of unreported direct scrap in semis production and possible
producer de-stocking at the semis manufacturing level of the supply chain.
We believe global copper consumption patterns over the 2004-2005 period are consistent
with typical consumer restocking/de-stocking behaviour, and highlight that de-stocking
is not a practice that can go on indefinitely. We therefore conclude that the threat posed by
de-stocking to 2006 and 2007 Western world copper demand is limited in nature as the
duration of the de-stocking is typically short-lived; however, as noted above, we believe the
risks to Chinese demand are somewhat higher. A closer examination of monthly consumption
data reveals that the most substantial drop in copper demand growth took place during the
first half of 2005 before recovering to positive levels later in the year (Exhibit 2.13). In our
opinion, the rebound in copper consumption in 2H/05 was to levels consistent with what we
would expect from the observed level of global IP growth. We believe rising copper prices in
2H/05, in conjunction with a rebound in consumption, are a strong signal that consumer
de-stocking effectively reached an end in 1H/05 (i.e., on-hand inventories had been depleted),
despite copper prices remaining well above the levels that encouraged de-stocking initially.
Exhibit 2.13 – De-stocking Cycle Appears Complete as Global Copper
Demand Stabilizes
-10%
-8%
-6%
-4%
-2%
0%
2%
4%
6%
Jan-05
Feb-05
Mar-05
Apr-05
May-05
Jun-05
Jul-05
Aug-05
Sep-05
Oct-05
Nov-05
Dec-05
Jan-06
Feb-06
Mar-06
Apr-06
May-06
Jun-06
Jul-06
YOY Change (%)
$1.40
$1.90
$2.40
$2.90
$3.40
$3.90
Change in Consumption (% yoy) Average Copper Price (US$/lb)
Source: ICSG; Scotia Capital estimates.