global gas industry - credit suisse (2011)
Bạn đang xem bản rút gọn của tài liệu. Xem và tải ngay bản đầy đủ của tài liệu tại đây (2.97 MB, 120 trang )
DISCLOSURE APPENDIX CONTAINS ANALYST CERTIFICATIONS AND THE STATUS OF NON-US ANALYSTS. FOR
OTHER IMPORTANT DISCLOSURES, visit www.credit-suisse.com/ researchdisclosures or call +1 (877) 291-2683.
U.S. Disclosure: Credit Suisse does and seeks to do business with companies covered in its research reports. As a result,
investors should be aware that the Firm may have a conflict of interest that could affect the objectivity of this report. Investors
should consider this report as only a single factor in making their investment decision.
22 November 2011
Global
Equity Research
Global Gas
Connections Series
The Credit Suisse Connections Series
leverages our exceptional breadth of
macro and micro research to deliver
incisive cross-sector and cross-border
thematic insights for our clients.
Research Analysts
Andrey Ovchinnikov
7 495 967 8360
Kim Fustier
+44 20 7883 0384
David Hewitt
65 6212 3064
Edward Westlake
212 325 6751
Sandra McCullagh
61 2 8205 4729
Vincent Gilles
44 20 7888 1926
From tight to loose by 2016E
In this report, we introduce the new Credit Suisse global gas model (Excel
available on request), incorporating insights from Credit Suisse Energy and
Utilities research teams in Europe, Asia, Australia and the Americas. In
summary, we see two distinct periods in the global gas market this
decade. The market looks tight over 2011-16E, benefiting those who can
arbitrage regional cargoes and capture oil-related pricing. However, on
paper, there are enough LNG projects to meet 2017-20E demand. We are
concerned that gas affordability will limit gas market growth and hence
cost will become an even more important differentiator for future LNG.
■ Getting tighter for four years: Qatar has absorbed the bulk of immediate
Japanese LNG requirements post-Fukushima, but its capacity ramp-up is
now over. We expect the structural gas shortage to worsen as liquefaction
additions are far outpaced by demand growth. We estimate that the potential
LNG supply deficit will peak in 2014-15 at 35mpta, the equivalent of 7
Gorgon LNG trains.
■ The supply cycle will turn: Exploration success (both offshore and
onshore) has improved the choice for LNG purchasers – cost of supply will
become a more important differentiator. While the requirement for LNG is
high (110 mtpa of growth by 2020E, the list of supply projects is even
larger at 260mt), not all of the LNG projects will proceed. Over half of
new LNG volumes will come from Australia, while new “low cost” sources e.g.
North America, East Africa and more flexible FLNG solutions are emerging.
■ Gas demand is price-sensitive: 1) Chinese gas demand should grow fast
(10.5% p.a. to 2020E), but we believe the country will aim to meet much of
its demand growth with local production, leaving less room for LNG imports
than consensus expects. 2) India and South East Asia are even more price-
sensitive than China. 3) In Japan, we anticipate that the younger nuclear
plants will be restarted gradually, as the cost of replacing nuclear begins to
bite. 4) In Europe, we do not expect the German nuclear pull-out to have a
significant impact on gas demand, as some capacity will be replaced by
cheaper coal (utilisation is 60-75%). Oil indexation will likely remain
challenged in Europe given anaemic demand, coal fired power availability
and a continued focus on liberalisation.
■ Stock calls: 1) Among the majors, we think BG and RDS should be well-
placed to benefit from a tightening LNG market and continued arbitrage
opportunities. Both companies have strong LNG project portfolios to ensure
growth until 2020. 2) In Russia, we prefer Novatek over Gazprom. 3) Inpex
in Japan is well-placed, with the imminent sanction of Ichthys and a second
project (Abadi) building momentum. 4) We prefer Woodside and Origin over
Santos and Oil Search. 5) East Africa gas is a play to watch (stocks exposed
include Eni, Galp, BG and Ophir, as well as Not-Rated APC and Cove).
6) We highlight likely domestic winners in China (E&P, utilities and drillers).
22 November 2011
Figure 1: Credit Suisse Global Energy Research Team
Europe United States
Jason Turner + 44 207 888 1395 Edward Westlake (Integrateds/Refiners) + 1 212 325 6751
Kim Fustier (Integrateds/Refiners) + 44 207 883 0384 Rakesh Advani (Integrateds/Refiners) + 1 212 326 5084
Thomas Adolff (Integrateds/Refiners) + 44 207 888 9114 Brad Handler (Oil Services) + 1 212 325 0772
Ritesh Gaggar (E&Ps/Services) + 44 207 888 0277 Arun Jayaram (Oil Services) + 1 212 538 8428
Arpit Harbhajanka (E&Ps/Services) + 44 207 888 0151 Eduardo Royes (Oil Services) + 1 212 538 7446
Mark Henderson (Russia) + 7 495 967 8362 Jonathan Sisto (Oil Services) + 1 212 325 1292
Andrey Ovchinnikov (Russia) + 7 495 967 8360 Kristin Cummings (Oil Services) + 1 212 325 1318
Mark Lear (Exploration & Production) + 1 212 538 0239
Asia David Lee (Exploration & Production) + 1 212 325 6693
David Hewitt (Singapore) + 65 6212 3064 Yves Siegel (MLP) + 1 212 325 8462
Edwin Pang (China) + 852 2101 6406
Horace Tse (China) + 852 2101 7379 Canada
Sanjay Mookim (India) + 91 22 6777 3806 Brian Dutton (Toronto) + 1 416 352 4596
Paworamon Suvarntemee (Thailand) + 662 614 6210 Jason Frew (Calgary) + 1 416 352 4585
A-Hyung Cho (Korea) + 82 237 073 735 Courtney Morris (Toronto) + 1 416 352 4595
Yuji Nishiyama (Japan) + 81 3 4550 7374 David Phung (Calgary) + 1 403 476 6023
Australia Latin America
Sandra McCullagh (Sydney) + 612 8205 4729 Emerson Leite (Sao Paulo) + 55 11 3841 6290
Nik Burns (Melbourne) + 613 9280 1641 Vinicius Canheu (Sao Paulo) + 55 11 3841 6310
Ben Combes (Melbourne) + 613 9280 1669 Andre Sobreira (Sao Paulo) + 55 11 3841 6299
European Utilities
US Utilities
Vincent Gilles +44 20 7888 1926
Dan Eggers +1 212 538 8430
Mark Freshney +44 20 7888 0887
Kevin Cole +1 212 538 8422
Michel Debs +44 20 7883 9952
Mulu Sun +44 20 7883 0269
Zoltan Fekete +44 20 7888 0285
We would like to acknowledge the contribution from the entire Credit Suisse global Oil &
Gas team and from the European Utilities team to this report.
Global Gas 2
22 November 2011
Global Gas
3
Table of contents
Executive summary 4
Europe & Russia 5
North America 5
Asia-Pacific 6
Stock conclusions 8
Global LNG 12
Conclusion: Tight through 2016 with plenty of projects competing to fill late decade
demand 12
Global LNG capacity to increase by 61% by 2020E 14
Global LNG demand – Growth from Europe and Asia 16
Pricing is key – Asia won’t take LNG at any price 18
“Advantaged” LNG projects to win 19
LNG transportation – Finding its stride 27
Europe 30
Main conclusions 30
Gas supply in Europe 31
Gas demand in Europe 38
Gas for power generation – Does the German nuclear pull-out change the picture? 39
Russia and Central Asia 48
Russian production should grow by 33% until 2020E 48
Liberalisation of Russian gas market looks inevitable 52
Gazprom and CNPC – Opposing views 54
We believe Russia must rethink its pricing policy to prevent demand destruction in
Europe 56
Asia 57
China – Focusing on domestic unconventional gas 57
India: Demand is price sensitive 70
Japan – Expect only modest LNG tightening 76
Australia – Still all about LNG 82
Australia – Willing LNG exporter 82
Too many LNG projects equals cost and schedule concerns 83
LNG investment – The sting is in the tail 86
Viability of projects 88
Landowner and political relationships becoming a larger issue 89
North America 90
US LNG: How quickly the world changes 90
US gas production, resources and demand 91
An overview of the key North America LNG export schemes 94
Latin America 96
Overview 96
Key country-specific themes 97
Model 101
Middle East 102
Strong demand growth 102
Rising MidEast LNG imports 104
Can supply keep up with demand? 104
Gas prices 107
Appendix: Global gas model 108
22 November 2011
Executive summary
The market looks tight over
2011-16E. However there
are enough LNG projects to
meet 2017-20 demand.
Taking gas affordability into
consideration, we believe
cost of supply will become a
more important differentiator
for yet-to-be sanctioned
LNG proposals.
■ The global gas market is likely to become increasingly tight until 2012-2015, followed
by a more balanced market after 2015 and potentially oversupply towards the end of
this decade. On paper, there are enough LNG projects to meet 2017-20 demand. We
are concerned that gas affordability will limit gas market growth and hence cost will
become an even more important differentiator for future LNG projects.
■ We forecast that the global gas market will get tighter in the next 3-4 years, driven by
the lack of large LNG plant start-ups (we see only 5.5mtpa of annual LNG additions in
2012-14), the shutdown or mothballing of nuclear power capacity in Japan and
Germany, and strong demand growth in Asia Pacific. We estimate that the potential
LNG supply deficit will peak in 2014-15 at 35mpta, the equivalent of 7 Gorgon LNG
trains.
■ In a tight gas market, we expect spot gas prices to remain in a range of $12-16/
mmbtu in the Asia-Pacific region for the next 3-4 years. We would expect a pricing gap
to be sustained between European and Asia-Pacific markets for several reasons,
including transportation cost differentials and inter-fuel switching opportunities in
European power generation.
■ The UK NBP futures curve currently averages $10-11/mmbtu through 2013. The
European spot market has behaved uncharacteristically compared with pure arbitrage
economics for several years now. Almost 70% of European gas is still supplied under
oil-linked long-term contracts with minimum take-or-pay obligations. European utilities
have to buy a certain amount of gas even if they don’t want it. They then sell this gas
at trading hubs as it is uneconomical to produce electricity from it (coal is cheaper).
This extra gas has depressed spot prices compared with a pure arbitrage from Asia –
we believe this could continue. Weather will be a significant short-term European spot
gas price driver but in the medium term – until electricity demand growth requires new
gas-fired power (as opposed to existing coal or growing renewables), this gas
oversupply could continue.
■ High Asian gas prices will make most proposed new LNG projects economically
viable, most notably in Australia where we expect more Final Investment Decisions
(FIDs) to be taken in the next few years, if demand allows. We forecast that Australia
will overtake Qatar (77mtpa) as the world’s largest LNG producer by 2017, with output
of over 111mtpa by 2020E.
■ However, sustained high gas prices lead us to worry over affordability. We expect the
world to consume significantly less gas than the IEA forecasts. At $14/ mmbtu, natural
gas could start to lose its economic appeal as many developing countries may simply
not afford high-priced gas imports. In particular, we focus on the demand prospects of
China and India. We also believe some governments, notably in Japan, will consider
restarting nuclear power stations when faced with sharply rising gas price-related
electricity prices.
■ With the largest potential buyers (China and India) being price conscious and focusing
on domestic supply, we believe cost of supply will become a more important
differentiator for yet-to-be sanctioned LNG proposals. In this context, North America
and East Africa are emerging as contenders.
■ As a means of monetising stranded or associated gas, we believe LNG will remain a
more attractive proposition than GTL owing to the greater visibility in long-term sales
prices. GTL will remain a niche technology for stranded fields (e.g. US, South Africa
shale gas) as GTL projects require significantly greater up-front investment.
Global Gas 4
22 November 2011
Global Gas 5
Europe & Russia
■ Europe will remain well supplied in natural gas in the long term. The decline in
indigenous production (which we expect to be milder than the IEA’s forecasts) should
be offset by growing LNG imports, gas from Central Asia brought to Europe by new
pipelines (e.g. Nabucco) and increasing gas exports from Russia.
■ We consider a number of scenarios for European gas demand. For Europe as a whole,
weather is a large swing factor. We take an average weather year and lacklustre
economic growth as a base case. Our European Utilities team have considered the
merit order for European power and Germany’s nuclear replacement policy among
other swing factors. In the “Green scenario”, we assume that Germany manages to
meet its target of generating 35% power from renewables by 2020 and builds 95GW of
renewables capacity
1
. In the “Fossil fuel scenario” lost nuclear is replaced by a
combination of coal and gas.
■ Europe will continue to liberalise its gas market and ultimately aim to create a Pan-
European gas network with more interconnecting pipelines and new LNG
regasification terminals.
■ Oil-linked prices are effectively acting as a ceiling for European gas prices. At current
high price levels, traditional oil-linked gas producers (most notably Gazprom) have the
ability to significantly increase supply, should there be demand. Oil indexation in gas
contracts from major suppliers should continue to erode as high oil-linked gas prices
should lead to greater competition between gas and other energy sources including
coal and renewables. Gas producers will be forced to reconsider gas pricing formulae
to be able to maintain the share of gas as a primary energy source.
■ We expect unconventional gas production in Europe to emerge only in a few
countries, namely Poland and Ukraine, where their respective governments will
provide political backing to such projects in order to reduce their dependence on
Russia and diversify supply.
■ We forecast Russian gas production to grow by 15-20% by 2020 led by independent
gas producers, oil companies and the development of Gazprom's new fields in Yamal
and Shtokman. Europe will remain the dominant export market for Gazprom since the
latter may not be able to sign a deal with China owing to pricing issues. Russia will
have to change the existing oil-linked price formulae if it wants to maintain its export
volumes into Europe.
North America
■ We expect North America to remain an isolated market owing to continued shale gas
production growth. Having said this, we expect US natural gas prices to appreciate in
the longer term from current levels as current spot prices do not justify investment in
gas production. We model long-term US gas prices at $5.5/mmbtu. LNG and policy
induced coal-gas switching appear to be the most meaningful sources of demand
growth but neither will arrive any time soon, in our opinion.
■ US natural gas demand should rise over time to close the pricing arbitrage between
natural gas and coal (power) and liquids (oil). Much of the expected increase in natural
gas consumption from power demand kicks in after 2014.
1
Assuming a 25% load factor, we calculate Germany needs at least 95GW renewables capacity to cover
35% of the 596TWh demand
22 November 2011
■ In our base case, we expect North America to export up to 15mtpa (20 bcm, 2bcfd) of
LNG by 2020, some from the West Coast (British Columbia) where it can be delivered
to the Asia-Pacific region, and some from the repurposing of LNG import terminals in
the Gulf or East Coast. On paper, there are up to 77mtpa (10bcfd) of LNG liquefaction
terminals proposed from North America.
■ BG has recently signed a 20-year sale and purchase agreement with Cheniere to
export 3.5mtpa (around 0.5bcfd) from Cheniere’s Sabine Pass LNG scheme in the
Gulf Coast, subject to Sabine Liquefaction's receiving regulatory approvals, securing
financing and making a final investment decision. We believe it will take around $4/mcf
from inlet pipe to regas exit to provide an acceptable return from the Gulf to Europe,
and $5.25/mcf from the Gulf to Asia. Cheniere ultimately wants the Sabine
Liquefaction plant to produce 9mtpa (1.2 bcfd) of LNG in the first phase of its project.
Sabine Liquefaction has received authorisation from the U.S. Department of Energy to
export up to 16mtpa (2.1bcfd).
■ It remains to be seen how Canada’s BC exports will price into Asia – either as a mark-
up to the prevailing Henry Hub plus liquefaction costs or following the current practice
in Asia i.e. significantly correlated to crude, and therefore able to benefit from a large
price differential between NAM and Asia.
Asia-Pacific
■ In the Asia-Pacific region, we expect strong gas demand growth (5.9% p.a. over
2010-20E) owing to gas switching in power generation and industries. We expect that
demand will be met by a combination of indigenous production growth (both
conventional and unconventional) and incremental LNG supply, mainly from Australia
and Qatar.
■ Japan: Post Fukushima creates incremental demand both short term and long term.
We look at three detailed scenarios for Japan’s LNG needs depending on nuclear
policy. In our base case, we anticipate “newer” nuclear power stations will be returned
to generation gradually under the new administration. Our forecast for 2020 LNG
demand in Japan is 92mpta vs 70mtpa in 2010.
■ Qatar will meet the lion’s share of both the immediate and medium long-term
incremental LNG requirement in Japan – having uncontracted available capacity to do
so. It will likely achieve LNG price formulae significantly correlated to crude (nearing
Crude Price Parity) for those supplies – hence Asian LNG prices will likely remain
strong for the foreseeable future. A further consequence of this redirection will be an
upward price pressure in Europe, where the Qatari gas will need to be replaced, once
spare coal capacity has been fully utilised.
■ Australia: The focus moves to build out. The primary challenges will be to meet the
time and cost deadlines for the 52mtpa of sanctioned projects now entering/
progressing through the construction phase.
■ China: Low gas penetration thus far suggests China could radically increase its
demand for gas – the question is whether it can drive gasification using domestic
unconventional gas resources, or feels compelled to draw in further higher-cost import
gas sources. In the short to medium term, China has secured enough gas to meet
growth and is using the next plan period (2011-15) to assess how significant domestic
shale/tight and CBM production could be in the latter part of the decade (and if it will
need to commit to further pipeline gas/LNG to meet gas demands at that time). While
China waits, lower-cost gas suppliers have time to firm up their LNG offer (e.g. in East
Africa).
Global Gas 6
22 November 2011
■ India: Power tariffs in India are well below the levels needed to justify use of LNG at
our forecast Asian spot/contract prices which eliminates a large potential source of
demand. Development of Indian pipeline infrastructure and city gas distribution
networks will help grow demand for higher cost gas, but this is likely to be at a more
gradual pace. Long term, Indian LNG imports could also face headwinds from
improving domestic production – should the KG basin and other promising acreage
deliver on expectations.
■ Other emerging Asia wants, and plans for, increased gas penetration but is more
price sensitive than China and India.
■ North American LNG as a supply point to Asia-Pacific: Asian buyers will likely
show strong interest in developing a new LNG source – but may be concerned by
long-term gas pricing deliverability. North Asia is used to pricing certainty via contract.
Importantly, existing Asia-Pacific LNG suppliers will not want to see price pollution
from NAM LNG supplies and it is these suppliers who are the most likely aggregators
of North American LNG e.g. BG in its recent deal with Cheniere. It remains to be seen
how Canada’s BC exports will price into Asia – either as a mark-up to the prevailing
Henry Hub plus liquefaction costs or following the current practice in Asia i.e.
significantly correlated to crude.
Global Gas 7
22 November 2011
Stock conclusions
We have summarised below our key stock calls following this detailed analysis of global
gas markets. The stock calls below are predicated on our view of a tightening market over
the next 4-5 years followed by a competitive LNG supply market longer term.
Europe
■ BG (Outperform, TP 1770p): BG is well-placed to benefit from a tightening LNG
market over the next 4-5 years, with flexible LNG volumes (notably from EG LNG) and
strong trading capabilities allowing it to benefit from arbitrage opportunities. We expect
BG’s strong 2011 LNG marketing performance to continue, and conservatively
forecast $2.3bn of LNG EBIT in 2012-13. BG’s LNG supply portfolio is set to grow
from 12.7mtpa in 2010 to up to 32mtpa by 2020E with the addition of i) the QCLNG
project in Australia (up to 12.6mtpa for 3 trains), and ii) a proposed 7mtpa LNG export
scheme in Tanzania with Ophir, ii) its recent agreement to purchase 3.5mtpa of LNG
from Cheniere’s Sabine Pass terminal at Henry Hub-linked prices. With Tanzania and
the US, BG has added two lower-cost supply sources to its portfolio, giving it a
competitive advantage in the race to FID and capture Asian demand.
■ Shell (Outperform, TP 2780p/$90): Shell is the largest LNG producer among majors
and is set to maintain its leadership throughout this decade, with 8.3mtpa of LNG
under construction (Gorgon, Prelude and Pluto) and a further 10mtpa of potential LNG
options (Arrow, Sunrise, Browse, Abadi, BC LNG). In May 2011 Shell sanctioned
Prelude FLNG, the world’s first Floating LNG project. We think the company could use
its Floating LNG technology to gain access to other gas resource opportunities at
advantageous prices. Interestingly, the initial proposed FLNG projects have relatively
low breakevens. In the nearer term, we believe Shell is well placed to take advantage
of a tightening LNG market in Asia given its position in Sakhalin II and Malaysia LNG,
and flexible volumes from Qatargas 4 (which has been operating at plateau since
2Q11).
■ Ophir (Outperform, TP 510p): The potential for LNG in Tanzania and Equatorial
Guinea is central to Ophir’s investment proposition, and it plans to drill several high-
impact wells to prove foundation volumes to underpin LNG developments. Recent
successes in areas of Ophir's portfolio are attracting significant industry interest, and
this is important as Ophir is likely to be looking to monetise (complete sale or partial
farm-out) its acreage in Tanzania and Equatorial Guinea (EG) as early as 2H12 after
what will be an important drilling programme in 1H12. Ophir has an early mover
advantage in the frontier East Africa region, and it is utilising its core technical
strengths by adding more operated acreage in the region (East Pande farm-in and
proposed acquisition of Dominion). Beyond this, its portfolio has the depth to keep the
story exciting, particularly the pre-salt play in Gabon together with Petrobras.
■ NOVATEK (Outperform, TP $17.1) NOVATEK will be able to grow production to 100
bcm by 2020E and gain market share from Gazprom, on our forecasts. To do so
NOVATEK will likely continue acquiring new assets (both mature and greenfield) at
attractive valuations. More power generation companies will likely switch to NOVATEK
from 2012 when 10-year supply contracts with Gazprom expire as NOVATEK will be
able to offer more favourable and flexible terms. We expect NOVATEK to be exporting
its gas to Germany breaking Gazprom's export monopoly next year following its
acquisition of a stake in Verbundnetzgaz. Yamal LNG, which we expect to come on
stream in 2016-17, should be able to reach production of 20-25 MTA, higher than
expected 15 MTA on the back of new reserves added recently which double the
resource base of the project. We project 30-35% CAGR earnings growth for the next
five years based on the current asset base and admit that the risk is on the upside.
The premium valuation which NOVATEK has always enjoyed is, in our view, fully
justified.
Global Gas 8
22 November 2011
■ Gazprom (Underperform, TP $5.3). We think Gazprom will struggle to sell gas to
Europe above minimum take-or-pay levels. The company will likely try to keep the oil
indexation of gas prices for as long as possible, which should lead to demand
destruction and loss of its market share in Europe long term. Gazprom will likely be
unable to sign a contract with China unless it submits to the Chinese terms. The deal,
should it happen, is unlikely to be margin accretive for Gazprom. We model further
margin deterioration when new more expensive gas starts coming from Yamal.
Domestically, we expect gas tariffs increases to stall at $140/mcm and the government
to open up access to the pipeline system allowing price competition among producers;
as a result, we expect Gazprom to lose 10-15% of its market share in Russia.
European Oil Services: It is difficult to get "pure" exposure to firming global gas dynamics
through the Euro OFS space, however there are a number of companies who offer solid
long-term exposure through specific business divisions to the improving global spending
outlook in Upstream natural gas / CSG / LNG monetisation and FLNG solutions.
Our preferred names to leverage into the theme through Euro OFS would be:
■ Technip (Neutral, TP €69): 2011 was a key year for Technip, having won the major
FLNG contract for construction of the Prelude facility off Northwest Australia with
optionality for many look-alike projects in the long term with recent FEED studies
completed in Brazil, Malaysia and Indonesia for similar solutions. Shell has a
framework agreement with Technip/Samsung for up to 10 Floating LNG (FLNG) units
over 15 years. Around 16% of current backlog is exposed to gas and the company is
well positioned in the FLNG supply chain as well as having been involved in c.30% of
existing world LNG production capacity.
■ Saipem (Underperform, TP €38) is rapidly building its presence in the gas value
chain via similar FLNG solutions. While it is behind Technip in the development curve,
it could be a long-term beneficiary of potential FLNG development spending by Eni in
Ghana and Angola, but it is early days. Arguably more important in the next few years
is the scope for Saipem to have leverage to significant development spending on
conventional onshore liquefaction facilities in Mozambique, particularly given Eni's
recent Mamba South-1 discovery (up to 22.5 tcf).
■ SBM Offshore (Outperform, TP €21) offers exposure to the same theme longer-term
for its own FLNG concept design. Two LNG FPSOs remain on the near-term agenda
as far as we are aware. Masela/Abadi for Inpex in Indonesia (although Technip is now
widely assumed to be front-runner given Shell’s involvement) and the Cash/Maple for
PTTEP. Rather more importantly, the outlook for component orders for SBM's turret
mooring systems is robust where SBM is the leader in this field. We note that Shell
has a framework agreement with Technip/Samsung for up to 10 Floating LNG (FLNG)
units over 15 years: SBMO, in turn, has a framework agreement in place for the supply
of turrets for these FLNG units over the next 15 years.
North America
■ Focus on low-cost gas names shifts to Energy XXI (EXXI): We have preferred
Marcellus names e.g. RRC as the low-cost gas providers in the US in 2011. We
recently raised our NAV-based target price on RRC to $81 per share on higher
reserve recoveries in RRC's North-East Pennsylvania (PA) project area (RRC
increased EURs to 6.5 Bcfe from 6.0 Bcfe). This follows the recent increase in EURs
in for the South-west PA project area where our estimates increased to 5.7 Bcfe from
5.0 Bcfe. However, RRC should not be immune to weakness in the front end of the
gas curve. Currently, we shift attention to EXXI. Although predominantly an oil
producer today (60% oil), EXXI is participating in tests of Deep Shelf Gas that could
unlock even lower cost gas reserves than the Marcellus.
Global Gas 9
22 November 2011
■ EXXI (Outperform, TP $40) – Ultra-deep Shelf gas catalysts: All the equipment
required to complete the Davy Jones deep shelf gas well has been constructed and
the perforation (well test) is expected by mid-December. Expectations are for the well
to flow 50-75 mmcf/d. EXXI also expects to be at total depth on Blackbeard East soon
which could correlate to the Davy Jones well 90 miles away. This could confirm the
concept that these are blanket sands across the shelf and likely prospective across
multiple structures that exposes EXXI to more than 10 tcf of net gas potential (more
than 1.5 billion barrels of oil equivalent) with a potential upside NAV over $50/sh.
US Oil Services: Within US OFS, there are pockets of exposure to offshore Australia
construction. However, the competitive landscape is such, and the relevance is such that it
is difficult to make a call on any names as pure plays on the theme.
■ Offshore development in Australia is generally a positive for many of US services
names (service, subsea, offshore drilling, compression/transportation of gas from the
wellhead); however, exposure to this trend is broad.
■ Onshore Australia CSG development: “Big 4” service names (SLB, HAL, BHI, WFT),
Oil States (OIS) for accommodations and Enerflex (EFX.TO) for compression.
■ FLNG construction exposure is modest. Cameron (OP, TP $71) has some process
valve exposure, but it is small in the context of the group.
Asia
■ China: The three oil majors have now committed to the development of domestic
onshore unconventional gas resources in China. Petrochina will likely be the relative
winner, participating in both upstream developments and as the dominant participant
in primary gas distribution domestically. CNOOC has already taken a 51% stake in
CUCBM and will drive CBM production growth; SINOPEC has decided to actively
participate in shale developments onshore - where China believes it has more than
30,000 bcm of recoverable shale gas deposits. Green Dragon Gas, Sino Oil and
Gas and Sino Gas and Energy are working towards near-term CBM production ramp
ups with COSL and Anton Oil providing development support services. Downstream
China Resources Gas, China Gas Holdings and Kunlun will continue to enjoy
earnings growth as gas increases its share in the primary energy mix in China.
■ India: We prefer the two pipeline companies – GSPL and GAIL, who will be able to
utilise large current spare capacity and improve earnings and returns.
■ Japan: INPEX should be a winner, in our view, because 1) INPEX can benefit from
increased gas demand in Japan by developing two LNG projects (Ichthys and Abadi).
2) INPEX is financially sound and has strong backing from utilities, 3) INPEX's
valuation is one of the cheapest among global E&P, on our forecasts.
Australia
We prefer Woodside (WPL) and Origin (ORG) over Santos (STO) and Oil Search
(OSH).
■ With uncommitted capacity from its existing NWS (North West Shelf in Western
Australia) LNG trains and Pluto 1 train (4.3mtpa) owing to ship cargoes from March
2012, WPL (Outperform, TP $46.00), is best placed to capture any potential upside
from a tightening LNG market over the next 3-4 years, in our view. WPL also has three
LNG growth options (Pluto expansion, Browse and Sunrise) which are still in the
planning phase, and we would argue at the current share price investors do not pay
anything for this growth potential.
Global Gas 10
22 November 2011
■ ORG (Outperform, TP $16.90), with its stake in the 9mtpa 2 train APLNG project at
Curtis Island, Gladstone, is in the market to sell offtake from train 2 before an
expected FID in 1Q2012 (Train 1 reached FID in August 2011). APLNG is competing
with Wheatstone (which has reached FID) to gain customers with APLNG hoping to
benefit from upside in pricing post Fukushima.
■ OSH (Outperform, TP $7.40), is 50% complete on its US$15bn PNG LNG 2 train
project, with concerns about cost overruns from construction, landowners issues and
FX impact from the strong AUD. XOM, as operator, has maintained its “on time, on
budget” position.
■ STO (Neutral, TP $14.65), is 10 months into construction of its A$16bn GLNG project
with first LNG due in 2014 and has a small equity interest in PNG LNG and Darwin
LNG. With three projects (20.8mtpa) commencing FID within the past 12 months at
Curtis Island at Gladstone (BG's QCLNG, STO's GLNG, and ORG's APLNG), the race
is on. Bechtel, as downstream developer of all three projects, is confident of delivering
all three LNG project on time and on budget in the 2014-2015 window.
Latin America
Although gas is not our main stock theme in Latin America currently, we provide several
stock ideas:
■ Comgas (Neutral, TP R$42) is the largest distributor of natural gas in Brazil and
would be a clear beneficiary of the upcoming oversupply.
■ HRT (Outperform, TP R$1600) has significant gas reserves in Solimoes that can
unlock value if monetised.
■ In Argentina, YPF (Outperform, TP $50) is focusing mainly on shale oil, recently
making announcements on its Vaca Muerta potential, but already has monetisation in
place for a 4.5tcf tight gas discovery. As domestic gas prices converge to higher
levels, we could see further exploration efforts on the gas side from YPF.
Global Gas 11
22 November 2011
Global LNG
In this report, we introduce the new Credit Suisse global gas model, incorporating insights
from Credit Suisse research teams across Europe, Asia, Australia and the Americas. We
model 90 individual LNG projects and LNG demand on a country or regional basis.
Conclusion: Tight through 2016 with plenty of
projects competing to fill late decade demand
We see two distinct periods in the outlook for the LNG market this decade: The market
looks tight over 2011-16. We believe the global LNG market will get tighter until around
2016 as liquefaction additions (only 5.5mtpa of annual LNG additions in 2012-14) are
outpaced by demand growth. We estimate that the potential LNG supply deficit will peak in
2014-15 at 35mpta, the equivalent of 7 Gorgon LNG trains.
After 2016, there seem to be enough LNG projects to meet 2017-20 demand (even with a
more bullish scenario for China LNG demand). Taking gas affordability into consideration
we believe cost of supply will become a more important differentiator for future yet to be
sanctioned LNG proposals.
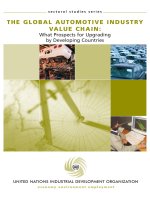
Figure 2: Global LNG demand vs potential supply (in mpta)
150
200
250
300
350
400
450
500
2008 2009 2010 2011 2012 2013 2014 2015 2016 2017 2018 2019 2020
LNG (existing) LNG under construction LNG supply (bear)
LNG supply (base) Speculative LNG demand (base)
LNG demand (China bull)
Source: Company data, Credit Suisse estimates.
NB: China bull demand case assumes that 30% of additional gas demand is met by LNG
LNG should gain further market share as a proportion of total gas consumption. We
forecast that LNG will represent 14% of global gas consumption by 2020, up from 9% in
2010. Global gas markets should continue to become more integrated – although new
LNG supply should be largely dedicated to regional demand, there will be significant cargo
arbitrage opportunities between basins in 2011-15.
Global Gas 12
22 November 2011
Figure 3: Global LNG output, Share of LNG in world gas consumption
in mtpa (LHS) and % (RHS)
0
100
200
300
400
500
2000 2002 2004 2006 2008 2010 2012 2014 2016 2018 2020
0%
2%
4%
6%
8%
10%
12%
14%
16%
LNG output (mtpa), LHS Share of LNG in consumption, RHS
Source: BP Statistical Review, Credit Suisse estimates
A word on methodology
In our global gas model, we are tracking 90 liquefaction projects worldwide, of which 33
LNG plants currently onstream, 11 plants under construction, 15 plants in the engineering
phase (“possible”) and 31 projects under study (“speculative”). In our model, we take a
view on which projects will go ahead and contribute to production by 2020 (“possible”),
and which projects are likely to be cancelled or delayed until after 2020 (“speculative”). For
instance, we include Browse LNG in Australia among the “possible” projects, but classify
Sunrise LNG as “speculative”. We model brownfield expansions as separate projects.
Given the uncertainty around the feasibility and timing of the numerous unsanctioned
projects, we have modelled 4 liquefaction supply cases:
(1) Worst case for LNG capacity additions = no further FIDs: Includes only LNG
projects under construction and no “possible” pre-FID LNG projects.
(2) Bear case: Only includes projects under construction and 50% of “possible” pre-
FID LNG projects. As such, we risk all the “possible” pre-FID projects equally, but
do not take an explicit view on which projects will go ahead.
(3) Base case: Includes projects under construction, and all “possible” pre-FID
projects.
(4) Bull case: Includes projects under construction, all “possible” projects and all
“speculative” projects.
Wide range of outcomes after 2015
Figure 4 and Figure 5 below show the global LNG supply/demand under our 4 supply
scenarios in two ways: 1) implied LNG utilisation (where a >90% utilisation rate would
indicate a tight market and a <80% rate a loose market) and 2) potential LNG supply
relative to our demand forecasts.
A striking feature of this analysis is the apparent certainty in supply outcomes until 2015,
due to the long lead times (4-5 years) in bringing new LNG supply onstream. In other
words, all projects supposed to contribute to production over 2012-15 are already under
construction – the only remaining uncertainties until 2015 are potential start-up delays
(likely) and demand-side shocks. In contrast, we observe a wide range of supply outcomes
after 2015. This suggests a relatively good probability of a tight LNG market through 2016,
absent a global economic meltdown.
Global Gas 13
22 November 2011
Figure 4: Implied global LNG utilisation, 2000-20E: Wide
range of outcomes
in % annual utilisation (demand /nameplate capacity)
Figure 5: Global LNG demand vs potential supply
in mtpa
65%
70%
75%
80%
85%
90%
95%
100%
105%
2000 2002 2004 2006 2008 2010 2012 2014 2016 2018 2020
Base supply case Bear supply case
Bull supply case No further FIDs
Tight
Loose
150
200
250
300
350
400
450
500
2008 2009 2010 2011 2012 2013 2014 2015 2016 2017 2018 2019 2020
Exisiting Under construction
Possible (bear case) Possible (base case)
Speculative LNG demand (base)
LNG demand (China bull)
Source: BP Statistical Review, Credit Suisse estimates Source: BP Statistical Review, Credit Suisse estimates
From this analysis, we can draw a few conclusions:
More FIDs required to avoid a long-term crunch
As gas demand rises particularly in the non-OECD, the world will need more LNG than just
the currently sanctioned projects. If there were no further FIDs on LNG projects, the global
LNG market would remain extremely tight throughout the second half of the decade, with
over >90% LNG utilisation until 2020 and a shortage of up to 40mtpa of LNG by 2020.
Given the long lead times between FID (Final Investment Decision) and start-up of 4-5
years, we need to see more FIDs in the next 1-2 years in order to alleviate tightness in the
latter part of the decade. We expect to see more LNG project sanctions in the next couple
of years, encouraged by high current spot LNG prices.
But many LNG projects won’t fly – there will be some losers
Our counter-consensus view is that China will not be a bottomless source of gas demand,
and that affordability issues in other developing countries will limit potential gas demand.
As a consequence, the world will need fewer LNG plants by 2020 than are currently
proposed. If all “speculative” LNG projects went ahead, the global gas market would
become severely oversupplied, with a potential surplus of 122mpta LNG by 2020. We
expect the vast majority of these “speculative” projects to be cancelled or delayed for
several years.
Later in this section, we lay out in more detail which LNG projects we believe will go ahead
and which are most at risk.
Global LNG capacity to increase by 61% by 2020E
We forecast that global liquefaction capacity will rise from 278mpta in 2011 to 449mtpa by
2020 in our supply Base case. Of the incremental 173mtpa of liquefaction capacity,
75mpta are already under construction and 97mtpa are ”possible” unsanctioned projects.
In addition, we have identified a further 88mtpa of “speculative” projects, which we do not
include in our supply Base case.
Global Gas 14
22 November 2011
Figure 6: Global LNG supply by country – Credit Suisse base case
Nameplate capacity in mtpa
0
50
100
150
200
250
300
350
400
450
500
2000
2001
2002
2003
2004
2005
2006
2007
2008
2009
2010
2011
2012
2013
2014
2015
2016
2017
2018
2019
2020
RoW
Trinidad & Tobago
Russia
Qatar
Oman
Nigeria
Malaysia
North America
Indonesia
Egypt
Australia
Algeria
Source: Wood MacKenzie, BP Statistical Review, Credit Suisse estimates
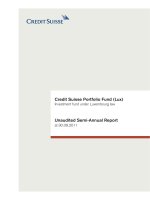
Australia adds 50% of incremental LNG supply by 2020E
Australia is the single largest contributor to future liquefaction capacity growth, overtaking
Qatar by 2017E as the world’s biggest LNG exporter. We forecast that Australia will add
91mtpa of LNG capacity between 2011 and 2020, or over 50% of total LNG incremental
supply.
This 91mtpa of new capacity includes 52mtpa from 5 sanctioned greenfield projects (Pluto
T1, Gorgon, QCLNG, Gladstone LNG, AP LNG, Wheatstone and Prelude), plus 39mtpa of
unsanctioned projects, of which 2 greenfields (Ichthys and Browse), and 4 expansions
(Gorgon T4, QCLNG T3, Pluto T2 and AP LNG T2).
Beyond Australia, other greenfield LNG additions could come from Russia (Yamal),
Nigeria (Brass LNG), Algeria (Arzew and Skikda expansion), Canada (Kitimat), East Africa
(likely both Tanzania and Mozambique), Papua New Guinea (PNG LNG), US (Cheniere’s
Sabine Pass), Angola (Angola LNG) and Indonesia (DS LNG and Tangguh T3).
Global Gas 15
22 November 2011
Global Gas 16
Figure 7: Top 10 LNG producers, 2010 and 2020E
Annual LNG production in mtpa
Figure 8: LNG capacity additions, 2020E vs 2011E
in mtpa
8.4
11.0
14.4
22.1
22.5
25.5
26.1
27.4
73.2
111.2
0 2040608010012
Oman
Egypt
T&T
Russia
Malaysia
Algeria
Indonesia
Nigeria
Qatar
Australia
0
2020 2010
5.2
5.9
6.6
7.0
7.5
8.0
9.2
10.0
15.0
91.1
0 20 40 60 80 100
Angola
US
PNG
Tanzania
Canada
Mozambique
Algeria
Nigeria
Russia
Australia
Source: BP Statistical Review, Credit Suisse estimates.
NB: this chart shows estimated LNG production rather capacity.
Source: BP Statistical Review, Credit Suisse estimates
Global LNG demand – Growth from Europe and Asia
We model LNG demand on a country-by-country or regional basis. Importantly, we do not
assume that LNG imports will simply “back-fill” the gap between potential gas demand and
the sum of domestic supply + pipeline imports, for two main reasons:
(1) In Europe, the spot market has behaved slightly uncharacteristically compared with
pure arbitrage economics. Almost 70% of gas is still supplied under oil-linked long-
term contracts with minimal take-or-pay obligations. European utilities have to buy a
certain amount of gas even if they don’t want it. Then they sell this gas at trading
hubs as it is uneconomical to produce electricity from it (coal is cheaper). This extra
gas has depressed spot prices compared with a pure arbitrage from Asia – we
believe this could continue. Hence, we assume that customers will take as much
LNG as possible, since a) spot European gas prices could remain substantially
cheaper than oil-linked gas prices (LNG imports tend to be priced off spot), b)
customers seek alternatives to Russian gas for political reasons. European
customers have sought to maximise LNG purchases for the last 10 years – LNG
imports have risen by 10% p.a. since 2000 while overall gas demand was up only
1.7% p.a. We see no reason for this behaviour to change, as we estimate that
Gazprom’s oil-linked gas prices will be around $14/mbtu for the foreseeable future
given high oil prices, well above current spot NBP prices (the forward curve
averages $10.5-11/mmbtu). We believe that in the absence of constraints on
regasification capacity and take-or-pay quantities, LNG imports effectively have
become “base-load” supply, while oil-linked piped gas represents the delta.
(2) In Asia, we believe it is wrong to simply assume that LNG will represent the delta
between domestic supply and gas demand. Potential LNG demand growth would
be well in double-digits if it were not constrained by affordability. Residually, we
also have some concerns over regasification capacity, although these are easier to
fix. We have built our Asian LNG demand forecasts on a country-by-country basis,
taking into account gas pricing and regasification capacity. Our forecasts of
Chinese LNG demand of 30mtpa by 2020 are below consensus.
22 November 2011
North America is the only region where LNG demand is the difference between domestic
supply and demand. There is clearly no shortage of regasification capacity in the US. In
our view, NAM should remain the market of last resort for LNG, with little ability to attract
cargoes away from higher-priced destinations (Asia and Europe). In the forecast period,
LNG into NAM represents Mexico, and keeping US regas terminals operational.
Figure 9: Global LNG demand by country – Credit Suisse base case
in mtpa
0
50
100
150
200
250
300
350
400
2000
2001
2002
2003
2004
2005
2006
2007
2008
2009
2010
2011
2012
2013
2014
2015
2016
2017
2018
2019
2020
NAM
Latam
MidEast
Europe
SouthEast Asia
India
China
Taiwan
South Korea
Japan
Source: BP Statistical Review, Credit Suisse estimates
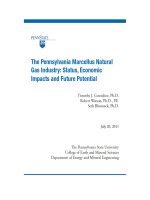
The composition of global LNG demand is set to shift subtly over the next decade.
■ Asia’s share of demand should remain stable at around 60%. Within this, the share of
traditional buyers (Japan and Korea, the world’s two largest LNG buyers) should
decline from 32% and 14% of global demand in 2010 to 26% and 9% respectively in
2020E. Meanwhile, the contribution of China and India to global LNG demand should
roughly double by 2020E to around 8% each. New markets in the Southeast Asia
should open up, such as Singapore, Thailand and potentially traditional LNG exporters
Indonesia and Malaysia. By 2020, we estimate that Southeast Asia could import
11mtpa of LNG, or 3% of global demand.
■ Europe should see a material rise in LNG demand as domestic gas production
declines and buyers seek alternatives to high-priced Russian gas. We forecast a
31mtpa increase in LNG imports or 4.3% p.a., slower than the 10% annual increase
seen in the last 10 years. Despite strong demand growth, Europe’s share of total LNG
imports should decline to 27% from 30%.
■ New LNG markets in Latin America and the Middle East should continue to grow,
and together could represent 10% of global demand in 2020E, up from 4% in 2010. In
particular, the Middle East could add 15mpta of LNG demand by 2020E due to rising
demand in Kuwait and Dubai (who already import LNG), and demand from new LNG
importing countries, Bahrain and Jordan.
Global Gas 17
22 November 2011
Figure 10: Change in LNG demand, 2020E vs 2011E
in mtpa
Figure 11: Composition of global LNG demand, 2020E
in % of total
-5 5 15 25 35
South Korea
NAM
Japan
Latam
Taiwan
SouthEast Asia
MidEast
India
China
Europe
Taiwan
5%
China
8%
Latam
4%
NAM
4% Japan
26%
South Korea
9%
India
8%
Europe
27%
MidEast
6%
SouthEast
Asia
3%
Source: Credit Suisse estimates.
NB: Grey bars represent China and Japan demand bull cases.
Source: BP Statistical Review, Credit Suisse estimates
Pricing is key – Asia won’t take LNG at any price
The consensus view is that pricing of long-term LNG contracts in Asia has strengthened
across the board in the wake of the Fukushima crisis. We think the reality is a little more
complex, as emerging gas supply sources (North American LNG, East African LNG,
Russian and Central Asian pipeline gas) are seen as offering lower-priced alternatives to
new Asian buyers.
Most long-term contracts signed in Asia in the last 1-2 years have featured a high slope to
JCC (Japanese Crude Cocktail) and a high oil price kink point, providing the LNG seller
with considerable upside to oil prices. The “norm” for recent long-term deals in the Asian
market has been a slope of 14-14.85% to JCC, with lower slopes of 11-12% above and
below the trigger points (upper and lower kink points). One of the most attractive deals
signed recently is Ichthys LNG, where a consortium of Japanese and Korean buyers have
agreed on a 15% slope to JCC with an upper kink point of $120/bbl.
However, we believe newer Asian LNG buyers (most prominently China and India) will
resist signing traditional long-term oil-indexed contracts – even in a post-Fukushima world
– given i) potential for domestic production, and ii) improving prospects for North American
and East African LNG exports, pointing to a looser market in the latter part of this decade.
Illustrating these trends, Qatar has struggled to sign long-term oil-linked contracts to Asia
in the last few years. Qatar aims to increase the proportion of its sales going into Asia vs
lower-priced markets by 20mpta (up from 30mtpa currently), but has so far failed to sign
long-term contracts with China and India in recent months. Qatar’s insistence on oil-parity
prices has been a hurdle for buyers not accustomed to paying high prices.
■ India: Qatar’s RasGas has tried to increase supplies to India’s Petronet by up to 5mtpa
from 2015 (in addition to the current 7.5mtpa contract), but pricing has been a
stumbling block. Petronet has expressed a preference for long-term deals linked to US
Henry Hub pricing, and is talks with Cheniere Energy (Bloomberg, 17 November
2011). In late September 2011, BG signed an MoU with Gujarat to supply up to
2.5mpta of LNG from 2014, and shortly thereafter signed an agreement to purchase
3.5mtpa of LNG from 2015 from Cheniere’s Sabine Pass LNG export project.
Global Gas 18
22 November 2011
■ China: In 2009, Qatar signed MoUs with CNOOC and PetroChina for 7mtpa in total,
but has not yet firmed up the agreements.
As a result of slow progress on the Chinese MoUs, Qatar has been forced to reduce its
price demands from full oil price parity (16% slope) to a slight discount to JCC, and has
given concessions to buyers such as a negative constant.
Even traditional North Asian LNG buyers such as South Korea are changing their
purchasing behaviour. In September 2011, Chevron was forced to take a Final Investment
Decision on Wheatstone without firming up a preliminary contract with Kogas, which
signed agreements with Shell and Total instead. Supply diversification away from Qatar
and Australia is said to be a key factor for Kogas. Kogas is also considering potential LNG
imports from Western Canada (where it owns stakes in Shell’s BC LNG project and Penn
West’s Cordova shale gas play), the US (it is in talks with Cheniere), Mozambique (where
it owns a 20% stake in the Eni-operated Block 4) and pipeline imports from Russia – all
lower-priced alternatives to oil-linked contracts e.g. from Australia.
Asian buyers moving upstream
In order to mitigate price-taker risk, Asian customers are increasingly attempting to take
material equity positions in LNG liquefaction projects – this is an interesting change from
the previous practise of Japanese and Korean customers of buying small (5% or less)
minority stakes in projects. This new approach of investing in upstream acreage and
liquefaction plants is seen as a way to be exposed to the entire LNG value chain and
therefore hedging pricing risk.
Sinopec has a 15% stake in COP/Origin’s AP LNG project, where it has also signed a
long-term contract underpinning the first train. Shell is aiming to build an export terminal in
Western Canada with PetroChina, Kogas and Mitsui. Mitsubishi and Kogas (along with 4
Japanese companies) have a 50% stake in Penn West’s Cordova Embayment shale gas
play. Malaysia’s Petronas has an 80% stake in a competing Canadian LNG export project
with Progress Energy, and has a 27.5% stake in the Santos-operated Gladstone LNG
project in Australia. Also, in Queensland, PetroChina and Shell have a 50/50 joint venture
in the Arrow Energy LNG project.
“Advantaged” LNG projects to win
Given sensitivities around pricing for newer LNG buyers, we believe pricing will be a key
consideration in whether a project will succeed or not. The issue is that high construction
costs on new projects are making it difficult for sellers to offer competitive pricing terms.
Liquefaction costs have increased in recent years to c.$1,000/ton of annual capacity.
We think the best positioned LNG projects are those with the lowest all-in capital costs,
which could due to a number of factors, including: 1) the presence of existing infrastructure,
making brownfield expansions more economic, 2) low upstream production costs thanks to
geological factors, 3) associated liquids content, 4) favourable fiscal terms, 5) proximity to
consuming markets resulting in low transportation costs, particularly to Asia.
Beyond purely economic factors, we think some buyers (particularly traditional buyers in
East Asia) continue to value security of supply and will therefore retain a preference for
exporting countries seen as “lower risk”. We note that Japan did not participate in Yemen
LNG. Companies with only one or two LNG projects in their portfolio may find it more
difficult to persuade buyers to sign long-term contracts than larger companies with
diversified supply portfolios.
Offsetting possible reluctance from Japanese buyers to buy from countries seen as “higher
risk”, supply diversification away from LNG behemoths Qatar and Australia is an
important consideration for South Korea. All things equal, we think Kogas may prefer to
buy LNG from new exporters such as Canada, the US, Mozambique or Russia rather than
from Qatar and Australia.
Global Gas 19
22 November 2011
Finally, technological risk is another important factor. Rightly or wrongly, buyers tend to
attach more risk to “unconventional” LNG projects such as coal-bed-methane to LNG or
Floating LNG than to conventional projects, due to a perception of greater delivery risk. As
recently as 2-3 years ago, CBM-to-LNG projects in Queensland were viewed by buyers
with some suspicion, as the combination of the two technologies of coal-bed methane and
LNG had never been done before. It was feared that issues around e.g. ramp-up gas and
de-watering would be show-stoppers, until they turned out to be manageable.
Similarly, Shell’s Prelude floating LNG project was sanctioned largely because Shell was
able to guarantee supply to customers from its global LNG portfolio – so that if the project
failed to take off or was delayed, customers would still have security of supply. Shell took
FID on Prelude in May 2011, underpinned by 2.8mtpa of contracts with Osaka and CPC
from its global portfolio, and subsequently signed an MoU with Kogas in August 2011 for
the project’s entire 3.6mtpa offtake. We believe that many floating LNG projects proposed
by smaller players with no technological track record and no global LNG portfolio (e.g. Flex
LNG, Hoegh LNG) will find it significantly more difficult to secure customers.
LNG cost curve
In Figure 12 below, we show our estimated LNG cost curve – blue bars represent
sanctioned LNG projects and striped grey bars show pre-FID projects. An important
caveat is that there are still many unknown factors driving these projects’ economics, most
notably capex (for nearly all projects) and in some cases fiscal terms (e.g. Mozambique).
Therefore, the cost curve below should be seen as indicative only. Costs at new offshore
Australian hubs such as Gorgon and Wheatstone should also fall.
Figure 12: LNG projects breakeven prices (Striped bars = pre-FID projects)
in $/mcf
0
2
4
6
8
10
12
14
16
Darwin
North West Shelf
PNG LNG
Prelude
Ichthys
Tangguh T3
Cheniere
QCLNG
Arrow
Tanzania
Gorgon
Sunrise FLNG
Kitimat
APLNG
Mozambique
Browse
Abadi FLNG
Pluto 2
Yamal
Shtokman
Pluto 3
GLNG
Wheatstone T1-2
Pluto 1
Source: Company data, Wood MacKenzie, Credit Suisse estimates.
NB: Breakeven price defined as FOB LNG price for a 12% IRR (nominal) over full project cycle, excluding M&A premium. Cheniere assumes
$5.5/mcf Henry Hub.
Winners vs Losers - What projects will make the cut?
Specifically, we think projects which have a strong likelihood of being sanctioned include:
(1) Brownfield expansions in Australia and elsewhere with sufficient gas reserves,
such as APLNG T2, Gorgon T4 (and maybe T5), Wheatstone Hub, Tangguh T3
and QCLNG T3. The attraction from brownfield expansions are the economies of
scale that come from sharing basic utilities and infrastructure (up to 30% on the
downstream costs). There are also other synergies achieved from the sequential
building of the trains if the sanctions are taken within 18-24 months of each other –
so delays in sanctioning expansions would result in lower economies of scale.
Global Gas 20
22 November 2011
(2) Newbuild projects that are lower down the cost curve for various reasons we have
cited above, and/or have already started to contract long-term supply under Heads
of Agreements. These projects include: Ichthys (Australia) for its associated liquids
content and proximity to Asian markets, Kitimat (Canada), Sabine Pass (US) and
East African projects in Mozambique and Tanzania for low-cost gas supply, Brass
(Nigeria) and Yamal (Russia) for abundant reserves and political support. We note
Mozambique gas flow rates could be exceptionally strong and the fields are just
30km offshore (vs >200km offshore for Wheatstone).
… And which projects won’t?
We think pre-FID projects most at risk of slippage this decade are those with:
(1) Higher political and/or fiscal risk, such as Shtokman, Sunrise and NLNG T7. Not all
the proposed US liquefaction export schemes will be sanctioned if this leads to a
political backlash against domestic gas price increases, if these indeed occur
(much will depend on the 2012 election).
(2) Greenfield projects with high capital costs (Arrow Energy, Browse – which may end
up as backfill gas into the North West Shelf);
(3) Brownfield expansions with insufficient gas reserves as of today, such as Pluto T3,
Snøhvit T2, Sakhalin T3 and Angola T2.
(4) Greenfield projects at very early stages of conception (e.g. we have only included
Kitimat in Canada), although we believe Shell and XOM’s BC LNG projects will also
eventually go ahead.
Among the above projects, we have included Browse and Pluto T2 in our base case and
classified all others as “speculative”. We believe that affordability will deter potential
buyers (particularly in Asia) from signing long-term contracts. This may give “speculative”
projects time to address some of their issues. Political, fiscal or reserve issues are the
most likely reasons to delay a potential FID, in our view.
In terms of companies, we see BG and Shell as well-positioned to benefit from the next
wave of LNG supply additions this decade.
■ BG is building the two-train QCLNG plant in Queensland (which is 6 months ahead of
the next CBM-to-LNG project, Santos’ Gladstone LNG) and is looking to sanction a
third train by the middle of 2012. It is also well placed to source LNG from lower-cost
countries, through i) a proposed LNG export scheme in Tanzania with Ophir, ii) its
recent ground-breaking agreement to purchase LNG from Cheniere’s Sabine Pass
terminal at Henry Hub linked prices, iii) its proposed LNG export project at Lake
Charles.
■ Shell is the largest LNG producer among majors and is set to maintain its leadership
throughout this decade, with 8.3mtpa of LNG under construction (Gorgon, Prelude and
Pluto) and a further 10mtpa of potential LNG options (Arrow, Sunrise, Browse, Abadi,
BC LNG). Shell sanctioned the world’s first Floating LNG project, Prelude FLNG in
May 2011. We think its Floating LNG technology could help Shell gain access to other
gas resource opportunities at advantageous prices. We see its entry into Abadi
(Indonesia) with Inpex as an example of this strategy, with other moves likely to follow.
Global Gas 21
22 November 2011
Figure 13: Global majors LNG capacity, 2010-20E
in mtpa of equity LNG capacity
Figure 14: Global majors LNG capacity, 2011 vs 2016E
in mtpa of equity LNG capacity
0
5
10
15
20
25
30
2010 2011 2012 2013 2014 2015 2016 2017 2018 2019 2020
BP BG Shell Total
Eni Exxon Chevron
Shell
Total
BG
CVX
XOM
BP
Eni
0
5
10
15
20
25
Shell Exxon Total BG BP Chevron Eni
2011 2016
Source: Company data, Credit Suisse estimates. NB: Downstream
LNG exposure.
Source: Company data, Credit Suisse estimates. NB: Downstream
LNG exposure.
Figure 15: LNG gas as a % of total upstream production
in %
0%
5%
10%
15%
20%
25%
30%
35%
2010 2011 2012 2013 2014 2015 2016 2017 2018 2019 2020
BP BG Shell Total
Eni Exxon Chevron
Source: Company data, Credit Suisse estimates. NB: Upstream LNG exposure
LNG flows: Mostly regional, except for Qatari arbitrage
It is commonplace to say that the LNG market is becoming increasingly global, however
the reality is that LNG basins are still relatively regional, with the key exception of Qatari
cargo arbitrage between Europe and Asia.
The Pacific and Atlantic basins have historically been separate markets, until the ramp-up
of Qatari LNG mega-trains in 2009-11. The arrival of significant volumes of Qatari LNG
with flexibility in terms of pricing and destination changed this and increased the linkage
between the two basins. Qatar is almost equidistant in shipping terms between the Atlantic
and Pacific basins, and has both the capability and willingness to divert cargoes between
Europe and Asia. Effectively, the movement of Qatari LNG cargoes is one of the main
transmission mechanisms between Asian and European gas prices.
Global Gas 22
22 November 2011
LNG exporters other than Qatar primarily supply neighbouring countries, a trend we do not
expect to change in the future. For example, Atlantic Basin LNG exporters Nigeria and
Algeria mainly supply Europe (Spain, UK, France), and incremental LNG volumes from
North and West Africa (Skikda and Arzew in Algeria, Angola LNG, Brass in Nigeria) should
also be mostly destined for Europe. The three main Pacific basin producers (Indonesia,
Malaysia and Australia) almost exclusively supply Asian markets, and we expect new LNG
volumes from Australia to be overwhelmingly destined for Asia.
Cargo diversion opportunities to Pacific Basin until 2015
Our regional LNG supply/demand analysis suggests that the Pacific Basin should be
tighter than the Atlantic basin until around 2015. This mismatch between regional demand
and supply will have implications for global LNG flows.
■ During the 2011-15 period of structural tightness in Asia-Pacific, we should see
cargoes initially destined for the European or US market diverted to Asia – e.g. we
could imagine that some flexible volumes from Angola and Algeria could go to Asia
rather than Europe or the US (their original destination). Companies with access to
flexible Atlantic Basin LNG volumes should benefit, such as BG, BP, Total and Shell.
■ The situation is set to reverse after 2015, when the Pacific Basin could become well
supplied with LNG, or perhaps even oversupplied in our Base case if all projects are
delivered. We forecast up to 130mtpa of Pacific Basin LNG supply additions by 2020,
around 73% of global incremental LNG capacity. This compares with our forecast of a
58mtpa increase in Asian LNG demand over the 2011-2020 period (see Figure 17).
Even if only half of the “possible” projects in our database were sanctioned, the Pacific
Basin would still add 97mtpa of LNG capacity, outpacing demand growth.
Figure 16: Atlantic Basin LNG balance: Better supplied
LNG supply vs demand growth vs 2011E base in mtpa
Figure 17: Pacific Basin LNG balance: Famine, then feast
LNG supply vs demand growth vs 2011E base
0
5
10
15
20
25
30
35
40
2012 2013 2014 2015 2016 2017 2018 2019 2020
Supply (bear case) Supply (base case) Demand
0
20
40
60
80
100
120
140
2012 2013 2014 2015 2016 2017 2018 2019 2020
Supply (bear case) Supply (base case) Demand
Source: BP Statistical Review, Credit Suisse estimates Source: BP Statistical Review, Credit Suisse estimates
A well-supplied Pacific Basin in 2016-2020 means that some LNG volumes will have to
find another home. Cargoes that were diverted to Asia in 2011-15 will be sent elsewhere,
first and foremost to Europe but also to new demand regions such as the Middle East and
Latin America. For instance, we think a lot of flexible Middle Eastern LNG volumes (Qatar,
Yemen) could displaced by long-term Australian supply in the Asian market, and will have
to find customers perhaps closer to home – e.g. in the LNG-importing countries of the
Middle East such as Dubai and Kuwait.
Another factor to consider is transportation costs. High LNG tanker rates (currently over
$100k/day) make arbitrage economics more difficult to work given the long distances
involved in bringing cargoes from one continent to another.
Global Gas 23
22 November 2011
Where could we be wrong?
We are conscious that long-term forecasts have a habit of changing. The 2008 economic
crisis combined with the US shale gas revolution resulted in significantly weaker LNG
demand than anticipated, right at a time when Qatari LNG supply was rising strongly.
Similarly, unforeseen positive demand “shocks” can occur, such as Japan’s earthquake
and subsequent nuclear crisis.
The LNG market could be tighter than our forecasts in the event of:
(1) Delays to Final Investment Decisions: FIDs on more complex LNG projects have
a tendency to slip to the right. For example, the timetable on projects such as Brass,
Shtokman, Ichthys, Pluto Train 2 has been delayed by several years – up to a
decade in the case of Brass which has been on the table since 2003.
(2) Delays during construction of LNG projects, or teething problems during
ramp-ups. In Australia, the start-up of Pluto Train 1 has been delayed by up to a
year to March 2012 vs an original target of March 2011, then September 2011, due
to design flaws and labour shortages. Statoil’s Snøhvit LNG in Norway started up in
2008 but has experienced severe technical issues, with frequent shutdowns for
planned and unplanned maintenance resulting in late cargo deliveries.
(3) Unplanned supply outages: General liquefaction plant availability started to
deteriorate after 2006 for a variety of reasons – gas availability, technical problems
or worsening security. This culminated in 2009 and 2010 – up to 6.8mtpa of
capacity was offline in Nigeria, Algeria, Egypt and Libya due to various issues in
2010. Other exporters such as Indonesia and Oman have suffered continued
underperformance in the last few years due to a lack of upstream gas (see Figure
18). Indonesia’s declining exports to Asia since 2006 has led traditional buyers
(Japan, Korea, Taiwan) to seek additional spot or short-term supplies e.g. from
Qatar.
Figure 18: Algeria, Egypt, Nigeria, Indonesia and Oman have underperformed
in % annual utilisation (actual output /nameplate capacity)
50%
60%
70%
80%
90%
100%
110%
2000 2001 2002 2003 2004 2005 2006 2007 2008 2009 2010 2011E 2012E 2013E
Algeria Egypt Nigeria Indonesia Oman
Source: BP Statistical Review, Credit Suisse estimates
(4) Unplanned extended maintenance, similar to what Qatar saw in spring/summer
2010 when it unexpectedly extended maintenance at 6 LNG trains, reducing supply
by as much as 4.8mtpa on a full-year basis. Qatar’s actions have been widely
interpreted as a deliberate attempt to reduce supply and therefore support market
prices during a time of weak demand.
Global Gas 24
22 November 2011
(5) An unforeseen positive demand shock, such as Japan’s March 2011 earthquake
and subsequent Fukushima nuclear crisis. A milder earthquake in summer 2007
forced Japan to take 4 GW of nuclear capacity from the market and import LNG.
On the other hand, the market could be looser in the event:
(1) More LNG projects are sanctioned than we anticipate in our Base case – this is
illustrated by our supply Bull case, which assumes that all “speculative” LNG
projects identified in our database are sanctioned. Indeed, there is a risk that strong
LNG prices in the 2012-15 period could encourage more players to take FIDs on
their projects, notably in North America (such as BG’s Lake Charles, Freeport LNG,
Cove Point LNG, Shell or XOM’s BC LNG in Canada and other proposed Canadian
export projects, PNG LNG T3 in Asia and expansions of East Africa schemes,
given the size of resources apparently found), but also on Floating LNG projects
and small-scale LNG plants (similar to the 2mpta Donggi Senoro LNG plant in
Indonesia).
(2) Unforeseen negative demand shocks, such as the recession of 2008-09.
Global Gas 25