The Zacks Rank Harnessing the Power of Earnings Estimate Revisions
Bạn đang xem bản rút gọn của tài liệu. Xem và tải ngay bản đầy đủ của tài liệu tại đây (117.3 KB, 20 trang )
The
Zacks
Rank
Harnessing the Power of
Earnings Estimate Revisions
Zacks.com is a service of Zacks Investment Research.
155 N. Wacker Drive, Chicago, IL 60606
Ph: 312.630.9880 Fx: 312.630.0954 E: URL: www.Zacks.com
2
INTRODUCTION
If you are now reading this guide, then it means that you are interested in learning
more about the Zacks Rank that has produced tremendous returns since inception
in 1988. How tremendous? Our top rated stocks have produced the following
results for investors:
• +34.2% average annual return since 1988 vs. +12.0% for S&P 500
• Outperformed S&P 500 in 15 of the last 16 years.
• +139.7% total return since 2000 vs. the worst bear market in over 60
years.
• +74.7% gain in 2003 YTD
On the following pages we will cover everything from the company background,
to the basics of our investment philosophy to using the resources available on
Zacks.com to beat the street. In the end we believe that you will feel the same as
these long time Zacks customers…
“I don't buy a stock unless Zacks says it's a Strong Buy”
Tim Mally
Madison, WI
“I can honestly say that I have never felt as confident in my trading, nor have I
been as profitable, as I have by using Zacks.”
Kurt Petrich
Norfalk, VA
“Just about every other online site I go to - WSJ, SmartMoney, CNBC,
Worldlyinvestor, Freerealtime, etc, reference is made to Zacks research. I
decided that I ought to just get the info first hand.”
Alan Scott
Cherry Hill, NJ
“I pay a lot of attention to sell recommendations from Zacks to dump stocks
before they go bad.”
LeRoy L. Lynn
Laramie, WY
Zacks.com is a service of Zacks Investment Research.
155 N. Wacker Drive, Chicago, IL 60606
Ph: 312.630.9880 Fx: 312.630.0954 E: URL: www.Zacks.com
3
WHO IS ZACKS?
Zacks Investment Research
Zacks Investment Research (ZIR) was formed in 1978 to compile, analyze, and
distribute brokerage research to both institutional and individual investors. The
guiding principle behind our work is the belief that there must be a good reason
why the brokerage firms spend over a billion dollars a year to research stocks to
recommend to their clients. Obviously these investment experts must know
something special that is indicative about the future direction of stock prices. We
were bound and determined to unlock that secret knowledge and make it available
to our clients to improve their investment results.
This massive undertaking requires us to annually process over 500,000 pages of
brokerage research produced by the 4,000 investment analysts employed by 250
U.S. and Canadian brokerage firms. In addition, each week we record 25,000
earnings estimate revisions and changes in brokerage firm recommendations.
Zacks provides this important data through our own web site at Zacks.com and
through partnerships with hundreds of other leading web sites who display our
information. This extensive outreach makes Zacks research the most widely used
investment research on the web.
Creation of the Zacks Rank
With this wealth of information at our disposal the team at Zacks set out to find
patterns in the brokerage research data that would serve as an accurate indicator
of the future direction of a stock. What we discovered is that…
Earnings per share (EPS) estimate revisions
are the most powerful force impacting stock prices.
This led to a groundbreaking article by Leonard Zacks, Ph.D., published in the
Financial Analysts Journal in 1979 entitled "EPS Forecasts - Accuracy Is Not
Enough". From this seminal work was born the Zacks Rank, which is a
quantitative model that uses 4 factors related to earnings estimates to classify
stocks into five groups; with 1 being the highest and 5 being the lowest. Since
1988 the Zacks #1 Ranked stocks have generated an average annual return of
34.2% vs. 12.0% for the S&P 500 (calculated through 3/31/04). We will go into
depth on the Zacks Rank on the following pages, but for now be sure to note that
the Zacks Rank is very different from the 1 to 5 Average Brokerage
Recommendation rating we make available on the hundreds of other investment
web sites. More on that later.
Zacks.com is a service of Zacks Investment Research.
155 N. Wacker Drive, Chicago, IL 60606
Ph: 312.630.9880 Fx: 312.630.0954 E: URL: www.Zacks.com
4
What Really Makes the Market Tick
No matter which school of investing you subscribe to, sooner or later the
movement in the stock price can be traced back to earnings. Over the subsequent
pages we will walk you through a series of logical steps in order to show just how
powerful a force earnings estimate revisions are on the price action of a stock.
And more importantly, how the Zacks Rank is a leading indicator that allows you
to get on board the stock early enough to enjoy robust gains.
Who Are Institutional Investors?
Institutional investors are the professionals who manage the trillions of dollars
invested in mutual funds, pension plans, hedge funds etc. Whereas the
retail/individual investor is all the John Q. Publics of the world who
independently invest for their own private accounts. Now here’s a simple
question. Who has the greater ability to influence the price of a stock;
institutional investors or individual investors? The answer, of course, is the
institutional investors who come to the market ready to trade millions of dollars
on a singular stock. And that financial muscle has a much greater effect on the
movement of the stocks they buy and sell. When you understand the power
institutional investors have on the market, then the next step is to try and
understand what motivates their buy/sell decisions.
Stock Valuation Models
Most institutional investors attended prestigious business schools where they were
taught a number of classical financial models. Many of these models help them to
calculate the fair value of a company and its shares based upon a number of
financial metrics. Almost without exception these valuation models focus on
earnings generated by these companies now and far into the future. Until
someone invents a time machine, then the only way to run these models based
upon future earnings is through the use of earnings estimates. On the simplest
level it can be understood that if you raise the earnings estimates used in the
model (input), then it will create a higher fair value for the company and its stock
(output). And visa versa for a stock with lowered estimates. Thus, it is imperative
to learn more about earnings estimates.
Where Do Earnings Estimates Come From?
The best and most widely used source of earnings estimates comes from the
brokerage analysts who track these publicly traded firms (a.k.a. Sell Side Analysts
– in that they “sell” their research to others like institutional investors or to the
brokerage firms retail clients…individual investors). These analysts work hand-
in-hand with company management to continually rethink every aspect that may
affect future earnings. Let’s look closer at the role of each of the two main players
who help to formulate these earnings estimates:
Zacks.com is a service of Zacks Investment Research.
155 N. Wacker Drive, Chicago, IL 60606
Ph: 312.630.9880 Fx: 312.630.0954 E: URL: www.Zacks.com
5
Company Management: All businesses need to create financial
projections of their future to properly plan for and manage operations.
Among other things they will certainly make earnings estimates for the
next several years. These estimates are then shared in some fashion with
the brokerage analysts who follow the firm. From there the analysts will
layer in some of their own assumptions that helps to create an independent
earnings estimate (more on Brokerage Analysts below).
An important thing to note is the motivation behind the estimates the
company will share with the analysts. You have to remember that most
corporate executives make a large percentage of their compensation from
ownership in the companies stocks (usually through stock option plans).
And these executives have learned over the years that when the company
misses earnings estimates, then almost without exception the stock price
will tumble and they will lose a considerable amount of money. Thus, it is
in their best interest to provide the brokerage analysts with fairly
conservative earnings estimates for the organization, which gives the firm
the best chance of meeting or exceeding estimates and keeping the stock
price aloft.
Brokerage Analysts: These 4000+ people form the heart and soul of the
research departments at the 250 brokerage firms throughout the U.S. and
Canada. Their job is to make profitable buy, sell, and hold stock
recommendations to the clients of the brokerage firm. Along with the
recommendation they must analyze the company fully and make financial
projections on the health of the company going forward. The most
important of these financial measures is the earnings per share (EPS)
estimate for upcoming quarters and years.
Among other things, analysts are judged by the effectiveness of their stock
recommendations. The better the firm’s clients do with the
recommendations, then the more valuable the analyst is to the firm. Just
like the corporate executives, these analysts have learned over time that
stock prices generally fall when companies miss estimates. Thus, as time
evolved analysts have learned to submit more conservative earnings
estimates for the companies they recommend in the attempt to make sure
that all meet or exceed the estimate.
(Note that over 10 years ago only about 50% of companies met or
exceeded earnings estimates every quarter. Now that number has moved to
80%+ as corporate executives and brokerage analysts have wised up to the
importance of creating conservative earnings estimates.)
Zacks.com is a service of Zacks Investment Research.
155 N. Wacker Drive, Chicago, IL 60606
Ph: 312.630.9880 Fx: 312.630.0954 E: URL: www.Zacks.com
6
Consensus Estimates
For any given stock there may be from 1 to 40 brokerage analysts following the
company and making EPS estimates. For over 20 years, Zacks has been tracking
these individual sell-side analyst estimates and creating consensus EPS estimates.
Long story short, there is no reason to rely on the estimate of just one analyst
when you can combine the intelligence of the whole analyst community by
creating a consensus estimate.
Zacks Consensus Estimate = The average of all EPS estimates made within
the last 120 days. Older estimates are not included.
Zacks calculates this consensus estimate for each of the next four fiscal quarters,
each of the next three fiscal years and as a growth rate over the next five years.
These consensus estimates are the benchmark by which the company will be
judged by the investment community. When actual earnings come out the
company will meet, exceed or miss estimates. Certainly the latter is the most
dreaded outcome for it is a clear sign of failure by the company and the share
prices will most likely tumble.
Estimate Revisions
The real value of brokerage analyst EPS estimates is not in the consensus but in
the changes in the individual brokerage analyst EPS estimates from the consensus.
As stated earlier, earnings estimate revisions are the most powerful force
impacting stock prices as proven by the work of Leonard Zacks Ph.D. back in
1979. That is why we go through the painstaking effort of promptly recording any
earnings estimate revisions into our systems. In fact, we receive daily electronic
files from almost all of the 250 brokerage firms and during an average week we
record over 25,000 estimate revisions made by these brokerage firm analysts.
These vital estimate revisions are delivered to Zacks.com members through the
web site and via their personal Daily E-mail Updates. More on that later.
Zacks Rank- The Key to Successful Investing
Now that you realize the power of earnings estimate revisions, the next logical
question is…How do I employ them to invest more successfully?
Well, not all earnings estimates are the same. Thus, we developed the Zacks
Rank, which is a special quantitative model based on trends in earnings estimate
revisions and EPS surprises that classifies stocks into five groups, #1, #2, #3, #4,
and #5 (#1 being the highest and #5 being the lowest). Since inception the Zacks
Rank has proven to be a very reliable indicator to predict future movements in
stock prices over a 1-3 month time horizon. How reliable has it been? During the
past 16 years the portfolio of Zacks #1 Ranked stocks have generated an average
annual return of 34.2% vs. the S&P return of only 12.0% during the same period.
Zacks.com is a service of Zacks Investment Research.
155 N. Wacker Drive, Chicago, IL 60606
Ph: 312.630.9880 Fx: 312.630.0954 E: URL: www.Zacks.com
7
Too often people do not appreciate how much more money would be generated at
34.2% annual return vs. 12.0%. The first mistake is to subtract the latter from the
former to say that the Zacks Rank is 22.2% better than the S&P 500. WRONG!!!
The second mistake is to divide 34.2% by 12.0% to show that the Zacks Rank is
185% better. Getting warmer, but still off the mark. That calculation only factors
the benefit of investing for 1 year. Now take this 154% improvement year after
year for 16 years (from 1988 to 2003). And that final measure is well north of
1000% improvement. Enough said.
See the table that follows for the yearly performance of the all the Zacks Rank
groups (1 through 5). You will discover that the Zacks Rank not only provides
profitable buy signals, but also points out those to sell now. As one of our clients
said…
“(The Zacks Rank) allowed me to identify losers faster to dump.”
D. Van Farowe
Seneca, CA
Year ZR1 – Strong Buy ZR2 – Buy ZR3 – Hold ZR4 – Sell ZR5 – Strong Sell S&P 500
1988 37.46% 29.69% 20.79% 19.13% 18.39% 16.20%
1989 36.09% 26.84% 15.85% 9.55% -5.10% 31.70%
1990 -2.97% -13.69% -21.32% -23.85% -34.71% -3.10%
1991 79.79% 56.80% 45.98% 36.60% 34.35% 30.40%
1992 40.65% 29.63% 18.04% 12.24% 17.31% 7.51%
1993 44.41% 26.86% 14.78% 8.59% 9.54% 10.07%
1994 14.34% 5.15% -3.56% -11.14% -10.90% 0.59%
1995 54.99% 46.84% 30.63% 17.35% 9.11% 36.31%
1996 40.93% 28.60% 16.07% 7.71% 8.02% 22.36%
1997 43.91% 33.87% 22.93% 10.17% 3.05% 33.25%
1998 19.52% 12.92% -3.47% -8.77% -14.84% 28.57%
1999 45.92% 35.53% 31.02% 18.46% 17.69% 21.03%
2000 14.31% -1.47% -17.75% -19.52% -3.95% -9.10%
2001 24.27% 11.70% 14.09% 17.93% 20.20% -11.88%
2002 1.22% -14.51% -19.39% -23.50% -17.59% -22.10%
2003 74.74% 71.02% 66.69% 57.34% 55.99% 28.69%
2004* 9.06% 7.25% 6.49% 5.27% 7.56% 1.69%
Annual
Average
34.16% 22.55% 13.03% 6.89% 6.08% 11.97%
*2004 YTD is calculated through March 31, 2004
Zacks.com is a service of Zacks Investment Research.
155 N. Wacker Drive, Chicago, IL 60606
Ph: 312.630.9880 Fx: 312.630.0954 E: URL: www.Zacks.com
8
Zacks Rank performance is the total return (price changes + dividends) of equal weighted
portfolios, consisting of those stocks with the indicated Zacks Rank, assuming zero transaction
costs. These returns are not the result of a backtest. Zacks has been providing its clients with
the Zacks Rank on a weekly basis since 1985. The stocks in the Zacks Rank portfolios were
available to Zacks clients before the beginning of each month (monthly rebalancing).
How is the Zacks Rank Calculated?
The Zacks Rank is based on four factors:
Agreement: Extent to which all brokerage analysts are revising their
EPS estimates in the same direction. The more analysts revising upward,
the higher the Zacks Rank.
Magnitude: Size of recent changes in current fiscal year and next fiscal
year consensus estimates. Ex. A 10% earnings estimate revision is more
powerful than a 2% revision.
Upside: Deviation between the most accurate EPS estimates and the
consensus. We know from years of experience that the most recent
estimate is in general the most accurate. Here again, you have to realize
there is no benefit for the analyst to put in a substantially higher estimate
unless he knows something special. This measure of upside is one of the
best early indicators of a potential earnings surprise. Over time investors
have dubbed the most recent estimate the “whisper number” of what is
actually expected when earnings comes out.
Surprise: Based on the last few quarterly EPS surprises. The more often
the company has posted a positive surprise in the past, the more likely they
are to surprise in the future (and visa versa).
Every night we recalculate these four factors for the universe of stocks covered by
the brokerage analyst community (approx. 4000 stocks). The 4 measures are
combined into a composite score, which is then used to assign a Zacks Rank.
Zacks
Rank
Recommendation
% of Stock
Universe
Approx. #
of Stocks
Average Annual
Perf. %
#1 Strong Buy 5% 200 34.2%
#2 Moderate Buy 15% 600 22.6%
#3 Hold 60% 2400 13.0%
#4 Moderate Sell 15% 600 6.9%
#5 Strong Sell 5% 200 6.1%
Zacks.com is a service of Zacks Investment Research.
155 N. Wacker Drive, Chicago, IL 60606
Ph: 312.630.9880 Fx: 312.630.0954 E: URL: www.Zacks.com
9
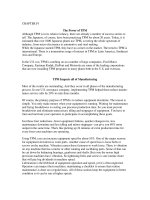
% of Stock Universe
0%
10%
20%
30%
40%
50%
60%
70%
Zacks Rank #1 Zacks Rank #2 Zacks Rank #3 Zacks Rank #4 Zacks Rank #5
As you will note the universe of stocks takes on a "bell-shaped" distribution when
divided by Zacks Rank. Thus, the #1 stocks are truly the "cream of the crop"
since they represent the top 5% of the stock universe experiencing the strongest
earnings estimate revisions. And given the increased attractiveness of these stocks
they have subsequently generated a return at twice the rate of the S&P 500 since
inception. Over the years the Zacks Rank has gained considerable notoriety as it
has even substantially outperformed other famed ranking systems such as the
Value Line Timeliness Rank.
Frequently Asked Questions
Time after time these 3 questions surface after reading this material. So, let’s arm
you with the answers now.
Question 1: Why does the Zacks Rank change so quickly? One day a stock is
rated as #1 and the next it could be #2 or lower.
Answer: The Zacks Rank is a very “sensitive” indicator that is updated daily
(note daily update of Zacks Rank is only available on our premium service
ZacksAdvisor.com. Our free site, Zacks.com, offers weekly updates). As you can
see, only 5% of the stock universe can be a #1 at any given time. That’s pretty
stiff competition for those premiere slots. However, if a Zacks #1 Ranked
company experiences any negative changes in their earnings estimates or other
companies have stronger revisions, then the Zacks Rank may quickly turn lower
for the stock. That is why we suggest that only short-term investors strictly
adhere to the process of buying stocks ranked #1 and sell positions when the rank
falls to #2 or below. Whereas longer term investors should use a more flexible
approach with the Zacks Rank whereby they buy or add to existing positions in
stocks ranked #1 and #2 and reduce holdings of stocks ranked #4 and #5. In short,
Zacks.com is a service of Zacks Investment Research.
155 N. Wacker Drive, Chicago, IL 60606
Ph: 312.630.9880 Fx: 312.630.0954 E: URL: www.Zacks.com
10
it is important to recognize that the Zacks Rank is a short-term indicator of
potential market out performance and must be used in that context.
Question 2: What value does the Zacks Rank have for a long-term investor?
Answer: As stated several times throughout this guide, the Zacks Rank is a
wonderful indicator of a stocks performance relative to the market over the next
1-3 months. However, as we have tracked this phenomenon over the last 20+
years we discovered that many companies experience extended cycles of positive
earnings momentum that leads to multiple consecutive quarters with a high Zacks
Rank. Thus, one could effectively use the Zacks Rank to uncover profitable long-
term holdings as well as short-term trading opportunities.
Let’s illustrate. Think of a publicly traded company as a long freight train. This is
a large entity with all of its energy pointing the train in one direction down the
tracks. If all the people who work on the train are doing their job well, then it
creates positive momentum and it will be hard to de-rail the train. This
corresponds with a well-managed company that is generating exceptional profits
quarter after quarter. Targeting these companies through the Zacks Rank can help
you turn a short term play into a longer term investment.
Now lets look at the flip side of the coin with a train that is headed in the wrong
direction. Mostly likely ineffective management strategies and poor execution led
this train astray. Now imagine how much effort it takes, not only to stop this train,
but to effectively turn it around in a positive direction. This corresponds to
companies that have a chronic problem of missing or lowering earnings estimates.
Rarely is this just a “one quarter” event as company management would lead you
to believe. Thus, best to stay away from these companies that will show up in the
Zacks #4 or $5 category until they can truly turn around and get the organization
headed in the right direction as will be indicated by a Zacks Rank of 1 or 2.
Question 3: What is the difference between the Average Brokerage
Recommendation (ABR) and the Zacks Rank?
Answer: Zacks displays the ABR for stocks for free on hundreds of leading
investment web sites. The ABR is simply the calculated average of the actual
recommendations by the brokerage firms for any given stock (strong buy, hold,
sell etc). The ABR is also shown in a range between 1 and 5 like the Zacks Rank.
However, you will generally see it displayed with decimals places (ex. 1.52)
whereas the Zacks Rank is only shown in whole numbers (1,2,3 etc.). However,
their differences go far beyond these cosmetic issues. In essence, the ABR is
based off of brokerage firm stock recommendations, which have proven to be an
unreliable indicator of a stocks performance. Note that only 8% of current
brokerage recommendations are Sell or Strong Sell. That means that the
remaining 92% are Strong Buy, Buy and Hold. Pretty scary when you consider
Zacks.com is a service of Zacks Investment Research.
155 N. Wacker Drive, Chicago, IL 60606
Ph: 312.630.9880 Fx: 312.630.0954 E: URL: www.Zacks.com
11
the market was falling off a cliff the last 3 years and none of these guys was
telling customers to sell their stocks. Further, there is no statistical proof that a
Strong Buy is a better investment than a Buy or a Hold or even a Sell. Whereas
the virtues of the Zacks Rank have been proven unequivocally over the last 15
years. Not to mention that we have just as many buy recommendations as sell
recommendation in the Zacks Rank model. So, why pay attention to the ABR?
Good question. Maybe that’s why we give it away for free ;-)
Zacks Rank in Action – What Causes the Stocks to Rise
This is where the rubber meets the road. So far we have discussed all the elements
individually, but now we will put the pieces together to see just how the Zacks
Rank can alert you that a stock's price may be about to rise. To illustrate this
process we will use an imaginary company; XYZ Corporation.
Step 1: Brokerage Analysts Start to Upwardly Revise Earnings Estimates
Maybe the "sell side" brokerage analysts saw something in a quarterly earnings
report. Or maybe the notion came from meetings with management. Regardless,
when the analysts sensed that things are going better than expected at XYZ Corp.
they started to increase their earnings estimates for subsequent quarters. This
information is then immediately sent to their clients ("buy-side" analysts and
money managers) and yes, the folks at Zacks Investment Research.
Step 2: Daily Updating of the Zacks Rank- Your Personal Signal
Every night the 4 factors of the Zacks Rank are calculated and the whole universe
is reclassified into their appropriate rank. Given the upward surge in EPS
estimates for XYZ it is now a Zacks #1 Ranked stock. This important data is
updated daily to our powerful institutional clients and to subscribers of
ZacksAdvisor.com. We provide a weekly update for free on Zacks.com, which
still gives you plenty of time to react as noted in Step 3.
Step 3: Institutional Money Starts Flowing into the Stock
Almost everyone will agree that the institutional investors (mutual funds, pension
plans, money managers etc) have the greatest buying power to influence a stock's
price. Well as previously noted, most of these institutional investors employ
valuation models that use earnings estimates as a prime component. Thus, when
they buy new research from the sell side brokerage analysts that says that EPS is
going up for XYZ, then certainly their projected fair value for XYZ will also rise.
So now these institutional investors want to purchase more of this undervalued
security. However, since they have so much money to spend and don’t want to
run up the price on themselves, they end up accumulating shares over the coming
weeks and months. This gives the individual investor plenty of time to sneak in
ahead of the slower moving institutions to reap the rewards of the rising share
price.
Zacks.com is a service of Zacks Investment Research.
155 N. Wacker Drive, Chicago, IL 60606
Ph: 312.630.9880 Fx: 312.630.0954 E: URL: www.Zacks.com
12
Step 4: Momentum & Technical Analysis Investors Jump on the Bandwagon
There is a vast legion of investors who employ charting and quantitative models
that look for trends like a rising share price and the increase in daily trading
activity to spot winning stocks. In general they believe that a stock on the rise
will continue its ascent over the short-term. Therefore, given the impetus in the
stock price and volume from the institutional investors in Step 3, these
momentum and technical analysis investors may jump on board XYZ for a short-
term profit and drive the price even further.
Step 5: Earnings Surprise
Nothing catapults a stock faster than a strong earnings surprise. And when you
buy a Zacks #1 Rank stock you highly increase your chance of owning companies
that will post a positive earnings surprise. That is because 2 of the 4 factors used
in the Zacks Rank look for stocks with the strongest potential to post a positive
earnings surprise (Upside and Surprise). So, in the case of XYZ Corporation's
stock, you would certainly profit if they announced a stellar earnings report.
Step 6: Rinse and Repeat
If indeed XYZ Corporation posted an upside earnings surprise and gave solid
guidance for the future, then it is very likely that this positive cycle will start all
over again at Step 1. And that is how the short-term benefits of the Zacks Rank
begin to carry over into a major benefit for long-term investors.
Conclusion
In many cases the Zacks Rank is the earliest possible signal you will receive about
the future potential of a stock. And Zacks.com (and ZacksAdvisor.com) are the
services designed to give the individual investor an edge in beating the street with
this timely information. Please note that this chain of events also plays out when
the Zacks Rank falls to a #4 or #5, but to the detriment of the share price (and
your portfolio). So you can use any negative signal to sell or lower your exposure
to a company whose rank has fallen.
Zacks Rank – A Tool For Every Investor
There are many different schools of investing. Yet the Zacks Rank has been
proven effective for most of them due to its reliance on the two of the most
important investment criteria; Earnings & Timeliness. Below we have grouped
some of the major classes of investors. See how the Zacks Rank can help each
group improve their investment results.
Value Investors
Value investors are looking for stocks selling at prices under their "fair value" and
have the patience to wait for other investors to see the same inherent value that
they do. Many value investors rely on earnings measures like P/E (price/earnings
multiple) or PEG ratio (PE divided by growth rate) to figure out the fair value of a
Zacks.com is a service of Zacks Investment Research.
155 N. Wacker Drive, Chicago, IL 60606
Ph: 312.630.9880 Fx: 312.630.0954 E: URL: www.Zacks.com
13
stock. The problem is always in estimating the fair value of a stock because many
times it is truly in the eye of the beholder. Also, their return on investment (ROI)
may be sapped as they wait endlessly for the stock to rise.
The key for value investors who turn to the Zacks Rank is our emphasis on
earnings, which is the basis of most valuation models. Remember that every night
Zacks ranks 4,000 stocks on the market to find those that have experienced the
largest and most frequent earnings estimates revisions. When the Zacks Rank
signals a "Strong Buy" or "Buy" (#1 or #2) it means that earnings estimates are
going dramatically higher for a firm and most likely other investors will think it is
undervalued given this new information. So, they jump in to run up the price of
the stock. The beauty is that this is also a timeliness rating, which should help
them shrink the holding period of the stock. i.e. They will reach fair value in a
shorter period of time that helps them maximize their ROI.
Value investors may want to take one further step in their stock selection and that
is to screen the #1 list for stocks with PEG’s under 1.5. Rarely is a stock
considered a value above this mark. On Zacks.com you will find one of the most
robust stock screeners on the web. More details later on.
Long-term Investors
Long-term investors like to "buy and hold" the stocks in sound companies for a
long time. They seek a company of value and virtue, which they believe will
consistently report solid earnings pushing the share price ever higher. They do
not worry as much about short-term volatility in the share price. The key
ingredients for a long-term investor are the fundamentals like; earnings growth,
strong management/leadership, excellent products, competitive strategy etc.
What is the most tangible proof that a company is worth holding for the long-
term? Earnings. Or more specifically earnings growth. That is because a
company that has strong management, excellent products etc. should be producing
a steady stream of positive earnings. Here again earnings estimate revisions are
the cornerstone of the Zacks Rank. Generally when you find positive earnings
revisions you will find a company moving in the right direction and is a candidate
for long-term ownership. (Also remember the example in the FAQ section about
companies being like large freight trains. You want them headed in the right
direction.)
Note that large-cap companies are usually best suited for long term ownership as
they generate a steadier flow of earnings. Thus, you may want to narrow your
focus to stocks ranked #1 and #2 with market caps above $10 billion.
Growth Investors
Growth investors are generally more aggressive in nature. They are looking for
companies with high earnings growth potential, which should propel their stock
price in the future. Growth stocks usually come with a bit more risk, since high
Zacks.com is a service of Zacks Investment Research.
155 N. Wacker Drive, Chicago, IL 60606
Ph: 312.630.9880 Fx: 312.630.0954 E: URL: www.Zacks.com
14
earnings growth (generally considered about 20% a year) is hard to sustain over
the long haul. And when the high growth dissipates, then the stock's shrivels up
like a popped balloon.
Once again we find a group of investors that is focused on earnings. In particular
companies that exhibit above average earnings growth (20% plus). By
concentrating on the Zacks #1 Ranks you could easily screen for companies
exhibiting these stellar growth rates. The best part is that the Zacks Rank will
alert you at the earliest possible stage that future prospects for the firm are looking
very bright, which generally leads to higher share prices. And just as importantly
we will let you know of the first sign of earnings weakness so you can sell your
position at the earliest possible stage to avoid unnecessary losses.
Momentum and Technical Analysis Investors
These folks are generally interested in turning short-term profits based on the
general direction/momentum of the stock and changes in daily trading volume.
Investors Business Daily (IBD) and other charting software providers are the
biggest "torch-bearers" for this movement.
The Zacks Rank is a great fundamental companion to folks who rely on technical
analysis and momentum because it tips them off before most other systems.
Essentially we are talking about "cause and effect". The cause of the move is first
sounded off by the Zacks Rank system that looks for positive revisions in
earnings estimates. This upward shift in earnings estimates prompts more and
more investors to find interest in the company with the effect being that the shares
in the company start on a bull run. Volume increases, as does the stock price.
However, if you were just to rely on technical analysis, then your chart would not
show a buy signal 'til the rally already started. i.e. In many cases you will be able
to get in right at the outset of the major move in the stock which will increase
your total ROI on the trade. (To see how this happens refer back to Step 4 of
"Zacks Rank in Action -What Causes Stocks to Rise" on page 11.)
Momentum and technical analysis investors should concentrate on stocks with a
Zacks Rank of 1. More specifically, those stocks most recently added to the #1
list have the best chance to outperform the market over the next 1-3 months. Our
strength in this category was best summed up by the Zacks customer below…
“Timeliness of (Zacks) stock recommendations. Can see the action unfold in
Investors Business Daily vol.% leaders and losers almost to the day. Why?
Where the action is!”
Thomas W. Morse
Seattle, WA
Zacks.com is a service of Zacks Investment Research.
155 N. Wacker Drive, Chicago, IL 60606
Ph: 312.630.9880 Fx: 312.630.0954 E: URL: www.Zacks.com
15
Zacks Rank – Limitations
For as powerful an investment tool as the Zacks Rank is, it is by no means fool
proof. Below are listed the main limitations of the Zacks Rank. Without
considering these potential shortfalls, then you may be apt to make poor
investment decisions that greatly affect your personal wealth and that is the last
thing we want to see happen. So, be sure to understand this section fully before
you attempt to use the Zacks Rank to enhance your investment returns.
Performance Relative to the Market
The most powerful force affecting any individual stock is the movement of the
overall market. As such it is very difficult for a stock to rise in the face of a bear
market. We can see countless examples of this happening during the market
downdraft since 2000. Thus, it is better to think of the Zacks Rank as an
indication of a stocks relative performance to the overall market. For example, if
the market is tumbling down then a #1 Ranked stock will most likely be down,
but not as much as the overall market. And when the overall market is up, then a
#5 ranked stock may very well be up, but not to the same degree as the average
stock. Yet it is interesting to note that the Zacks #1 Ranked stocks overall did
produce profits in 2000, 2001 and 2002 (+14.3%, +24.3% and +1.2% respectively
during this bear market stretch.)
Short Term Indicator
With 16 years of data behind us we know conclusively that the effects of earnings
estimate revisions are good for a 1-3 month time frame. This makes sense when
you consider that every 3 months a company will provide a new round of earnings
that wipes the slate clean on any previous announcements. Yet, even long term
investors get caught up with the fever for wanting to own just #1 stocks.
Unfortunately being long term and a #1 ranked zealot are not compatible.
Remember that only the top 5% of companies receiving positive estimate
revisions in the last 60 days will be a Zacks Rank of 1. There is pretty stiff
competition for those slots in the top 5% and a company can be on today and be
off tomorrow if another company receives stronger estimate revisions. However,
that company that slipped out of the #1 ranked position may still be an excellent
investment. So, long term investors should be comfortable with ownership of
shares that are ranked between 1-3. Then use any slippages to #4 or #5 to trim or
completely sell your position in the stock.
Blind to Everything, But 4 Measures
There are only 4 measures used to calculate the Zacks Rank. Three of the four measures look at
analyst earnings estimate revisions; Agreement, Magnitude, and Upside. The fourth measure
considers the size of the most recent earnings surprise. (Be sure to review this section starting on
page 6). You will note there is no accommodation for other fundamental metrics such as P/E,
book value, ROE, ROA, debt ratios, growth rates etc. Nor does it consider technical attributes
such as recent changes in price or volume. Thus, in reality the Zacks Rank acts as an initial filter
that provides a raw list of potentially successful investment candidates. With these raw lists you
Zacks.com is a service of Zacks Investment Research.
155 N. Wacker Drive, Chicago, IL 60606
Ph: 312.630.9880 Fx: 312.630.0954 E: URL: www.Zacks.com
16
can do additional screening according to your own investment criteria. You will find a robust
screener for free on Zacks.com that is perfect for this task.
Market Cap Bias
The larger the company, the more analysts are likely to cover the stock. The more
analyst to cover the stock the tougher it is for the stock to score big on any of the
4 measures of the Zacks Rank. Thus, the list of Zacks #1 Ranked stocks will be
over represented by small to mid cap stocks. That is why a large cap stock with a
Zacks Rank of 2 is actually a very good thing and one with a Zacks Rank of 3
may still provide excellent upside potential relative to the overall market.
Remember to keep a diversified portfolio that includes a mix of stocks by market
cap and by industry (discussed further below).
Too Many Speculative Stocks
Speculative stocks (such as technology, internet and bio-tech) have the hardest to
predict earnings outcomes. That’s because small companies make up the bulk of
the speculative stock universe and due to their size they do not get as much
coverage by brokerage analysts. Further the uniqueness of their product lines
makes revenue and profit predictions very difficult. When things go well for these
companies, then the above attributes lead to exceptionally high scoring for the
Zacks Rank. So, those who strictly adhere to the buying stocks Ranked #1 may
end up having a disproportionate number of small growth companies in the tech,
internet and bio-tech industries. At times that may be of benefit, but that has
certainly not been the case since March 2000. Here again, the need to keep a
diversified portfolio should always outweigh an investors desire to blindly invest
in #1 stocks because you do not want to be severely over-weighted in any one
sector.
Zacks.com – Profit from the Pros
Zacks.com was designed to help individuals become more successful investors by
tapping into insights and recommendations from those rare few experts with a
track record of beating the street. And that is why our motto is “Profit from the
Pros.” The first step in the journey to help people Profit from the Pros was
accomplished by making the Zacks Rank available to the public for the first time
on the Zacks.com web site (after many years of just being available to
professional investors and Wall Street insiders). We then added many additional
features to the site to further empower individuals to research, select and track
their investments more effectively. Below you will find a synopsis of the main
features of the Zacks.com web site that you can use to become a more successful
investor.
Zacks #1 Ranked List – Updated Weekly
Every Monday we will keep you posted of all the new additions and deletions to the Zacks #1
Ranked list. You can see this list in full and broken down by industry. You will definitely want to
be up to date on the changes on this exclusive list.
Zacks.com is a service of Zacks Investment Research.
155 N. Wacker Drive, Chicago, IL 60606
Ph: 312.630.9880 Fx: 312.630.0954 E: URL: www.Zacks.com
17
Profit from the Pros – Weekly E-mails
We have 3 free weekly Profit from the Pros emails that encapsulate the best
information available from Zacks.com. Here is the essence of each version.
Profit from the Pros: The Zacks Way - This version will concentrate on exclusive
strategies from Zacks Investment Research. These time-tested models rely heavily
on earnings estimate revisions and the Zacks Rank to select winning stocks.
Expect delivery before market opens on Wednesdays.
Profit from the Pros: Best of Wall Street I and II - Zacks uncovers those rare few
investment experts with track records of beating the street and brings their
insights to you. Version 1 should arrive before the market opens on Tuesdays and
Version II early am on Thursdays
If you do not already receive these e-mails, then register for free at:
/>
Personal Portfolio Tracker & Daily E-mail Update
Once you begin to understand the power of earnings estimate revisions, then you
will want to keep informed of every change in estimates for the stocks you follow.
And that is why Zacks.com makes available to you one of the most robust
Personal Portfolio Trackers on the web to stay on top all the pertinent information
that really has an effect on your investments. When you establish a personal
portfolio on our web site it also kicks into motion our Daily E-mail Update
feature. This e-mail will be your early morning wake up call that quickly spells
out any changes in earnings estimates, Zacks Rank or brokerage
recommendations for the stocks you follow so that you readily know what moves
you need to make that day to stay one step ahead of the market. (Note that we
have created a “Daily Update View” on our Personal Portfolio tracker so that you
can see all the important data pile up in real time and not have to wait for the
Daily E-mail Update to arrive in your in-box). Get started at
/>.
Screening for Stocks
Zacks created the first and best screening system on the web and that’s what
earned us the distinction as the “#1 site for screening stocks” by Money
Magazine. With our online custom stock Screening, you can sift through over
4,000 stocks using the Zacks Rank and up to 95 other variables – many of which
are unique to Zacks and can identify stocks that will outperform:
- Estimate revisions
- EPS surprises
- Changes in broker recommendations
- And just about every fundamental metric you can think of
Zacks.com is a service of Zacks Investment Research.
155 N. Wacker Drive, Chicago, IL 60606
Ph: 312.630.9880 Fx: 312.630.0954 E: URL: www.Zacks.com
18
In addition, we have created many predefined screens that give you "one-click"
access to stocks that meet certain investing criteria. Instructions for this exclusive
Screening tool can be found on the Zacks.com site. Start screening today at
Research. Research. Research
Zacks is famous for the value of its investment research and when it comes to
research options on the Zacks.com web site, you will certainly not be
disappointed. Simply go to www.Zacks.com and put in the ticker symbol for any
stock you want, select the report option, then click GO.
Almost all the report options will provide you with the Zacks Rank, but you
should certainly go the extra mile to see all the individual estimates that were used
to compute the Zacks Rank. You can find all these individual estimates in the
“Detailed Estimates” report. Once there you will find each individual estimate for
the stock in question. Remember you want to own stocks where the most recent
estimates are higher than previous estimates. No better place to see that in action,
then on this unique report.
Much, Much More
It would take far too long to list all the tools that are available to you on
Zacks.com. What’s important to note is that we provide the necessary tools to be
a successful investor. That’s why we have won so many awards from prestigious
reviewers like Online Investor and Forbes “Best of Web”. Do yourself a favor
and start using the resources on the site and see what a difference it makes in your
investing performance.
Other Zacks Services
Ahead of the Market – Book by Mitch Zacks published 2003
Dig deeper into the Zacks Rank philosophy with this in-depth strategy book by
Mitch Zacks. Learn how to put the Zacks Rank to use to profit in both good
markets…and bad. Then learn 7 other investment strategies that have been proven
to beat the market. Find more details at:
Zacks Advisor – www.ZacksAdvisor.com
If you understand the power of the Zacks Rank and earnings estimate revisions,
but want an expert to help you select the best stocks on the list, then look no
further. The Zacks Advisor is the best way to share with you the insights of Ben
Zacks; the man SmartMoney describes as ''tougher than Wall Street and often
more accurate.'' Ben Zacks is one of the most listened to and respected experts on
Wall Street. He is co-founder of Zacks Investment Research and helped create the
Zacks.com is a service of Zacks Investment Research.
155 N. Wacker Drive, Chicago, IL 60606
Ph: 312.630.9880 Fx: 312.630.0954 E: URL: www.Zacks.com
19
proprietary Zacks' Rank stock picking system that is the cornerstone investment
philosophy used in this exclusive service.
Since it's inception in March of 1996, the Zacks Advisor's stock recommendation
portfolios have generated amazing results for our subscribers.
* Timely Buys: List of stocks to outperform the market over the next 1-3
months. This portfolio has posted gains of 561.9% since inception
(482.8% better than the S&P 500).
* Focus List: These stocks are hand-picked by Ben Zacks to outperform
the market over the next 12 months. According to independent industry
watchdog, Hulbert Financial Digest, the Zacks Focus List shows an
average annual gain of +14.7% versus a +9.1 for the Wilshire 5000 index
(this index is generally considered the best proxy for the overall market).
The Zacks Advisor is much more than a monthly newsletter. With your
subscription comes full access to the exclusive web site at ZacksAdvisor.com.
There you will find daily commentaries and stock recommendations to help you
invest more successfully in any market environment. Also, you will get a daily
update of the Zacks Rank for all stocks that we cover. This daily feed was
previously only available to professional investors.
Do yourself a favor. Start a free trial to the Zacks Advisor today to realize more
success with your investing for many years to come. Just go to:
www.ZacksAdvisor.com and sign up for a free trial today.
Zacks Advantage Program
Need help managing your money using the Zacks investment philosophy? Then
perhaps you should learn more about the Zacks Advantage Program (ZAP) where
Ben Zacks, President and Co-Founder of Zacks Investment Management, will
manage your money through our innovative separately managed account program.
This offers you all the benefits of diversification and outstanding performance,
along with a flexible portfolio to help you reach your investment goals during this
uncertain time. To learn more about how to invest with Zacks Advantage Program
go to:
Zacks Expert Advice
The concept for this site was borne in 2000 when the market started to fizzle. It
was a time when many individual investors began to learn that investing their
hard earned money was not something to toy around with.
From years of experience we realized that to be a successful investor people need
advice from professionals with a track record of beating the street in good
markets…and especially in bad ones. That is why Zacks Investment Research has
Zacks.com is a service of Zacks Investment Research.
155 N. Wacker Drive, Chicago, IL 60606
Ph: 312.630.9880 Fx: 312.630.0954 E: URL: www.Zacks.com
20
assembled the best investment experts in the business to offer their powerful
advisory newsletters to you on all the major investment topics; Stocks, Mutual
Funds, Bonds, Options, Futures etc. And best of all you can set up 30 day free
trials on each of these newsletters to insure that you find the one that best meets
your investment needs.
Zacks Expert Advice was launched in May 2001 and has been a tremendous
success since. You can get there anytime from the Zacks.com home page or go
their directly at: />.
Zacks Brokerage Research Report Service
As noted at the beginning, Zacks has relationships with over 250 brokerage firms.
We have partnered with many of them to make their exclusive in-depth research
reports available to our customers. Some are free and others are priced at
reasonable levels. We have created several ways for you to search through our
catalog of available research reports. The place to start is on the Zacks.com home
page in the upper left hand corner where you will find the entry point to this
valuable service. Or just click here: />.
Conclusion
The Zacks Rank has literally earned billions of dollars in profits for investors over
the last 16 years. We hope that you enjoyed this guide and will start to use the
tools available to you on our web sites in order to invest more successfully
yourself in the months and years ahead. The End.