chadha & holly (eds.) - interest rates, prices and liquidity; lessons from the financial crisis (2012)
Bạn đang xem bản rút gọn của tài liệu. Xem và tải ngay bản đầy đủ của tài liệu tại đây (2.01 MB, 293 trang )
Interest Rates, Prices and Liquidity
Many of the assumptions that underpin mainstream macroeconomic
models have been challenged as a result of the traumatic events of the
recent financial crisis. Until recently, it was widely agreed that short-term
interest rates were a sufficient instrument of monetary policy. However,
early on in the financial crisis interest rates effectively hit zero per cent
and so central banks had to resort to a set of largely untested instruments,
the purchase of financial assets under quantitative easing (QE). This
book brings together contributions from economists working in aca-
demia, financial markets and central banks to assess the effectiveness of
these policy instruments and to explore what lessons have so far been
learned.
jagjit s. chadha is Professor of Economics at the University of Kent,
Canterbury.
sean holly is Professional Fellow at Fitzwilliam College and Director
of Research at the Faculty of Economics, University of Cambridge.
Macroeconomic Policy Making
Series editors
Professor JAGJIT S. CHADHA University of Kent, Canterbury
Professor SEAN HOLLY University of Cambridge
The 2007–2010 financial crisis has asked some very hard questions of modern
macroeconomics. The consensus that grew up during ‘the Great Moderation’
has proved to be an incomplete explanation for how to conduct monetary policy in
the face of financial shocks. This series brings together leading macroeconomic
researchers and central bank economists to analyse the tools and methods neces-
sary to meet the challenges of the post- financial crisis world.
Interest Rates, Prices
and Liquidity
Lessons from the Financial Crisis
Edited by
Jagjit S. Chadha and Sean Holly
cambridge university press
Cambridge, New York, Melbourne, Madrid, Cape Town,
Singapore, São Paulo, Delhi, Tokyo, Mexico City
Cambridge University Press
The Edinburgh Building, Cambridge CB2 8RU, UK
Published in the United States of America by Cambridge University Press,
New York
www.cambridge.org
Information on this title: www.cambridge.org/9781107014732
© Cambridge University Press 2012
This publication is in copyright. Subject to statutory exception
and to the provisions of relevant collective licensing agreements,
no reproduction of any part may take place without the written
permission of Cambridge University Press.
First published 2012
Printed in the United Kingdom at the University Press, Cambridge
A catalogue record for this publication is available from the British Library
Library of Congress Cataloguing in Publication data
Interest rates, prices and liquidity : lessons from the financial crisis / edited by
Jagjit S. Chadha, Sean Holly.
p. cm. – (Macroeconomic policy making)
Papers presented at a conference held in Cambridge, England in Mar. 2010.
ISBN 978-1-107-01473-2 (hardback)
1. Interest rates. 2. Monetary policy. 3. Global Financial Crisis, 2008–2009.
I. Chadha, Jagjit. II. Holly, Sean. III. Title.
HG1621.I588 2012
339.5
0
–dc23
2011030680
ISBN 978-1-107-01473-2 Hardback
Cambridge University Press has no responsibility for the persistence or
accuracy of URLs for external or third-party Internet websites referred to
in this publication, and does not guarantee that any content on such
websites is, or will remain, accurate or appropriate.
Contents
List of figures page vii
List of tables ix
List of contributors x
1 New instruments of monetary policy
jagjit s. chadha and sea n holly 1
2 Liquidity and monetary policy
douglas gale 32
3 Interest rate policies and stability of banking systems
hans gersbach and jan wenzelburger 71
4 Handling liquidity shocks: QE and To bin ’sq
john driffil l an d m arc us m i lle r 108
5 Asset purchase policies and portfolio balance effects:
a DSGE analysis
richard harrison 117
6 Financial intermediaries in an estimated DSGE model
for the UK
stefania villa and jing yang 144
7 Central bank balance sheets and long-term forward rates
sharon kozic ki, eri c san tor an d l en a s uc han ek 172
8 Non-standard monetary policy measures and monetary
developments
domenico giannone, michele lenza, huw pill
and lucrezia reichlin 195
9QE– one year on
spen ce r d al e 222
v
10 What saved the banks: unconventional monetary
or fiscal policy?
michael wickens 233
11 Non-conventional monetary policies: QE and the DSGE
literature
evren caglar, jagjit s. chadha, jack meaning,
jam es warren and alex waters 240
Index 274
vi Contents
Figures
1.1 QE in a CC/LM framework page 9
1.2 UK policy rate and nominal GDP growth 12
1.3 Policy rates 13
1.4 Money multiplier 14
1.5 CPI and core inflation in Japan 15
1.6 Bank of England and Federal Reserve purchases of assets 17
1.7 Bank of England’s balance sheet – assets 18
1.8 Bank of England’s balance sheet – liabilities 19
2.1 Uncertainty about asset returns and risk preferences 57
3.1 Sectors of the economy 77
3.2 Repayments of entrepreneurs 88
3.3 Collapse of the banking system 91
3.4 Convergence to the consumption trap 94
3.5 Resolving a banking crisis 97
3.6 Preventing a banking crisis 99
4.1 Capital accumulation and real equity prices before and
after the 1929 stock market crash 109
4.2 Central bank total liabilities in the crisis (August
2007=100) 110
4.3 Portfolio balance and zero net investment 111
4.4 Liquidity shock shifts equilibrium from E to E´: stock
market falls in the short run 112
4.5 Effect of a liquidity shock that is expected to last for eight
quarters 114
4.6 Bursting of asset bubble leading to liquidity contraction 115
5.1 UK government bond portfolio and yield curve slope
1991–2010 119
5.2 Responses to conventional monetary policy shock 134
5.3 Responses to purchases of long-term bonds 136
5.4 Responses to asset purchase shock 137
5.5 Responses to contractionary demand shock 139
vii
5.6 Responses to contractionary demand shock with asset
purchase policies 140
6.1 Fit of the model 155
6.2 The estimated IRFs to a technology shock and to an
interest rate shock 159
6.3 The estimated IRFs to a shock to the quality of capital
and to a shock to bank capital 160
6.4 Historical decomposition 165
6.5 The estimated IRFs with and without credit policy 167
7.1 UK ten-year government bond yields 173
7.2 US ten-year Treasury yields 173
7.3 US central bank assets and claims to potential GDP 183
7.4 Federal Reserve bal ance sheet assets 184
8.1 Behaviour of US money stocks during the Great
Depression, 1929–39 198
8.2 Behaviour of euro area money stocks during the
financial crisis, 2000– 10 199
8.3 Spread between three-month EURIBOR and
three-month general collateral (GC) repo rate 202
8.4 Eurosystem balance sheet 205
8.5 Substitution of central bank intermediation for
interbank transactions 207
8.6 Eurosystem interest rate corridor and EONIA 208
8.7 Comparison of outturns with conditional forecasts
in Giannone et al. (2010) model 212
8.8 Impact of spread effects of non-standard measures
in Lenza et al. (2010) 217
11.1 Announcement effects 250
11.2 M4x 252
11.3 Year-on-year growth of M4x 253
11.4 Net non-deposit liabilities 254
11.5 Sectoral M4 money holdings 255
11.6 Year-on-year growth of money holdings 256
11.7 Reserves 257
11.8 Sectoral year-on-year growth of M4Lx 258
11.9 Impulse respon ses of the Harrison model 259
11.10 Impulse responses of the Gertler–Karadi model 261
11.11 Impulse responses of the Chadha–Corrado model 262
viii List of figures
Tables
5.1 Parameter values page 132
6.1 Some statistical properties of the data
(1979–2009) 150
6.2 Calibrated parameters 152
6.3 Prior and posterior distributions of structural
parameters 153
6.4 Simulated moments 156
6.5 Subsample estimates 157
6.6 The importance of the different frictions 162
7.1 Baseline results for US regressions 185
7.2 Alternative specifications for US regressions (1) 187
7.3 Alternative specifications for US regressions (2) 189
7.4 Panel regressions 191
11.1 MPC announcements regarding the asset purchase
programme 243
11.2 Types of asset bought with the creation of new
reserves (on a settled basis) 243
11.3 Announcement dates included in event study 245
11.4 Total impact of QE over event study on key variables 246
11.5 Balance sheet changes 255
11.A1 Descriptions and parameter values 264
11.A2 Parameter desc riptions and values 265
11.A3a Parameter descriptions and values 265
11.A3b Steady-state parameter descriptions and values 266
ix
Contributors
EVREN CAGLAR University of Kent, Canterbury
JAGJIT S. CHADHA University of Kent, Canterbury and CIMF,
Cambridge
SPENCER DALE Bank of England
JOHN DRIFFILL Birkbeck College, University of London
DOUGLAS GALE New York University
HANS GERSBACH Center of Economic Research at ETH Zurich and
CEPR
DOMENICO GIANNONE European Center for Advanced Research in
Economics and Statistics (ECARES)
RICHARD HARRISON Bank of England
SEAN HOLLY University of Cambridge and CIMF, Cambridge
SHARON KOZICKI Bank of Canada
MICHELE LENZA European Central Bank
JACK MEANING University of Kent, Canterbury
MARCUS MILLER University of Warwick
HUW PILL European Central Bank
LUCREZIA REICHLIN London Business School
ERIC SANTOR Bank of Canada
LENA SUCHANEK Bank of Canada
STEFANIA VILLA Birkbeck College, University of London
JAMES WARREN University of Kent, Canterbury
x
ALEX WATERS University of Kent, Canterbury
JAN WENZELBURGER Keele University
MICHAEL WICKENS University of York and Cardiff Business School
JING YANG Bank for International Settlements, formerly Bank of
England
List of contributors xi
1 New instruments of monetary policy
Jagjit S. Chadha and Sean Holly
1 Introduction
The chapters in this volume are the outcome of a conference held in
Cambridge in March 2010. The title of the conference was ‘New instru-
ments of monetary policy’. Its purpose was to bring together economists
from academia, financial markets and central banks to discu ss some of the
challenges that arose from both the financial crisis itself and the response
to that crisis. Many of the assumptions that underpin mainstream (core )
macroeconomic models have been challenged as a result of the traumatic
events of the past three years. In particular, it became clear that the
modern, micro-founded, form of macroeconomic model failed to allow
adequately for the financial sector.
This failure, in part, reflected the belief that one could safely separate
issues concerned with financial stability from the conduct of macroeco-
nomic policy: macroeconomic policy, and in particular monetary policy,
should be devoted to the stabilisation of inflation and output, and the short-
term nominal interest rate used as the instrument of policy. Although it is
well known that such a policy will be problematic when nominal interest
rates are close to the zero interest rate floor, in practice it seemed that policy
was successful in keeping the economy away from this region. The long
road to price stability in the UK led down a number of cul-de-sacs, from
monetary targets, shadow exchange rate targets, explicit exchange rate
targeting and inflation targeting – without and then with operational central
bank independence – and seemed to have arrived at its destination.
However, the exceptional circumstances of the financial crisis – which
first manifested itself as a liquidity crisis for financial intermediaries
1
– and
the consequent need to loosen monetary policy as much as possible, meant
We thank Francis Breedon, Alec Chrystal, David Cobham, Spencer Dale, Colin Ellis,
Douglas Gale, Richard Harrison, Sharon Kozicki, Marcus Miller, Huw Pill, Jan
Wenzelburger and Mike Wickens for helpful comments and conversations. All remaining
errors are our own. We also thank Jack Meaning for excellent research assistance.
1
See Chapters 2 and 8 in this volume on this point.
1
that the zero interest rate floor became the over-riding constraint acting on
monetary policy. It had been broadly expected that the economy would
operate at the zero lower bound for around only 2 per cent of the time at
2 per cent inflation targets.
2
But the eventual binding of the lower bound
constraint meant that so-called unconventional or new monetary policies had
to be adopted. In 2004 Bernanke et al. set out three types of response to the
zero interest rate floor. First, a communication strategy must be used to
influence expectations as to what interest rates and price levels will be in the
future. Second, there must be an expansion in the size of the central bank’s
balance sheet. Finally, there must be direct use of the composition of the
central bank’s balance sheet to change relative yields. These three principles
essentially encapsulate how central banks around the world responded in
different ways to the crisis.
1.1 Macroeconomics and the crisis
The financial crisis has pushe d the perennial questions of money and
banking back to the fore of macroecono mic analysis. Until recently, it
was widely agreed (at least outside of Frankfurt) that although the stock of
money had a role to play, in practice it could be ignored as long as we used
short-term nominal interest rates as the instrument of policy because
money and other credit markets would clear at the given policy rate.
Allied to this view was the belief that shocks to financial markets should
not especially matter for the conduct of monetary policy when you are
using the short interest rate as the main instrument over and above any
impact they will have on the forecast output gap.
3
But it has become increasingly difficult not to agree with the proposition
that fi nancial regulation, fiscal policy and even the objectives of overseas
policy makers may constrain the actions of monetary policy makers.
Indeed, in his June 2010 Mansion House speech, the Governor of the
Bank of England welcomed wholeheartedly the Chancellor’s plan to
recombine monetary and financial policy: ‘The Bank (will) take on
(responsibilities) in respect of micro prudential regulation and macro
prudential control of the balance sheets of the financial system as a
whole. I welcome those new responsibilities. Monetary stability and
financial stability are two sides of the same coin. During the crisis the
former was threatened by the failure to secure the latter.’ Indeed, prior to
the financial crisis a form of separation principle was in place, whereby
2
Bean (2003), for example, makes this point. Naturally a higher inflation target changes the
duration downwards.
3
We will discuss Poole’s (1970) analysis of this question in Section 2.
2 Interest Rates, Prices and Liquidity
monetary policy concentrated on inflation and financial or credit policy
was treated as essentially a matter of microeconomic regulation.
From the imaginary vantage point of the first few years of the twenty-first
century, the collapse of the separation principle would seem rather surpris-
ing. The new monetary policy consensus that emerged appeared to have
solved many of the technical problems of monetary policy management. A
representative view from this era, though written with circumspection, is
that of Ben Bernanke (2004), who argued: ‘Few disagree that monetary
policy has played a large part in stabilizing inflation, and so the fact that
output volatility has declined in parallel with inflation volatility, both in the
United States and abroad, suggests that monetary policy may have helped
moderate the variability of output as well my view is that improvements
in monetary policy, though certainly not the only factor, have probably been
an important source of the Great Moderation.’ He suggested several rea-
sons for this: (i) low and stable inflation outcomes promoting a more stable
economic structure; (ii) better monetary policy may have reduced the size
and distribution from which measured shocks are drawn; and (iii) variable
inflation expectations stop becoming an exogenous driver of macroeco-
nomic instability. But the most important was arguably understanding the
limitations of monetary policy. Bound by severe information constraints
about the correct model and the current state of the economy, monetary
policy concentrated on gauging the correct current level and prospective
path for short -term interest rates in order to stabilise inflation and aggregate
demand over the medium term. There was a general acceptance that a
simple rule was likely to dominate a fully blown optimal rule, which was, in
any case, always predicated on a particular model and subject to time
inconsistency.
From an older perspective, the Art of Central Banking predated the
Science of Monetary Policy and tended to define central banking not so
much in terms of a narrow price stability but also in terms of objectives
that might now be termed financial policy and involved policies to safe-
guard the continuing health of the financial system.
4
This art developed as
a response to the multiplicity of roles ‘grabbed’ by a developing central
bank but also fundamentally in response to crises. Bagehot (1873)
famously outlined the principles of central banking in a crisis: (i) the
central bank ought to lend freely at a high rate of interest to borrowers
with good collateral; (ii) the value of the assets should be somewhere
between panic and pre-panic prices; and (iii) institutions with poor col-
lateral should be allowed to fail. The general understanding of these
4
Compare the work of Hawtrey (1934) and Clarida et al. (2002).
New instruments of monetary policy 3
principles has been associated with the avoidance of banking panics in
England since the Overend and Gurney crisis of 1866, which was the
previous example of a bank run in the UK until Northern Rock in 2007.
The relevance of Bagehot’s principles for the current crisis has recently
been acknowledged by, among others, Mervyn King at the Bank of
England (King, 2010) and Brian Madigan at the Federal Reserve Board
(Madigan, 2009).
While short-term liquidity support, of varying kinds, was ultimately
offered by all major central banks following the August 2007 freeze in
interbank markets, another issue emerged shortly thereafter: how to deal
with the zero lower bound on interest rates. In each case, the response
has been to increase the size of the central bank balance sheet.
5
The basic
idea here has borrowed from an older literature in which ‘the size, com-
position and risk profile’ (Borio and Disyatat, 2009, p. 5) is used to
control financial conditions more generally. Because of imperfect substi-
tutability across financial claims and a degree of market segmentation,
a central bank that uses its balance sheet to alter the structure of pr ivate-
sector balance sheets can influence financial prices (Tobin, 1958) and
change the relative yields on assets (Brainard and Tobin, 1968 ). In this
sense, balance sheet operations are really forms of extended open market
operations with the objective of altering longer-term interest rates to an
enduring extent.
1.2 Non-standard monetary policies
In this volume we outline some tentative views on non-standard policies from
macroeconomists. We consider the theoretical case for bolstering the liquid-
ity and capital holdings of financial intermediaries in line w ith the recently
published Basel III recommendations.
6
A new generation of macroeconomic
models suggests that financial fric tions matter substantially in explaining
business cycle fluctuations since they not only amplify the impact of a typical
range of shocks but also can contribute directly to fluctuations. We also
throw light on the implications of relaxing liquidity premia in a variety of
newly developed macroeconomic models. Typically, the size of the central
bank balance sheet has to be expande d considerably in order to offset the
lower bound interest rate constraint. Chapters 5 and 7 from central
5
This leads to the question of whether balance sheet operations and commercial bank
reserve policies are independent of the short-term interest rate or simply complementary
to the zero lower bound constraint.
6
See the pages of the Bank for International Settlements (BIS) at www.bis.org/bcbs/basel3.
htm.
4 Interest Rates, Prices and Liquidity
bank-based economists show t hat the impact of balance sheet policies on
both long-term bond prices and components o f aggregate demand are far
from insignificant, if carried out as part of a credible strategy to combat the
zero bound. Finally, t he UK’s policy of quantitative easing is explained and
some criticism of the current state of models is offered.
Let us start with a development of the criticism of baseline New
Keynesian macroeconomics, that monetary policy with an explicit (or
implicit) inflation target could not adequately capture information from
money, asset prices and the accumulation of debt about medium-term
macroeconomic disequilibria.
2 Directions old and new
The long-run neutrality of money is a central plank of monetary policy
making (Lucas, 1996). Although it is quite a simple matter to find long-run
non-neutralities in many standard New Keynesian models, it is generally
found t hat long-r un non-neutralitie s should not be exploited as there is
no clear enhancement in the welfare of the representative household.
7
Naturally, though, perturbations in the money market will lead to tempo-
rary changes in the market clearing level of (overnight or short-term) policy
rates and, because of various forms of informational uncertainty or indeed
structural rigidity, will lead to temporary deviations in the expected real rate
from its natural level and thus act on aggregate demand. The key question,
however, is the extent to which shocks emanating from the money market
can be stabilised by an interest rate rule, or indeed whether an additional
tool may be required.
8
In a seminal analysis of this question, Poole (1970 ) took a standard IS–
LM framework and analysed the impact on output variance from setting
either interest rates or the money supply in the presence of stochastic
shocks to either or both of spending or money market equations. When
shocks to financial markets dominate relative to shocks in the real part of
the economy, the natural assignment is then broadly to use interest rates
rather than the stock of money as the main policy instrument. But Poole
also showed that, in general, neither instrument would necessarily stabi-
lise the economy better than the other as it depended on the relative
magnitude of shocks in these sectors and the sensitivity of output to
these respective shocks. An often overloo ked implication of his analysis
was that in general, some use of both instruments was likely to stabilise the
output better than one instrument alone, a point to which we shall return,
7
See Khan et al. (2003) on this point.
8
See Chadha et al. (2008) on this point.
New instruments of monetary policy 5
but one that is perhaps echoed by the experience of policy makers world-
wide as they have had to augment interest rate tools with the expansion of
the central bank balance sheet.
The Bank for International Settlements, from a disinterested position –
as it does no t actually have to set monetary policy – regularly expressed
concern about what we might call a ‘worrying triplet’. This triplet com-
prises high internal and external debt levels, high asset prices and rapidly
growing broad money aggregates. White (2006) added to worries about
whether it was sensible to partition monetary and financial issues with a
further concern: the horizon over which policy sought to stabilise was also
part of the problem. ‘Central banks have put too much emphasis on
achieving near term price stability’ (p . 2) at the expense of considering
in detail what the implications may be for longer-run macroeconomic
stability coming from the build-up in domestic and international ‘imbal-
ances’. Of course, central banks have explored the notion of flexible
inflation targeting, whereby financial considerations may operate as an
occasionally binding constraint which would, in principle, extend or
contract the horizon over which inflation would be brought back to target
(see Bean (2003) and Svensson (2009)).
Any direct discussion of a special role for financial intermediation leads
to the reconsideration of the relevance of Bernanke and Blinder’s 1988
model of credit and demand, a version of which we develop in Section 2.1
below. In comparison with the two-asset world of the LM curve where
there is simply a choice between money and bonds, if credit is not a perfect
substitute for bonds then the quantity of loans and the external finance
premium matters. In other words, spending will be affected by interest
rates in the broader credit (or loan) markets and so the allocation of funds
across narrow and broad money by financial institutions will matter for
the level of aggregate demand. In the next sub-section we develop a
version of this model to help us understand QE. This important point
was mostly neglected in the great dynamic stochastic general equilibrium
(DSGE) revolution of monetary policy making that took place over the
subsequent two decades, in which the Modigliani–Miller theorem held
continual sway, as issues of real economy structure and monetary policy
strategy took centre stage, with financial intermediation and monetary
quantities having no special role to play over the short-term policy rate.
From the policy perspective the prosaic answer of the Bundesbank and,
latterly, of the European central bank (ECB) is that money does indeed
matter. And so it is broad money growth that is associated equipropor-
tionally with growth in nominal expenditure and that timely and accurate
analysis of monetary dynamics constitutes (arguably) the most important
part of the central bank’s information set. Indeed, Mervyn King, the
6 Interest Rates, Prices and Liquidity
Governor of the Bank of England, in a paper written while he was Deputy
Governor, argued that money is important because it is an imperfect
substitute for a wide variety of assets and so a change in its quantity will
induce some rebalancing of financial portfolios and therefore will have an
impact on nominal demand, with both direct effects on real assets and
indirect effects, as financial yields will change and so the yields from many
financial assets may enter the broad money demand function (King,
2002). With some prescience he argued that money may matter simply
because it relaxes transaction costs and promotes liquidity, a point taken
up in several chapters in this volume (for example, see Chapter 4).
Using money, or at least central bank liabilities, as an additional instru-
ment of monetary policy fits well with the need to augment interest rate
policy at the zero bound or indeed simply to deal directly with a malfunc-
tioning financial system. Whether the use of central bank liabilities does
indeed offset a shift in the supply curve for money and its counterparts too
far to the left is one issue, but the development of new instruments fits very
well into the game theoretic armoury available to central bankers. This is
because complementary instruments may well augment the signalling
impact of both the current level of interest rates and their expected
path.
9
Note that one popular solution to the problem of controlling a
forward-looking system of rational agents is to make it easier for those
agents to forecast future policy and so condition their plans in line with the
policy maker’s objectives.
10
And so any strategy that is consistent with
signalling a long period of low interest policy rates may help reduce real
rates over a longer horizon and so raise price level expectations.
2.1 A framework for QE
If we leave to one side the signalling effect through a communications
strategy, we can think about the (fiscal and) portfolio channels within the
context of simple equilibria for money and spending equations in the
economy. The discussion of a special role for financial intermediation
leads us to reconsider the relevance of credit in determining demand. In
comparison with the two-asset world of the LM curve where there is
simply a choice between money and bonds, if credit is not a perfect
substitute for bonds then the quantity of loans will matter for the
9
Work by Gürkaynak et al. (2005) suggests that the empirical impact of monetary policy on
asset prices reflects both the level of rates and the likely future path, or stance of policy.
10
See Woodford (2003) on the timeless commitment technology of monetary policy
makers.
New instruments of monetary policy 7
determination of macroeco nomic equilibrium. And so we can consider a
simple model with money, bonds and loans:
L
d
t
¼ y
t
À η
1
ρ
t
À i
t
ðÞ; (1)
where loan demand, L
d
t
, is a function of the interest rate on bonds, i
t
,the
interest rate on loans, ρ
t
, and the level of transactions, y
t
, and η
1
is an
elasticity. The commercial bank balance sheet comprises: reserves, R
t
,
loans, L
s
t
, and bonds, B
t
; as assets, and deposits, D
t
, as liabilities. Without
any loss of generality, le t us assume that reserves equal τD
t
, a fraction, τ,of
deposits, so that the bank balance sheet is as follows:
B
t
þ L
s
t
þ R
t
¼ D
t
(2)
B
t
þ L
s
t
¼ D
t
1 À τðÞ; (3)
and loans supply has the following form:
L
s
t
¼ η
2
ρ
t
À i
t
ðÞþD
t
1 À τðÞ; (4)
which is increasing in the premium of loans over bonds and deposits and
decreasing in reserves. As before η
2
is an elasticity. Solving for clearing in
the loans market:
y
t
À η
1
ρ
t
À i
t
ðÞ¼η
2
ρ
t
À i
t
ðÞþD
t
1 À τðÞ
y
t
¼ η
1
þ η
2
ðÞρ
t
À i
t
ðÞþD
t
1 À τðÞ
(5)
ρ
t
¼
y
t
À D
t
1 À τðÞ
η
1
þ η
2
ðÞ
þ i
t
; (6)
which tells us that the excess of interest rates on loans over bonds increases
in output and reserves and decreases in deposits and the elasticity of loans
demand and supply. Now let us consider the deposit market. Supply is
given as follows:
D
s
t
¼
1
τ
R
t
;
and the demand for deposits is given by:
D
d
t
¼ y
t
À η
3
i
t
; (7)
which clears for:
y
t
¼ η
3
i
t
þ
1
τ
R
t
(8)
8 Interest Rates, Prices and Liquidity
and gives the standard LM curve, but one in which increases in reserves
push out the curve. The spending curve responds to both interest rates on
bonds and to loans:
y
t
¼Àη
4
i
t
þ ρ
t
ðÞ; (9)
which can be rewritten as:
y
t
¼Àη
4
i
t
À η
4
y
t
À D
t
1 À τðÞ
η
1
þ η
2
ðÞ
þ i
t
¼
η
4
η
1
þ η
2
þ η
4
R
t
1
τ
À 1
À 2 η
1
þ η
2
ðÞi
t
(10)
so the spending equation will be negative in bond rates and shifted out by
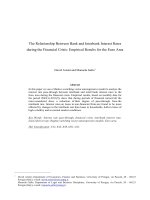
increases in reserves. Following Bernanke and Blinder (1988), we term
this the CC curve. Figure 1.1 shows the impact of a quantitative easing in
this setup. The swap of bonds outstanding for reserves increases reserves
and so pushes out the CC curve and the increase in reserves also acts to
push out the LM curve. Although output will rise, the actual impact on
bond rates will be ambiguous as it will depend on the impact of reserves on
the money supply and the extent to which any easing in the external
finance premium increases aggregate demand. If the former dominates
the latter, interest rates will fall. If, however, spending effects dominate
Bond rate
LM
CC
Output
LM’
CC’
Figure 1.1 QE in a CC/LM framework
New instruments of monetary policy 9
then the latter would dominate. The early empirical results on the announ-
cement effects of QE suggest that there has been more of a downward
interest rate effect. It might very well be therefore that financial market
participants have not transmitted the possible impact on spending down
the asset price channel, but it is still early days and the lagged effects of QE
may imply higher interest rates as the economy is expected to recover.
2.2 There is little new under the sun
The recent focus on quantitative easing has led to comparisons with
events in the past. Initially it was assumed that QE was first used in
Japan in 2001.
11
However, Anderson (2010) has drawn attention to
events in the 1930s when in all but name quantitative easing was used.
12
During 1932, with congressional support, the Fed purchased approximately $1
billion in Treasury securities (half, however, was offset by a decrease in Treasury
bills discounted at the Reserve Banks). At the end of 1932, short-term market rates
hovered at 50 basis points or less. Quantitative easing continued during 1933–36.
In early April 1933, Congress sought to prod the Fed into further action by passing
legislation that (i) permitted the Fed to purchase up to $3 billion in securities
directly from the Treasury (direct purchases were not typically permitted) and, if
the Fed did not, (ii) also authorized President Roosevelt to issue up to $3 billion in
currency. (Anderson, 2010,p.1)
In the post-war period, there was also an attempt to use changes in the
composition of the central bank’s balance sheet in order to tilt the yield
curve. ‘Operation Twist’ was a policy adopted by the Federal Reserve
Board in February 1961. This represented a change in the policy that had
been in place since 1953. The New York Fed, as the operating arm of the
Federal Open Markets Committee (FOMC), was restricted to purchasing
and selling short-term bills as part of its open market operations. The new
policy allowed it to buy also long-term government bonds of up to ten
years’ duration. The intention of this policy was to try to stimulate domes-
tic economic activity and at the same time to help improve the US balance
of payments position which had been in deficit for many years. The hope
was that the reduction in long-term interest rates as a result of the purchase
of bonds would stimulate domestic demand, while higher short-term
interest rates would attract foreign capital. The New York Fed as the
implementer of the policy, was required to buy no more than $500 million
before the next meeting of the FOMC. In total, some $8.8 billion of bonds
and bills over one-year maturity were purchased. This is equivalent, at
11
For a detailed dissection of QE in Japan, see Werner (2002).
12
For a more detailed discussion, see Meltzer (2003).
10 Interest Rates, Prices and Liquidity
today’s prices and proportion of national income, to almost $225 billion –
well short of the $1.7 trillion that was purchased under the QEI policy and
$600 billion under QEII.
13
There was also a short period in UK monetary history, when a policy of
‘overfunding’ was used as a way of doing the inverse of QE and constrain-
ing monetary growth by issuing government bonds in excess of needs to
finance government expenditure and selling them to the non-bank private
sector. Nigel Lawson (1992), then the Chancellor of the Exchequer,
admitted that the use of overf unding was a way of massaging the money
supply to make it look as if monetary policy was tighter than it actually was.
Overfunding averaged £3.4 billion a year over the four years 1981–2to
1984–5. On average M3 grew by nearly 4 per cent a year less than if there
had been no overfunding. By selling more gilts than was necessary to fund
the budget deficit the Bank of England bought Treasury bills or commer-
cial bills from the market. This led to complications in the longer run as
the Bank of England accumulated a vast and growing mountain of bills
which in practice made the day-to-day conduct of monetary policy
increasingly difficult. It slightly tilted the yield curve lowering short-term
interest rates and raising long-term interest rates. The policy was even-
tually abandoned at the end of 1985.
14
2.3 Quantitative easing
QE came into the general lexicon of economics as the zero bound on
policy rates began to bite outside of Japan. Figure 1.2 illustrates the scale
of the recent problem for the UK. Broadly speaking, policy rates lie close
to the rate of growth in nominal gross domestic product, (GDP), as this
comprises real economic growth and inflation, and corresponds to the
rate implied by an active interest rate rule. What we can immediately
observe from the 2008–9 recession is that bank rate just looked too high
against this metric and so another tool seemed to be required. Figure 1.3
reminds us that at the time of writing most major economies were at levels
of policy rates close to those chosen by the Bank of Japan since the
beginning of 2009.
The term quantitative easing was first coined in Japan to describe the
adoption of a ‘novel’ approach to the conduct of monetary policy when
interest rates are close to zero. Following the collapse of asset prices in
December 1989, Japan began to experience deflation by early 1995.
Forecasters and policy makers consistently underestimated the
13
For a critical evaluation of Operation Twist, see Ross (1966).
14
Lawson (1992) describes this result as an ‘own goal’, p. 459.
New instruments of monetary policy 11
seriousness of Japan’s economic problems. After conventional monetary
action proved ineffectual, the Bank of Japan began quantitative easing on
19 March 2001 and continued the policy until 9 March 2006 (see
Figure 1.4).
Under this policy, the Bank shifted its day-to-day operating target
from the overnight, call-money rate to the level of reserves (current
account balance) held by banks at the central bank. Over the five
years the Bank of Japan raised the reserves target nine times by purchas-
ing Japanese government bonds from the banks and ‘printing money’ to
pay for it. The objective was to flood banks with excess reserves in order
to encourage them to l end. At the same time the Bank committed itself
to maintain QE until the core consumer price index (CPI) (excluding
energy and food) either reached zero or rose o n a year-over-year basis for
several months. Fi gure 1.5 shows the path of Japanese CPI inflation over
this period.
Time
92 93 94 95 96 97 98 99 00 01 02 03 04 05 06 07 08 09 10
Per cent
–7.5
–5.0
–2.5
0.0
2.5
5.0
7.5
10.0
12.5
UK policy rate
Nominal GDP growth (YOY)
Figure 1.2 UK policy rate and nominal GDP growth
12 Interest Rates, Prices and Liquidity