house of debt_ how they (and yo - amir sufi
Bạn đang xem bản rút gọn của tài liệu. Xem và tải ngay bản đầy đủ của tài liệu tại đây (1.92 MB, 384 trang )
House of Debt
House of Debt
How They (and You) Caused the Great Recession, and How We Can
Prevent It from Happening Again
Atif Mian and Amir Sufi
The University of Chicago Press
Chicago and London
Atif Mian is professor of economics and public policy at Princeton University.
Amir Sufi is the Chicago Board of Trade Professor of Finance at the University of Chicago Booth School of Business.
The University of Chicago Press, Chicago 60637
The University of Chicago Press, Ltd., London
© 2014 by Atif Mian and Amir Sufi
All rights reserved. Published 2014.
Printed in the United States of America
23 22 21 20 19 18 17 16 15 14 1 2 3 4 5
ISBN-13: 978-0-226-08194-6 (cloth)
ISBN-13: 978-0-226-13864-0 (e-book)
DOI: 10.7208/chicago/9780226138640.001.0001
Library of Congress Cataloging-in-Publication Data
Mian, Atif, 1975– author.
House of debt: how they (and you) caused the Great Recession, and how we can prevent it from happening again / Atif Mian and Amir
Sufi.
pages; cm
Includes bibliographical references and index.
ISBN 978-0-226-08194-6 (cloth: alk. paper) — ISBN 978-0-226-13864-0 (e-book) 1. Financial crises—United States. 2. Consumer
credit—United States. 3. Debtor and creditor—United States. 4. Foreclosure—United States. 5. Financial crises—Prevention. 6.
Foreclosure—United States—Prevention. 7. Global Financial Crisis, 2008–2009. I. Sufi, Amir, author. II. Title.
HB3743.M53 2014
330.973ʹ0931—dc23 2013049671
o This paper meets the requirements of ANSI/NISO Z39.48-1992 (Permanence of Paper).
To our parents, for always being there
To Saima and Ayesha
Contents
1 A Scandal in Bohemia
Part I: Busted
2 Debt and Destruction
3 Cutting Back
4 Levered Losses: The Theory
5 Explaining Unemployment
Part II: Boil and Bubble
6 The Credit Expansion
7 Conduit to Disaster
8 Debt and Bubbles
Part III: Stopping the Cycle
9 Save the Banks, Save the Economy?
10 Forgiveness
11 Monetary and Fiscal Policy
12 Sharing
Acknowledgments
Notes
Index
1: A Scandal in Bohemia
Selling recreational vehicles used to be easy in America. As a button worn by
Winnebago CEO Bob Olson read, “You can’t take sex, booze, or weekends away
from the American people.” But things went horribly wrong in 2008, when sales for
Monaco Coach Corporation, a giant in the RV industry, plummeted by almost 30
percent. This left Monaco management with little choice. Craig Wanichek, their
spokesman, lamented, “We are sad that the economic environment, obviously outside
our control, has forced us to make . . . difficult decisions.”
Monaco was the number-one producer of diesel-powered motor homes. They had a
long history in northern Indiana making vehicles that were sold throughout the United
States. In 2005, the company sold over 15,000 vehicles and employed about 3,000
people in Wakarusa, Nappanee, and Elkhart Counties in Indiana. In July 2008, 1,430
workers at two Indiana plants of Monaco Coach Corporation were let go. Employees
were stunned. Jennifer Eiler, who worked at the plant in Wakarusa County, spoke to a
reporter at a restaurant down the road: “I was very shocked. We thought there could
be another layoff, but we did not expect this.” Karen Hundt, a bartender at a hotel in
Wakarusa, summed up the difficulties faced by laid-off workers: “It’s all these people
have done for years. Who’s going to hire them when they are in their 50s? They are
just in shock. A lot of it hasn’t hit them yet.”
In 2008 this painful episode played out repeatedly throughout northern Indiana. By
the end of the year, the unemployment rate in Elkhart, Indiana, had jumped from 4.9
to 16.2 percent. Almost twenty thousand jobs were lost. And the effects of
unemployment were felt in schools and charities throughout the region. Soup kitchens
in Elkhart saw twice as many people showing up for free meals, and the Salvation
Army saw a jump in demand for food and toys during the Christmas season. About 60
percent of students in the Elkhart public schools system had low-enough family
income to qualify for the free-lunch program.
1
Northern Indiana felt the pain early, but it certainly wasn’t alone. The Great
American Recession swept away 8 million jobs between 2007 and 2009. More than 4
million homes were foreclosed. If it weren’t for the Great Recession, the income of
the United States in 2012 would have been higher by $2 trillion, around $17,000 per
household.
2
The deeper human costs are even more severe. Study after study points to
the significant negative psychological effects of unemployment, including depression
and even suicide. Workers who are laid off during recessions lose on average three
full years of lifetime income potential.
3
Franklin Delano Roosevelt articulated the
devastation quite accurately by calling unemployment “the greatest menace to our
social order.”
4
Just like workers at the Monaco plants in Indiana, innocent bystanders losing their
jobs during recessions often feel shocked, stunned, and confused. And for good
reason. Severe economic contractions are in many ways a mystery. They are almost
never instigated by any obvious destruction of the economy’s capacity to produce. In
the Great Recession, for example, there was no natural disaster or war that destroyed
buildings, machines, or the latest cutting-edge technologies. Workers at Monaco did
not suddenly lose the vast knowledge they had acquired over years of training. The
economy sputtered, spending collapsed, and millions of jobs were lost. The human
costs of severe economic contractions are undoubtedly immense. But there is no
obvious reason why they happen.
Intense pain makes people rush to the doctor for answers. Why am I experiencing
this pain? What can I do to alleviate it? To feel better, we are willing to take medicine
or change our lifestyle. When it comes to economic pain, who do we go to for
answers? How do we get well? Unfortunately, people don’t hold economists in the
same esteem as doctors. Writing in the 1930s during the Great Depression, John
Maynard Keynes criticized his fellow economists for being “unmoved by the lack of
correspondence between the results of their theory and the facts of observation.” And
as a result, the ordinary man has a “growing unwillingness to accord to economists
that measure of respect which he gives to other groups of scientists whose theoretical
results are confirmed with observation when they are applied to the facts.”
5
There has been an explosion in data on economic activity and advancement in the
techniques we can use to evaluate them, which gives us a huge advantage over Keynes
and his contemporaries. Still, our goal in this book is ambitious. We seek to use data
and scientific methods to answer some of the most important questions facing the
modern economy: Why do severe recessions happen? Could we have prevented the
Great Recession and its consequences? How can we prevent such crises? This book
provides answers to these questions based on empirical evidence. Laid-off workers at
Monaco, like millions of other Americans who lost their jobs, deserve an evidence-
based explanation for why the Great Recession occurred, and what we can do to avoid
more of them in the future.
Whodunit?
In “A Scandal in Bohemia,” Sherlock Holmes famously remarks that “it is a capital
mistake to theorize before one has data. Insensibly one begins to twist facts to suit
theories, instead of theories to suit facts.”
6
The mystery of economic disasters presents
a challenge on par with anything the great detective faced. It is easy for economists to
fall prey to theorizing before they have a good understanding of the evidence, but our
approach must resemble Sherlock Holmes’s. Let’s begin by collecting as many facts as
possible.
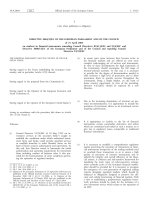
Figure 1.1: U.S. Household Debt-to-Income Ratio
When it comes to the Great Recession, one important fact jumps out: the United
States witnessed a dramatic rise in household debt between 2000 and 2007—the total
amount doubled in these seven years to $14 trillion, and the household debt-to-
income ratio skyrocketed from 1.4 to 2.1. To put this in perspective, figure 1.1 shows
the U.S. household debt-to-income ratio from 1950 to 2010. Debt rose steadily to
2000, then there was a sharp change.
Using a longer historical pattern (based on the household-debt-to-GDP [gross
domestic product] ratio), economist David Beim showed that the increase prior to the
Great Recession is matched by only one other episode in the last century of U.S.
history: the initial years of the Great Depression.
7
From 1920 to 1929, there was an
explosion in both mortgage debt and installment debt for purchasing automobiles and
furniture. The data are less precise, but calculations done in 1930 by the economist
Charles Persons suggest that outstanding mortgages for urban nonfarm properties
tripled from 1920 to 1929.
8
Such a massive increase in mortgage debt even swamps
the housing-boom years of 2000–2007.
The rise in installment financing in the 1920s revolutionized the manner in which
households purchased durable goods, items like washing machines, cars, and
furniture. Martha Olney, a leading expert on the history of consumer credit, explains
that “the 1920s mark the crucial turning point in the history of consumer credit.”
9
For
the first time in U.S. history, merchants selling durable goods began to assume that a
potential buyer walking through their door would use debt to purchase. Society’s
attitudes toward borrowing had changed, and purchasing on credit became more
acceptable.
With this increased willingness to lend to consumers, household spending in the
1920s rose faster than income.
10
Consumer debt as a percentage of household income
more than doubled during the ten years before the Great Depression, and scholars
have documented an “unusually large buildup of household liabilities in 1929.”
11
Persons, writing in 1930, was unambiguous in his conclusions regarding debt in the
1920s: “The past decade has witnessed a great volume of credit inflation. Our period
of prosperity in part was based on nothing more substantial than debt expansion.”
12
And as households loaded up on debt to purchase new products, they saved less.
Olney estimates that the personal savings rate for the United States fell from 7.1
percent between 1898 and 1916 to 4.4 percent from 1922 to 1929.
So one fact we observe is that both the Great Recession and Great Depression were
preceded by a large run-up in household debt. There is another striking commonality:
both started off with a mysteriously large drop in household spending. Workers at
Monaco Coach Corporation understood this well. They were let go in large part
because of the sharp decline in motor-home purchases in 2007 and 2008. The pattern
was widespread. Purchases of durable goods like autos, furniture, and appliances
plummeted early in the Great Recession—before the worst of the financial crisis in
September 2008. Auto sales from January to August 2008 were down almost 10
percent compared to 2007, also before the worst part of the recession or financial
crisis.
The Great Depression also began with a large drop in household spending.
Economic historian Peter Temin holds that “the Depression was severe because the
fall in autonomous spending was large and sustained,” and he remarks further that the
consumption decline in 1930 was “truly autonomous,” or too big to be explained by
falling income and prices. Just as in the Great Recession, the drop in spending that set
off the Great Depression was mysteriously large.
13
The International Evidence
This pattern of large jumps in household debt and drops in spending preceding
economic disasters isn’t unique to the United States. Evidence demonstrates that this
relation is robust internationally. And looking internationally, we notice something
else: the bigger the increase in debt, the harder the fall in spending. A 2010 study of
the Great Recession in the sixteen OECD (Organisation for Economic Co-operation
and Development) countries by Reuven Glick and Kevin Lansing shows that countries
with the largest increase in household debt from 1997 to 2007 were exactly the ones
that suffered the largest decline in household spending from 2008 to 2009.
14
The
authors find a strong correlation between household-debt growth before the downturn
and the decline in consumption during the Great Recession. As they note,
consumption fell most sharply in Ireland and Denmark, two countries that witnessed
enormous increases in household debt in the early 2000s. As striking as the increase in
household debt was in the United States from 2000 to 2007, the increase was even
larger in Ireland, Denmark, Norway, the United Kingdom, Spain, Portugal, and the
Netherlands. And as dramatic as the decline in household spending was in the United
States, it was even larger in five of these six countries (the exception was Portugal).
A study by researchers at the International Monetary Fund (IMF) expands the Glick
and Lansing sample to thirty-six countries, bringing in many eastern European and
Asian countries, and focuses on data through 2010.
15
Their findings confirm that
growth in household debt is one of the best predictors of the decline in household
spending during the recession. The basic argument put forward in these studies is
simple: If you had known how much household debt had increased in a country prior
to the Great Recession, you would have been able to predict exactly which countries
would have the most severe decline in spending during the Great Recession.
But is the relation between household-debt growth and recession severity unique to
the Great Recession? In 1994, long before the Great Recession, Mervyn King, the
recent governor of the Bank of England, gave a presidential address to the European
Economic Association titled “Debt Deflation: Theory and Evidence.” In the very first
line of the abstract, he argued: “In the early 1990s the most severe recessions occurred
in those countries which had experienced the largest increase in private debt
burdens.”
16
In the address, he documented the relation between the growth in
household debt in a given country from 1984 to 1988 and the country’s decline in
economic growth from 1989 to 1992. This was analogous to the analysis that Glick
and Lansing and the IMF researchers gave twenty years later for the Great Recession.
Despite focusing on a completely different recession, King found exactly the same
relation: Countries with the largest increase in household-debt burdens—Sweden and
the United Kingdom, in particular—experienced the largest decline in growth during
the recession.
Another set of economic downturns we can examine are what economists Carmen
Reinhart and Kenneth Rogoff call the “big five” postwar banking crises in the
developed world: Spain in 1977, Norway in 1987, Finland and Sweden in 1991, and
Japan in 1992.
17
These recessions were triggered by asset-price collapses that led to
massive losses in the banking sector, and all were especially deep downturns with
slow recoveries. Reinhart and Rogoff show that all five episodes were preceded by
large run-ups in real-estate prices and large increases in the current-account deficits
(the amount borrowed by the country as a whole from foreigners) of the countries.
But Reinhart and Rogoff don’t emphasize the household-debt patterns that preceded
the banking crises. To shed some light on the household-debt patterns, Moritz
Schularick and Alan Taylor put together an excellent data set that covers all of these
episodes except Finland. In the remaining four, the banking crises emphasized by
Reinhart and Rogoff were all preceded by large run-ups in private-debt burdens. (By
private debt, we mean the debt of households and non-financial firms, instead of the
debt of the government or banks.) These banking crises were in a sense also private-
debt crises—they were all preceded by large run-ups in private debt, just as with the
Great Recession and the Great Depression in the United States. So banking crises and
large run-ups in household debt are closely related—their combination catalyzes
financial crises, and the groundbreaking research of Reinhart and Rogoff
demonstrates that they are associated with the most severe economic downturns.
18
While banking crises may be acute events that capture people’s attention, we must also
recognize the run-ups in household debt that precede them.
Which aspect of a financial crisis is more important in determining the severity of a
recession: the run-up in private-debt burdens or the banking crisis? Research by Oscar
Jorda, Moritz Schularick, and Alan Taylor helps answer this question.
19
They looked
at over two hundred recessions in fourteen advanced countries between 1870 and
2008. They begin by confirming the basic Reinhart and Rogoff pattern: Banking-crisis
recessions are much more severe than normal recessions. But Jorda, Schularick, and
Taylor also find that banking-crisis recessions are preceded by a much larger increase
in private debt than other recessions. In fact, the expansion in debt is five times as
large before a banking-crisis recession. Also, banking-crisis recessions with low levels
of private debt are similar to normal recessions. So, without elevated levels of debt,
banking-crisis recessions are unexceptional. They also demonstrate that normal
recessions with high private debt are more severe than other normal recessions. Even
if there is no banking crisis, elevated levels of private debt make recessions worse.
However, they show that the worst recessions include both high private debt and a
banking crisis.
20
The conclusion drawn by Jorda, Schularick, and Taylor from their
analysis of a huge sample of recessions is direct:
We document, to our knowledge for the first time, that throughout
a century or more of modern economic history in advanced
countries a close relationship has existed between the build-up of
credit during an expansion and the severity of the subsequent
recession. . . . [W]e show that the economic costs of financial
crises can vary considerably depending on the leverage incurred
during the previous expansion phase [our emphasis].
21
Taken together, both the international and U.S. evidence reveals a strong pattern:
Economic disasters are almost always preceded by a large increase in household
debt. In fact, the correlation is so robust that it is as close to an empirical law as it gets
in macroeconomics. Further, large increases in household debt and economic disasters
seem to be linked by collapses in spending.
So an initial look at the evidence suggests a link between household debt, spending,
and severe recessions. But the exact relation between the three is not precisely clear.
This allows for alternative explanations, and many intelligent and respected
economists have looked elsewhere. They argue that household debt is largely a
sideshow—not the main attraction when it comes to explaining severe recessions.
The Alternative Views
Those economists who are suspicious of the importance of household debt usually
have some alternative in mind. Perhaps the most common is the fundamentals view,
according to which severe recessions are caused by some fundamental shock to the
economy: a natural disaster, a political coup, or a change in expectations of growth in
the future.
But most severe recessions we’ve discussed above were not preceded by some
obvious act of nature or political disaster. As a result, the fundamentals view usually
blames a change in expectations of growth, in which the run-up in debt before a
recession merely reflects optimistic expectations that income or productivity will
grow. Perhaps there is some technology that people believe will lead to huge
improvements in well-being. Severe recession results when these high expectations
are not realized. People lose faith that technology will advance or that incomes will
improve, and therefore they spend less. In the fundamentals view, debt still increases
before severe recessions. But the correlation is spurious—it is not indicative of a
causal relation.
A second explanation is the animal spirits view, in which economic fluctuations are
driven by irrational and volatile beliefs. It is similar to the fundamentals view except
that these beliefs are not the result of any rational process. For example, during the
housing boom before the Great Recession, people may have irrationally thought that
house prices would rise forever. Then fickle human nature led to a dramatic revision
of beliefs. People became pessimistic and cut back on spending. House prices
collapsed, and the economy went into a tailspin because of a self-fulfilling prophecy.
People got scared of a downturn, and their fear made the downturn inevitable. Once
again, in this view household debt had little to do with the ensuing downturn. In both
the fundamentals and animal-spirits mind-sets, there is a strong sense of fatalism: a
large drop in economic activity cannot be predicted or avoided. We simply have to
accept them as a natural part of the economic process.
A third hypothesis often put forward is the banking view, which holds that the
central problem with the economy is a severely weakened financial sector that has
stopped the flow of credit. According to this, the run-up in debt is not a problem; the
problem is that we’ve stopped the flow of debt. If we can just get banks to start
lending to households and businesses again, everything will be all right. If we save the
banks, we will save the economy. Everything will go back to normal.
The banking view in particular enjoyed an immense amount of support among
policy makers during the Great Recession. On September 24, 2008, President George
W. Bush expressed his great enthusiasm for it in a hallmark speech outlining his
administration’s response.
22
As he saw it, “Financial assets related to home mortgages
have lost value during the house decline, and the banks holding these assets have
restricted credit. As a result, our entire economy is in danger. . . . So I propose that the
federal government reduce the risk posed by these troubled assets and supply urgently
needed money so banks and other financial institutions can avoid collapse and resume
lending. . . . This rescue effort . . . is aimed at preserving America’s overall economy.”
If we save the banks, he argued, it would help “create jobs” and it “will help our
economy grow.” There’s no such thing as excessive debt—instead, we should
encourage banks to lend even more.
* * *
The only way we can address—and perhaps even prevent—economic catastrophes is
by understanding their causes. During the Great Recession, disagreement on causes
overshadowed the facts that policy makers desperately needed to clean up the mess.
We must distinguish whether there is something more to the link between household
debt and severe recessions or if the alternatives above are true. The best way to test
this is the scientific method: let’s take a close look at the data and see which theory is
valid. That is the purpose of this book.
To pin down exactly how household debt affects the economy, we zero in on the
United States during the Great Recession. We have a major advantage over economists
who lived through prior recessions thanks to the recent explosion in data availability
and computing power. We now have microeconomic data on an abundance of
outcomes, including borrowing, spending, house prices, and defaults. All of these
data are available at the zip-code level for the United States, and some are available
even at the individual level. This allows us to examine who had more debt and who
cut back on spending—and who lost their jobs.
The Big Picture
As it turns out, we think debt is dangerous. If this is correct, and large increases in
household debt really do generate severe recessions, we must fundamentally rethink
the financial system. One of the main purposes of financial markets is to help people
in the economy share risk. The financial system offers many products that reduce risk:
life insurance, a portfolio of stocks, or put options on a major index. Households need
a sense of security that they are protected against unforeseen events.
A financial system that thrives on the massive use of debt by households does
exactly what we don’t want it do—it concentrates risk squarely on the debtor. We
want the financial system to insure us against shocks like a decline in house prices.
But instead, as we will show, it concentrates the losses on home owners. The financial
system actually works against us, not for us. For home owners with a mortgage, for
example, we will demonstrate how home equity is much riskier than the mortgage
held by the bank, something many home owners realize only when house prices
collapse.
But it’s not all bad news. If we are correct that excessive reliance on debt is in fact
our culprit, it is a problem that potentially can be fixed. We don’t need to view severe
recessions and mass unemployment as an inevitable part of the business cycle. We can
determine our own economic fate. We hope that the end result of this book is that it
will provide an intellectual framework, strongly supported by evidence, that can help
us respond to future recessions—and even prevent them. We understand this is an
ambitious goal. But we must pursue it. We strongly believe that recessions are not
inevitable—they are not mysterious acts of nature that we must accept. Instead,
recessions are a product of a financial system that fosters too much household debt.
Economic disasters are man-made, and the right framework can help us understand
how to prevent them.
PART I
Busted
2: Debt and Destruction
All of us face unforeseen threats that can alter our lives: an unexpected illness, a
horrible storm, a fire. We understand we need to be protected against such events, and
we buy insurance to be compensated when these events happen. This is one of the
most common ways we interact with financial markets. It is far better for the financial
system as a whole to bear these risks than any one individual.
One of us (Amir) grew up in Topeka, Kansas, where the threat of tornadoes has
long been hardwired in people’s minds. From an early age, Kansans go through
tornado drills in schools. Kids pour out of classrooms into hallways and are taught to
curl up into a ball next to the wall with their hands covering their heads and necks.
These drills are done at least twice a year; school administrators know they must be
prepared for a tornado striking out of the blue. Similarly, home owners in Kansas
prepare for tornadoes by making sure their insurance policy will pay them if, God
forbid, their home is destroyed in a tornado. Money can’t make up for the loss of
one’s home, but it ensures that a family can begin rebuilding their lives during such a
desperate time. Insurance protects people—this is one of the primary roles of the
financial system.
A collapse in house prices, while presumably not dangerous in terms of injury or
death, presents another serious unforeseen risk to home owners. For many
Americans, home equity is their only source of wealth. They may be counting on it to
retire or to help pay for a child’s college education. A dramatic decline in house prices
is just as unexpected as a tornado barreling down on a small town in Kansas. But
when it comes to the risk associated with house prices, the financial system’s reliance
on mortgage debt does the exact opposite of insurance: it concentrates the risk on the
home owner. While insurance protects the home owner, debt puts the home owner at
risk. Here’s how.
The Harshness of Debt
Debt plays such a common role in the economy that we often forget how harsh it is.
The fundamental feature of debt is that the borrower must bear the first losses
associated with a decline in asset prices. For example, if a home owner buys a home
worth $100,000 using an $80,000 mortgage, then the home owner’s equity in the home
is $20,000. If house prices drop 20 percent, the home owner loses $20,000—their full
investment—while the mortgage lender escapes unscathed. If the home owner sells
the home for the new price of $80,000, they must use the full proceeds to pay off the
mortgage. They walk away with nothing. In the jargon of finance, the mortgage lender
has the senior claim on the home and is therefore protected if house prices decline.
The home owner has the junior claim and experiences huge losses if house prices
decline.
But we shouldn’t think of the mortgage lender in this example as an independent
entity. The mortgage lender uses money from savers in the economy. Savers give
money to the bank either as deposits, debt, or equity, and are therefore the ultimate
owners of the mortgage bank. When we say that the mortgage lender has the senior
claim on the home, what we really mean is that savers in the economy have the senior
claim on the home. Savers, who have high net worth, are protected against house-
price declines much more than borrowers.
Now let’s take a step back and consider the entire economy of borrowers and
savers. When house prices in the aggregate collapse by 20 percent, the losses are
concentrated on the borrowers in the economy. Given that borrowers already had low
net worth before the crash (which is why they needed to borrow), the concentration
of losses on them devastates their financial condition. They already had very little net
worth—now they have even less. In contrast, the savers, who typically have a lot of
financial assets and little mortgage debt, experience a much less severe decline in their
net worth when house prices fall. This is because they ultimately own—through their
deposits, bonds, and equity holdings—the senior claims on houses in the economy.
House prices may fall so far that even the senior claims take losses, but they are much
less severe than the devastation wrought on the borrowers.
Hence, the concentration of losses on debtors is inextricably linked to wealth
inequality. When house prices collapse in an economy with high debt levels, the
collapse amplifies wealth inequality because low net-worth households bear the lion’s
share of the losses. While savers are also negatively impacted, their relative position
actually improves. In the example above, before the crash savers owned 80 percent of
the home whereas the home owner owned 20 percent. After the crash, the home
owner is completely wiped out, and savers own 100 percent of the home.
Debt and Wealth Inequality in the Great Recession
During the Great Recession, house prices fell $5.5 trillion—this was enormous,
especially considering the annual economic output of the U.S. economy is roughly $14
trillion. Given such a massive hit, the net worth of home owners obviously suffered.
But what was the distribution of those losses: how worse off were borrowers,
actually?
Let’s start with an examination of the net-worth distribution in the United States in
2007.
1
A household’s net worth is composed of two main types of assets: financial
assets and housing assets. Financial assets include stocks, bonds, checking and
savings deposits, and other business interests a household owns. Net worth is defined
to be financial assets plus housing assets, minus any debt. Mortgages and home-equity
debt are by far the most important components of household debt, making up 80
percent of all household debt as of 2006.
In 2007 there were dramatic differences across U.S. households in both the
composition of net worth and leverage (amount of debt). Home owners in the bottom
20 percent of the net-worth distribution—the poorest home owners—were highly
levered. Their leverage ratio, or, the ratio of total debt to total assets, was near 80
percent (as in the example above with a house worth $100,000). Moreover, the
poorest home owners relied almost exclusively on home equity in their net worth.
About $4 out of every $5 of net worth was in home equity, so poor home owners had
almost no financial assets going into the recession. They had only home equity, and it
was highly levered.
The rich were different in two important ways. First, they had a lot less debt coming
into the recession. The richest 20 percent of home owners had a leverage ratio of only
7 percent, compared to the 80 percent leverage ratio of the poorest home owners.
Second, their net worth was overwhelmingly concentrated in non-housing assets.
While the poor had $4 of home equity for every $1 of other assets, the rich were
exactly the opposite, with $1 of home equity for every $4 of other assets, like money-
market funds, stocks, and bonds. Figure 2.1 shows these facts graphically. It splits
home owners in the United States in 2007 into five quintiles based on net worth, with
the poorest households on the left side of the graph and the richest on the right. The
figure illustrates the fraction of total assets each of the five quintiles had in debt, home
equity, and financial wealth. As we move to the right of the graph, we can see how
leverage declines and financial wealth increases.
This isn’t surprising. A poor man’s debt is a rich man’s asset. Since it is ultimately
the rich who are lending to the poor through the financial system, as we move from
poor home owners to rich home owners, debt declines and financial assets rise. As we
mentioned above, the use of debt and wealth inequality are closely linked. There is
nothing sinister about the rich financing the poor. But it is crucial to remember that
this lending takes the form of debt financing. When the rich own the stocks and
bonds of a bank, they in turn own the mortgages the bank has made, and interest
payments from home owners flow through the financial system to the rich.
Figure 2.1: Leverage Ratio for Home Owners, 2007, by Net Worth Quintile
Figure 2.1 summarizes key facts that are important to keep in mind as we enter the
discussion of the recession. The poorest home owners were the most levered and the
most exposed to the risks of the housing sector, and they owned almost no financial
assets. The combination of high leverage, high exposure to housing, and little
financial wealth would prove disastrous for the households who were the weakest.
How the Poor Got Poorer
From 2006 to 2009, house prices for the nation as a whole fell 30 percent. And they
stayed low, only barely recovering toward the end of 2012. The S&P 500, a measure
of stock prices, fell dramatically during 2008 and early 2009, but rebounded strongly
afterward. Bond prices, as measured by the Vanguard Total Bond Market Index,
experienced a strong rally throughout the recession as market interest rates plummeted
—from 2007 to 2012, bond prices rose by more than 30 percent. Any household that
held bonds coming into the Great Recession had a fantastic hedge against the
economic collapse. But, as we have shown above, only the richest households in the
economy owned bonds.
The collapse in house prices hit low net-worth households the hardest because their
wealth was tied exclusively to home equity. But this tells only part of the story. The
fact that low net-worth households had very high debt burdens amplified the
destruction of their net worth. This amplification is the leverage multiplier. The
leverage multiplier describes mathematically how a decline in house prices leads to a
larger decline in net worth for a household with leverage.
To see it at work, let’s return to the example we’ve been using, where a home
owner has 20 percent equity in a home worth $100,000, and therefore a loan-to-value
ratio of 80 percent (and therefore an $80,000 mortgage). If house prices fall 20
percent, what is the percent decline in the home owner’s equity in the home? Here’s a
hint: it’s much larger than 20 percent! The home owner had $20,000 in equity before
the drop in house prices. When the prices drop, the house is only worth $80,000. But
the mortgage is still $80,000, which means that the home owner’s equity has been
completely wiped out—a 100 percent decline. In this example, the leverage multiplier
was 5. A 20 percent decline in house prices led to a decline in the home owner’s
equity of 100 percent, five times larger.
2
From 2006 to 2009, house prices across the country fell by 30 percent. But since
poor home owners were levered, their net worth fell by much more. In fact, because
low net-worth home owners had a leverage ratio of 80 percent, a 30 percent decline in
house prices completely wiped out their entire net worth. This is a fact often
overlooked: when we say house prices fell by 30 percent, the decline in net worth for
indebted home owners was much larger because of the leverage multiplier.
Taken together, these facts tell us exactly which home owners were hit hardest by
the Great Recession. Poor home owners had almost no financial assets; their wealth
consisted almost entirely of home equity. Further, their home equity was the junior
claim. So the decline in house prices was multiplied by a significant leverage
multiplier. While financial assets recovered, poor households saw nothing from these
gains.
Figure 2.2 puts these facts together and shows one of the most important patterns of
the Great Recession. It illustrates the evolution of household net worth for the bottom
quintile, the middle quintile, and the highest quintile of the home-owner wealth
distribution. The net worth of poor home owners was absolutely hammered during
the Great Recession. From 2007 to 2010, their net worth collapsed from $30,000 to
almost zero. This is the leverage multiplier at work. The decline in net worth during
the Great Recession completely erased all the gains from 1992 to 2007. This is exactly
what we would predict given the reliance on home equity and their large amount of
debt. The average net worth of rich home owners declined from $3.2 million to $2.9
million. While the dollar amount of losses was considerable, the percentage decline
was negligible—they were hardly touched. The decline wasn’t even large enough to
offset any of the gains from 1992 to 2004. The rich made out well because they held
financial assets that performed much better during the recession than housing. And
many of the financial assets were senior claims on houses.
High debt in combination with the dramatic decline in house prices increased the
already large gap between the rich and poor in the United States. Yes, the poor were
poor to begin with, but they lost everything because debt concentrated overall house-
price declines directly on their net worth. This is a fundamental feature of debt: it
imposes enormous losses on exactly the households that have the least. Those with the
most are left in a much better relative position because of their senior claim on the
assets in the economy. Inequality was already severe in the United States before the
recession. In 2007 the top 10 percent of the net-worth distribution had 71 percent of
the wealth in the economy. This was up from 66 percent in 1992. In 2010 the share of
the top 10 percent jumped to 74 percent, which is consistent with the patterns shown
above. The rich stayed rich while the poor got poorer.
Figure 2.2: Home-Owner Net Worth, Poorest, Median, and Richest Quintiles
Many have discussed trends in income and wealth inequality, but they usually
overlook the role of debt. A financial system that relies excessively on debt amplifies
wealth inequality. While there is much to learn about the causes of inequality by
looking into the role of debt, our focus is on how the uneven distribution of losses
affects the entire economy.
The Geography of Net-Worth Destruction
The crash in house prices during the Great Recession had a strong geographic
component, and our research relies on this.
3
The counties with the sharpest drops in
net worth were located in California and Florida. Other pockets of the country also
had very large drops, including counties in Colorado, Maryland, and Minnesota.
Counties in the middle of the country, such as those in Kansas, Oklahoma, and Texas,
largely escaped the housing collapse.
In some areas of the country, the decline in housing net worth was stunning. In
four counties in the Central Valley of northern California—Merced, San Joaquin,
Solano, and Stanislaus—the fall in house prices led to a 50 percent drop in net worth.
And all four counties were already below the median net worth in the United States in
2006. Prince Georges County, Maryland, just north of Washington, D.C., saw a 40
percent decline in net worth, and it was also well below the national median.
In 2000 the median household in Merced County, about 130 miles southeast of San
Francisco, had an income of $35,000, which made it relatively poor compared to other
areas of California. From 2002 to 2006, fueled by lending to households with low
credit scores, house prices in the county rose by 60 percent. Home owners responded
by borrowing aggressively, and household debt increased by 80 percent. When the
housing market turned sour, the consequences were disastrous. Merced County saw a
decline in home equity of 50 percent from 2006 to 2009.
For many households during the Great Recession, the value of their homes dropped
below the amount still owed on the mortgage. Home owners then became
“underwater” or “upside-down” on their mortgage and actually had negative equity in
their home. If they chose to sell, they had to pay the difference between the mortgage
and the sale price to the bank. Faced with this dire circumstance, home owners could
either stay in their homes and owe the bank more than their homes were worth, or
walk away and let the bank foreclose.
Many chose to stay. In 2011, 11 million properties—23 percent of all properties
with a mortgage—had negative equity.
4
Even though we know these numbers well,
we are still shocked as we write them. They are truly stunning and worth repeating:
home owners in 1 out of every 4 residential properties with a mortgage in the United
States were underwater. In the Central Valley counties mentioned above, there were
four zip codes with more than 70 percent of home owners underwater. For Merced
County, the number was 60 percent. Many other home owners walked away, allowing
the bank to foreclose. Walking away, of course, was not costless. Failing to pay a
mortgage payment shattered one’s credit score. Further, foreclosures led to a vicious
cycle that further destroyed household net worth.
Foreclosures and Fire Sales
The negative effects of debt during the Great Recession extended far beyond the
indebted. When house prices collapsed, problems related to excessive leverage
infected the entire economy. The spillover effects included higher unemployment and
a failing construction sector. But the most direct consequence was the startling rise in
foreclosures. Economists have long appreciated that debt affects everyone when asset
prices collapse. A fire sale of assets at steeply discounted prices is the most common