how to create the app analytics reports you need
Bạn đang xem bản rút gọn của tài liệu. Xem và tải ngay bản đầy đủ của tài liệu tại đây (2.3 MB, 35 trang )
Workbook
HOW TO CREATE THE
APP ANALYTICS REPORTS
YOU NEED
Introduction
ABOUT THIS WORKBOOK
Section 1
ALIGN YOUR BUSINESS GOALS & ANALYTICS
Section 2
WHERE YOUR USERS ARE COMING FROM:
Attribution
Section 3
HOW ENGAGED YOUR USERS ARE:
Sessions & Cohorts
Section 4
WHAT ACTIONS YOUR USERS ARE TAKING
IN-APP: Events
Section 5
WHO YOUR USERS ARE: Audience Segments
Section 6
WHERE YOUR USERS ARE CONVERTING
(OR DROPPING OUT): Funnels
USING AN ANALYTICS PLATFORM FOR
FURTHER INSIGHTS
CHOOSING AN ANALYTICS TOOL
03
06
09
13
17
21
25
28
32
03
–
INTRODUCTION
As an app owner, you know that launching your
app is only one step on the way to creating
a successful mobile experience. Whether you’re
just entering the space, analytics are the key
to discovering what works in your app (and to
doing more of it).
But analytics alone won’t provide valuable
insights if not evaluated through your brand’s
behind creating one are independent to you.
Your app analytics should be structured based
tailored, actionable insights.
We’re tasking you with quite the undertaking
– organizing and optimizing your metrics might
seem overwhelming, but with the right tools,
you’ll be able to easily (and effectively)
determine what you want to know, what your
app is telling you and how to achieve the
right results.
UNDERSTANDING THE TERMINOLOGY
Reading your analytics is like reading a book; you need to know
the vocabulary. Every app analytics platform is different, but
there is a standard set of terminology, which is used throughout
this workbook:
· Attribution: The organic and paid channels for acquiring
app users
· Sessions: The time from when a user starts using an app
until they close or background it
Continued
04
–
INTRODUCTION
Introduction
ABOUT THIS WORKBOOK
In this workbook, you will gain the fundamentals necessary to
create analytics reports that will help your app succeed. By iden-
tifying and quantifying your measurement goals, including the key
elements of your analytics, you will be able to read your data ac-
curately with an eye to the results that mean most for your brand.
This will enable you to make the right UI/UX changes, update your
user acquisition campaigns and run smarter marketing.
We’ve provided lists, tables, and questionnaires to give you the
tools to structure your analytics and gar-
ner the most accurate insights possible.
Each section includes:
· An interactive table to track your plan-
ning and data
· Sample insights you can achieve with each
analytics report
· Additional resources on how to utilize
your data
05
–
INTRODUCTION
· Segments: A group of users who did or did not do certain events,
or pair of events in sequence
· Cohorts:
time frame: day, week, or month; a measurement of retention
· Events: Actions that are completed by the user while interacting
· Event attributes: Key or value pairs that are contextual to the
· Funnels: A series of events that leads to a user converting
· LTV: The lifetime value of a user and the primary measure of ROI
Notes:
Type your notes here
06
–
SECTION #1
Apps are still a relatively new phenomenon.
Their value lies in what they provide the
user, and how that value is different from or
better than any other app. Identifying this
will help you become a viable competitive
threat. In creating your UI, content, offers
and other app elements, you did so with a set
of goals in mind. Revisit these goals and use
them again to guide your way.
What is the primary purpose of your
application? Why did you create the app in
the first place?
How it helps:
Section 1
ALIGN YOUR BUSINESS GOALS
AND ANALYTICS
Type your answer here
07
–
SECTION 1
How does your app fit within the
company vision?
What is your unique value proposition?
How it helps:
How it helps:-
Type your answer here
Type your answer here
08
–
SECTION 1
Where is your target audience?
How it helps:
-
How it helps:-
Who is your target audience?
Type your answer here
Type your answer here
09
–
SECTION #2
Here’s where all app marketers start: how do I effectively acquire
users? The answer is most likely a strategic combination of organic
and paid promotion, including App Store optimization (ASO), to drive
a diverse initial audience and figure out what works best.
Your organic promotion might include social media campaigns, an
app-specific website, ASO, email campaigns, press mentions, and oth-
er channels. Remember: 63% of downloads come from general browsing
in the App Store, so organic optimization is crucial. Essentially,
you need to make your app findable and shareable.
Every app is going to have organic acquisi-
tion, but not all have paid acquisition. This
is an opportunity to expose your app to a
much larger audience and set yourself apart
from the crowd. Ads and other forms of paid
acquisition also allow you to better target
your app to your ideal audience based on
what websites they’re visiting, what publi-
cations they’re reading, what forums they’re
visiting, and more.
STEP 1: Set your Budget
User acquisition costs are on the rise, but that doesn’t mean you
have to spend a fortune to be successful. Most marketers stop at
measuring the cost after downloads: essentially, cost per user.
While this is a crucial metric in evaluating campaigns, it is by no
means a stopping point. In truly measuring, validating and evolving
your acquisition budget, you have to look at the lifetime value
Continued
Section 2
WHERE YOUR USERS ARE COMING FROM:
Attribution
10
–
SECTION 2
STEP 2: Identify your Ad Partners
Choosing an ad partner is another project unto itself, but there
are well-known players in the space you can use, including Facebook,
Millennial Media, Greystripe, Impact Radius, Fiksu, and others.
Identify the pros and cons of each, and align them with your budget
to put together a plan. Over time, as you track the results of your
acquisition campaigns, it will become clear which channels work best
for you, and those to invest more in.
(LTV) of each acquired customer to derive the total revenue you’ve
earned after cost of acquisition. Using conversions, sessions per
user, LTV per user, and other monetization metrics, you can discover
the root ROI of each acquisition channel.
STEP 3: Track Initial Attribution Metrics
Knowing which ad networks, publishers and content are worth invest-
ing further in depends on tracking the results of each campaign
you run. Assign your campaign budget, and measure the number of
new users from each one, including the initial measure of ROI: cost
per user.
Cost/
User
Budget #/New
Users
Ad Network Publisher Campaign
Millennial Media
Weather Channel
April Sale
$3,000
1,275
$2.35
11
–
SECTION 2
These metrics will give you a strong sense of which campaigns are
working best to encourage downloads and bring in new users within
your budget.
ADVANCED
STEP 4: Track ROI and Value Long-Term
To accurately gauge success, you will need to go beyond these
initial attribution metrics and track sessions per user, transac-
tions per user, and, most importantly, user LTV. For these long-term
revenue metrics, you’ll need an analytics platform that automati-
cally tracks and updates over time. This gives you the ability to
track a host of ROI-based metrics without any manual work, with each
traced back to an attribution campaign, all dynamically updated.
Notes:
12
–
SECTION 2
Sample insights you can gain from tracking
acquisition channels
· Users acquired through Fiksu spend more on in-app
purchases, but have a lower LTV than users acquired
through Facebook
· Spring campaigns perform better than Summer campaigns
on Pandora
· Your ideal cost per user is under $3.00
5 Ways to Improve your App
Acquisition Strategy
App Users Acquired Through Facebook Perform
as Well as Organic Users
Major Enhancements to User Acquisition
Tracking at Localytics
ADDITIONAL RESOURCES
Type your answer here
13
–
SECTION #3
Downloads are just the first step: after
you’ve acquired users, you want to be able to
track how often those users come back, and
their value to you beyond just the app in-
stall. Repeat app opens show that your users
are engaged with your app, at least to the
point that they want to come back and give it
another try. And metrics like session length
and interval signal how long and how often
(respe c tively) users a re usi ng your a p p.
Session length is a measurement of time spent in the app during one
session.
Session interval is the time between the user’s first session and
his or her next one, showing the frequency with which your users
open the app.
Measure the actuals against your desired session length and in-
terval, so that you know with accuracy how long users typically do
spend in your app vs. how long you want them to have the app open.
Then, track growth over time to see how engaged your users are per
session, how that fluctuates, and how it changes when you launch a
major update or a marketing campaign.
Continued
Section 3
HOW ENGAGED YOUR USERS ARE:
Sessions and Cohorts
14
–
SECTION 3
STEP 2: Choose your Most Important Dimensions
While your #1 measure is going to be looking at how frequently
users return to your app by tracking sessions and engagement,
additional insights can be gleaned within that. Data splits are
some of the important attributes of your returning users, and
by choosing the right ones, you can pinpoint additional recurring
trends within sessions. Using this scale, prioritize your splits
by importance to choose which ones cast the most crucial lense
on your session data.
Continued
Growth
(%)
Avg. Session
Interval
Time Period
New vs. Returning
1
1
1
1
2
2
2
2
3
3
3
3
4
4
4
4
5
5
5
5
Location
Language
Device
Avg. Session
Length
Growth
(%)
June 10, 2014 - July 10,
2014
15 sec.
-0.5%
7 days
1.3%
15
–
SECTION 3
ADVANCED
STEP 3: Automatically Track Cohorts
Once you’ve begun tracking sessions, you’ll want to move on to
tracking more intricate retention metrics. For example, event-based
cohort retention, which enables you to measure retention based on
engagement with a particular event. This pairs retention data with
in-app actions, giving you a detailed look at exactly how power
users are interacting with your app.
Generally, you can use cohorts to track the percentage of users who
return X number of days later after their first app open. These
analytics are more advanced, and require the use of an analytics
platform that automatically and dynamically collects and parses this
information.
Continued
App Version
Carrier
1
1
1
1
1
1
1
1
1
2
2
2
2
2
2
2
2
2
3
3
3
3
3
3
3
3
3
4
4
4
4
4
4
4
4
4
5
5
5
5
5
5
5
5
5
Browser
OS Version
Marketing Campaign
SDK Version
Marketing Source
Jailbroken
Marketing Medium
16
ADDITIONAL RESOURCES
Sample insights you can gain from tracking sessions
and retention
· iOS users spend more time per session in the app, but
Android users return more regularly
· Your average session length is under 20 seconds in the US
·
June 17, 2014 returned after one day
Sessions vs. Pageviews: Which Metric Should
You Measure?
Session Lengths As A Measure of
App Engagement
Feature Spotlight: Localytics Event-Based
Cohort Retention
–
SECTION 3
17
–
SECTION #4
Events, or actions taken, can be screens viewed, push or in-app
messages opened, articles shared, items added to cart, subscriptions
confirmed, purchases completed, or a number of other key conversion
events as identified by you. Knowing which events your users are
acting on signal which features are most valuable in your app,
which aren’t getting enough attention, and shed light on how users
are using your app (potentially, in ways you hadn’t anticipated).
Defining your events is key to creating fun-
nels for encouraging users down conversion
paths within your app. Essentially, knowing
what events you want users to complete most,
and what events work together to create a
funnel, allow you to put additional value
on how users interact with your app, and
in many cases, monetize those interactions
(more on funnels in Section #6).
STEP 1: Identify the Most Important Actions you Want
your App Users to Take
Think back to Section #1 and the goal of the app: in order to
achieve this, what are the things your users must do in-app?
What are the features you want them to interact with most? Use
those questions to discover crucial app actions, major updates
or a marketing campaign.
Continued
Section 4
WHAT ACTIONS YOUR USERS ARE
TAKING IN-APP: Events
18
–
SECTION 4
Continued
Type your answer here
Type your answer here
Type your answer here
Type your answer here
19
–
SECTION 4
Note that there can be more than one event type that tracks to
your important actions, and there can also be multiple attributes
for each event. As a reminder, attributes are key/value pairs that
are contextual to the specific event being tagged. For example, a
“Product View” event may have attributes tracking the product cate-
gory, whether it was shared, how long the user spent viewing it, and
anything else that may be helpful in understanding user behavior.
Here’s a good rule of thumb: If it is a user action or verb then
it is probably an event. If it is a descriptor of an action or
adjective, then it is likely an attribute.
Important Action Event Type/
Name
Attributes
Continued
Type your answer here
Share articles and interact with the brand on
social media more frequently
Social action
- Platform (Twitter,
Facebook)
- Content (Article Name)
- Action (share, Like, follow)
20
Sample insights you can gain from tagging events
· That today’s front page article is getting a lot of views,
but fewer Facebook shares than you anticipated
· How many users purchased your Deal of the Day item
· That male users from Boston opened your Red Sox score push
message more than they did your Celtics one
The Beginner’s Guide to App Analytics
How to Tag Mobile Apps With Events &
Attributes – Whiteboard Wednesday
Feature Spotlight: Localytics Event-Based
Cohort Retention
ADDITIONAL RESOURCES
–
SECTION 4
Important Action Event Type/
Name
Attributes
21
–
SECTION #4
No two app users are the same, which is why it’s considered a
mobile sin to send push and in-app messages to your entire audi-
ence. What you can and should do is segment your users based on
similar behaviors and attributes to define audience subsets. Your
segments get to the heart of your analytics by tying users and
usage behavior together, allowing you to draw smarter conclusions
about what your app users are looking for and run targeted,
analytics-driven marketing.
Segments are created using a time period and
at least one completed event, such as shared
an article, subscribed to a newsletter, com-
pleted an in-app purchase, etc (as defined
in the previous section). You can then add a
second event to see who continued on to com-
plete another action. Similarly, you can also
highlight users who completed one event but
didn’t complete another.
Continued
Section 5
WHO YOUR USERS ARE:
Audience Segments
Custom
Dimension
2nd Event
(Optional)
Segment
Name
Time Period 1st Event
Purchasers
1/13/2014-7/1/2014
Product Viewed
Checkout
Gender: Female
22
–
SECTION 5
Custom
Dimension
2nd Event
(Optional)
Segment
Name
Time Period 1st Event
STEP 2: Choose your Custom Dimensions
Once you have an event and time frame chosen, your segments can
be made richer by the use of custom dimensions that speak to user
attributes and behaviors more specifically. Your custom dimensions
will be different depending on which segment you’re looking at –
in one case, you might want to differentiate male and female trial
subscribers, in another, you might want to see one-time buyers
located in London.
Subscription Status
Demographics
Purchasing History
Brick-and-Mortar
Degree of Usage
Multi-App Usage
Ad Clickers
Continued
Age, Gender, Location
Free, trial and premium subscribers
Users who never buy, bought once, bought 2-10 times
Users who used your app in one of your locations
Users who have one or multiple of your available apps
Light, moderate and heavy users
Users who clicked in-app ads vs. users who never click
23
–
SECTION 5
Your custom dimensions don’t have to fit strictly into these groups.
Instead, use your events to help inform valuable dimensions: of a
particular event, what additional information do you want to know
about the users who completed it?
BONUS STEP
Run Segment-Based Messaging Campaigns
Personalization is the next big thing in marketing – with mobile,
it’s no different. The benefit that apps offer, however, is the
ability to personalize app notifications based on segments, without
the need to collect additional (and in some cases, highly personal)
user information.
You can run smarter push and in-app messaging campaigns based on
your user segments, highlighting offers and content highly relevant
to each segment and boosting conversions. For example, you can send
a discount code push notification to users who have left an item in
their cart and didn’t complete the checkout process.
For more on app marketing, try this free guide: A Beginner’s Guide
to App Marketing.
Sample insights you can gain from creating segments
· Female users from EMEA buy more
· Free trial users acquired in the last six months click ads
more frequently than paid users
· 60% of second-screeners start the subscription process but
then never complete it
24
–
SECTION 5
App User Segmentation – Four User
Segment Examples
Exploring Custom Dimensions & Segments
6 Steps to Segmenting Your Evangelists
and Detractors With In-App Messaging
ADDITIONAL RESOURCES
Notes:
Type your answer here
25
–
SECTION #4
The events you’ve defined within your app are what make up both
your organic and marketing app funnels. You will use these funnels
to determine how users are or aren’t converting within your app.
Organically, this could be a user who opens
your app, reads, and shares an article with-
out any prompting. Your funnels can also
align to in-app and push messaging marketing.
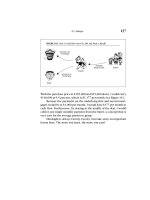
For example, you can see how targeted cam-
paigns converted, such as analyzing how users
who received a push message for a special
sale completed an in-app purchase.
Essentially, funnels represent a set of con-
version steps (or a series of events) a user can take in your app.
Ultimately, your funnel should lead to one primary conversion goal,
such as user completed an in-app purchase.
Section 6
WHERE YOUR USERS ARE CONVERTING
(OR DROPPING OUT): Funnels
Funnels can be created whenever: in advance of a marketing cam-
paign, or retroactively to track previously undiscovered activity
patterns. The more detailed events in your funnel, the more granu-
lar the insights and clearer the drop-offs. Certain key conversion
goals should be tracked with many events in one funnel - however,
sometimes funnels are shorter, and made up of only a couple of
events.
Tip: Use the “important goals” and events you defined in Section 4
to choose the conversion steps you want to track in your funnels.
Continued