design and realization of saw pressure sensor using aluminum nitrid
Bạn đang xem bản rút gọn của tài liệu. Xem và tải ngay bản đầy đủ của tài liệu tại đây (5.33 MB, 186 trang )
UNIVERSITE JOSEPH FOURIER- GRENOBLE I
SCIENCES.TECHNOLOGIE.SANTE
N° attribué par la bibliothèque
|__|__|__|__|__|__|__|__|__|__|
T H E S E
pour obtenir le grade de
DOCTEUR DE L’UNIVERSITE JOSEPH FOURIER
Spécialité :
Radio-Fréquence
préparée au laboratoire CEA/LETI-Minatec - IMEP-LAHC
dans le cadre de l’Ecole Doctorale
"Electronique, Electrotechnique, Automatique, Télécommunication, Signal"
présentée et soutenue publiquement
par
Trang HOANG
Le 19/01/2009
TITRE
Design and realization of SAW pressure sensor using Aluminum
Nitride
DIRECTEUR DE THESE
Philippe BENECH
JURY
M.Daniel Barbier Président
Mme. Hélène Tap-Beteille Rapporteur
M. Gilles Despaux Rapporteur
M.Patrice Rey Examinateur
M.Philippe Robert Examinateur
M.Philippe Benech Directeur de thèseAbstract
Résumé
L'objectif de cette thèse est la conception d'un capteur de pression à ondes de surface utilisant le nitrure
d'aluminium (AlN). Les études théoriques, la réalisation et la caractérisation du capteur de pression sur
différentes structures à ondes de surface sont présentées.
La modélisation du capteur est effectuée en utilisant un circuit équivalent basé sur le modèle de Mason
et la méthode des modes couplés. Les paramètres des ondes de surfaces sont obtenus par calcul et analysés pour
différentes structures telles que AlN/SiO2/Si, AlN/Si et AlN/Mo/Si. A partir de ces analyses, nous avons montré
que la vitesse des ondes ainsi que le facteur de couplage peuvent dépendre du milieu de propagation. Pour
chaque type de structure utilisant l'AlN, nous déterminons la plage d'épaisseur de la couche d'AlN pour laquelle
la vitesse des ondes et le facteur de couplage présentent une faible dépendance au regard de l'épaisseur d'AlN.
Les dispositifs à ondes de surface doivent être conçus, en particulier pour le choix des épaisseurs de différentes
couches, en tenant compte de la précision du procédé de fabrication, afin de réduire les dispersions de
caractéristiques des capteurs. En outre, nous avons analysé le comportement mécanique de la membrane en
présence d'une pression et nous en avons déduit la sensibilité du capteur. Les effets des variations de température
sur une structure à ondes de surface (SAW) sont étudiés. Pour des applications dans le domaine de la mesure de
pressions, nous proposons une méthode de réduction des effets des variations de température.
Pour le précédé de fabrication, nous proposons d'utiliser le micro-usinage de surface. Ce type de
procédé de fabrication permet d'obtenir exactement les dimensions des membranes utilisées dans les capteurs de
pression et il permet aussi de réaliser tout type de géométrie grâce au procédé d'arrêt de gravure du silicium. Les
films de nitrure d'aluminium sont caractérisés au cours de la fabrication. Nous avons trouvé que pour améliorer
le comportement piézoélectrique de l'AlN, trois voies sont possibles : utiliser une couche de molybdène sous
l'AlN, réduire la rugosité de la couche se trouvant sous l'AlN jusqu'à 0,2 nm et augmenter l'épaisseur de l'AlN.
Les pertes acoustiques de propagation, le facteur de couplage, l'effet d'une couche de Mo et l'effet du
film mince de polyimide sur la fréquence centrale sont analysés expérimentalement. En conclusion, la sensibilité
de pression mesurée de notre dispositif est présentée. Ce dernier résultat est très prometteur.
Mots clés : ondes acoustique de surface, Nitrure d'Aluminium (AlN), micro-usinage de surface, capteur de
pression
Abstract
The goal of this thesis is the design of a surface acoustic wave (SAW) pressure sensor using Aluminium
Nitride (AlN). Theoretical studies, realization, and characterization of the pressure sensor on different SAW
structures are presented.
The modeling of the sensor was performed using an equivalent circuit based on Mason model and
Coupling-Of-Mode. The theoretical study, SAW parameters in different structures of AlN/SiO
2
/Si, AlN/Si, and
AlN/Mo/Si are calculated and analyzed. From these analysis, the wave velocity as well as coupling factor could
depend on the wave propagation medium. For each structure using AlN, we establish the range of thickness of
AlN layer, in which there is a weak dependence of the wave velocity and coupling factor on the AlN layer
thickness. The SAW devices should be designed, in particular for the choice of the thicknesses of the different
layers, by taking into account the accuracy of the manufacturing process, to reduce dispersion effects on the
sensors characteristics. Besides, we also performed the mechanical analysis of the membrane under pressure and
we have deduced the pressure sensitivity. The effect of frequency variation due to temperature change in SAW
device using AlN is given. For pressure measurement applications, we propose a method to reduce temperature
change effects.
Concerning the fabrication process, we propose to use surface micro-machining. This kind of
fabrication process allows to obtain exactly the dimensions of membranes used in pressure sensors and it also
allows to have any kind of geometry due to the silicon etch stop wall. Characterizations of AlN film are done
during fabrication process. We found that to increase the piezoelectric behavior of AlN, there are three possible
ways: using a bottom Mo layer, decreasing the roughness of the layer below the AlN layer up to 0.2nm and
increasing the thickness of AlN.
Acoustic propagation losses, coupling factor, effect of Mo layer and the effect of thin polyimide film on
the center frequency are experimentally analyzed. Finally, the measured pressure sensitivity of our device is
presented. This last result is promising.
Key words: surface acoustic wave (SAW), Aluminium Nitride (AlN), surface micro-machining; pressure sensor.
Table of content
i
Table of content
Introduction 1
UNIVERSITE JOSEPH FOURIER- GRENOBLE I 1
SCIENCES.TECHNOLOGIE.SANTE 1
T H E S E 1
JURY 1
Chapter 1 BACKGROUND 5
1.1 Acoustic wave devices 5
1.1.1 Thickness Shear Mode (TSM) resonator 6
1.1.2 Surface Acoustic Wave Device 7
1.1.2.1 SAW excitation and detection 9
1.1.2.2 SAW perturbation mechanisms 9
1.1.3 Acoustic Plate Mode (APM) devices 10
1.1.4 Flexural Plate Wave (FPW) or Lamb wave device 11
1.1.5 Comparation between four sensors 11
1.1.6 SAW sensor and the application pressure sensor in this research 12
1.1.6.1 SAW pressure sensor with one port IDT 13
1.1.6.2 SAW pressure sensor with two ports IDT 15
1.2 Piezoelectric materials. Aluminum Nitride (AlN) and its applications in SAW devices 16
1.2.1 Piezoelectric materials and the choice of AlN 16
1.2.2 General Information of AlN 19
1.3 Modelling SAW devices 21
1.3.1 Why Equivalent Circuit model is chosen? 21
1.3.2 The Finite Element Model (FEM) 23
1.4 Micromachining process, the choice of surface micromachining 24
1.5 Conclusion 27
Chapter 2 SAW PARAMETERS ANALYSIS AND EQUIVALENT CIRCUIT OF SAW DELAY LINE 29
2.1 Introduction 29
2.2 Calculation of SAW properties 30
2.2.1 Wave velocity, coupling factor in AlN/Si structure 31
2.2.2 Wave velocity, coupling factor in AlN/SiO
2
/Si structure 32
2.2.3 Wave velocity, coupling factor in AlN/Mo/Si structure 34
2.3 Equivalent circuit for SAW delay line based on Mason model 36
2.3.1 Equivalent circuit for IDT including N periodic sections 36
2.3.2 Equivalent circuit for propagation path 41
2.3.3 Equivalent circuit for SAW delay line 41
2.4 Equivalent Circuit for IDT Based On The Coupling-Of-Mode Theory 42
2.4.1 COM equation for particle velocities 43
2.4.2 Equivalent circuit for IDT based on com theory 44
2.4.3 Equivalent circuit for propagation path based on com theory 48
2.4.4 Equivalent circuit for SAW delay line based on COM theory 49
2.5 Comparison of Equivalent circuit of SAW device based on Mason model and COM thoery 52
2.6 Conclusion 52
Chapter 3 DESIGN OF SAW PRESSURE SENSOR DEVICES 55
3.1 Introduction 55
3.2 Temperature compensated structure for SAW device 55
3.2.1 Temperature dependence of Si, SiO
2
, AlN properties 55
3.2.2 Temperature Coefficient of Frequency (TCF) and temperature compensated structure for SAW
sensor 56
3.3 Pressure dependence of frequency and phase in saw delay line 61
3.3.1 Mechanical analysis of membrane under pressure 61
3.3.2 Pressure-dependence of frequency by pressure dependence of AlN elastic properties 64
3.3.3 Pressure-dependence of frequency by delay line 67
3.3.4 Pressure-dependence of phase shift 71
3.4 Conclusion 74
Table of content
ii
Chapter 4 FABRICATION PROCESS 77
4.1 General description 77
4.2 Masks designed 80
4.2.1 Trench, counter masque, hole, and PSG layers 80
4.2.2 Metal AlCu and polyimide layers 81
4.3 Creating the stop wall of etching SiO
2
- Trench 83
4.4 Non-selective epitaxy 85
4.5 COUNTER MASK lithography, etching Si and CMP process 88
4.6 Etching holes 89
4.7 HF Etching of the sacrificial layer 90
4.8 PSG 93
4.9 Depositing AlN as the piezoelectric layer and its properties 94
4.9.1 Influence of substrate roughness on crytal quality of AlN 94
4.9.2 Dependence of FWHM of AlN on AlN thickness 95
4.9.3 Dependence of FWHM of AlN on using bottom M
O layer 95
4.9.4 AlN at high temperature 96
4.10 Metal layer AlCu for IDT and probes 98
4.11 Polyimide as absorber 98
4.12 Conclusion 101
Chapter 5 CHARACTERIZATION OF SAW DEVICE 103
5.1 Parametric tests 103
5.1.1 The Square Resistance: Van Der Pauw 104
5.1.2 Isolation and continuity 105
5.1.3 Measuring under etching 106
5.1.4 Mask for parametric test 107
5.1.5 Parametric characterization 109
5.2 Experimental setup 111
5.3 Experimetal results 114
5.3.1 Propagation losses measurement 114
5.3.2 Piezoelectric coupling factor extraction 115
5.3.3 Comparison between experiment and simulation 118
5.3.4 Effect of Mo layer on performance of AlN/Si SAW device 119
5.3.5 Effect of thin Polyimide film 123
5.3.6 Device under pressure 126
5.3.6.1 Phase shift 126
5.3.6.2 Frequency shift 127
5.4 Conclusion 128
CONCLUSION and PERSPECTIVE 151
List of publication paper 155
Appendix A Properties of Si, SiO
2
, AlN and Mo 137
Appendix B Development of calculation for equivalent circuit of SAW device 139
Appendix C Equipments used to control each fabrication step and to characterise device 157
C. 1 OPTICAL MICROSCOPES 157
C. 2 SCANNING ELECTRON MICROSCOPE (SEM) 157
C. 3 VEECO PROFILING SYSTEM 158
C. 4 ATOMIC FORCE MICROGRAPH (AFM) 160
C. 5 X-RAY DIFFRACTION (XRD) SYSTEM 162
C. 6 SURFACE PROFILER TENCOR P-11 163
C. 7 FLEXUS F2320 DUAL WAVELENGTH STRESS MEASUREMENT SYSTEM 163
Reference 185
List of tables
iii
List of Tables
Table 1.1 QUALITATIVE CHARACTERISTICS OF THE FOUR SENSOR FAMILIES DISCUSSED 12
Table 1.2 ADVANTAGES AND DISADVANTAGES OF SOME PIEZOELECTRIC MATERIALS
COMMON USED IN SAW DEVICES 18
Table 1.3 COMPARISON BETWEEN BULK AND SURFACE MICROMACHINING TECHNOLOGIES 25
Table 3.1 TEMPERATURE DEPENDENCE OF SI, SIO
2
AND ALN PROPERTIES 56
Table 3.2 TEMPERATURE DEPENDENCE OF C
12
AND C
13
OF ALN 56
Table 3.3 VALUES OF TCFS IN SAW DEVICES AT DIFFERENT TEMPERATURE (
0
C) 58
Table 3.4 THE PRESSURE DEPENDENCE OF ALN ELASTIC CONSTANTS 65
Table 3.5 VALUES OF PCFS IN ALN/SIO
2
(KHSIO
2
= 0.1571)/SI SAW DEVICES AT DIFFERENT
PRESSURE (BAR) 65
Table 3.6 A
PE
COEFFICIENT IN SAW DEVICE A
L
N/S
I
O
2
(KHSIO
2
=0.1571)/S
I
SUBSTRATE 67
Table 3.7 THE VALUE OF COEFFICIENT A
PL
71
Table 3.8 COMPARISON BETWEEN THE PRESSURE DEPENDENCE OF FREQUENCY SHIFT,
PRESSURE DEPENDENCE OF ELASTIC CONSTANT AND EFFECT OF PRESSURE ON DELAY
LINE IN SAW DEVICE (WAVELENGTH: 8m) 71
Table 4.1 FABRICATION PROCESS 78
Table 4.2 THE DIMENSION OF DEVICES 82
Table 4.3 MEASURED VALUES OF TRAPEZOID GROOVE, A AND B 83
Table 4.4 FABRICATION STEPS TO TEST SELECTIVE EPITAXY 86
Table 4.5 SPEED OF ETCHING SACRIFICIAL LAYER SIO
2
BY WET HF 49% AND VAPOR HF ON THE
WAFER WITHOUT TRENCHES ETCHED 91
Table 4.6 SPEED OF ETCHING SACRIFICIAL LAYER SIO
2
BY WET HF 49% ON THE WAFER WITH
TRENCHES ETCHED 92
Table 4.7 PARAMETERS USED FOR DEPOSITION OF ALN 94
Table 4.8 STEPS TO CHARACTERISE ALN IN HIGH TEMPERATURE, FOUR SAPMPLES 96
Table 4.9 SOLUTION PROPERTIES OF PI-2610 100
Table 5.1 DESCRIPTION OF MASK 1 FOR PARAMETRIC TESTS: SQUARE RESISTANCE,
ISOLATION, CONTINUITY, UNDER ETCHING 108
Table 5.2 THE VALUE OF THE FINGER WIDTH IN MASK 1, MASK 2 (Figure 5.4-Figure 5.5) 108
Table 5.3 COMPARISON OF MEASUREMENTS OF SAW FILTERS D5 120
Table 5.4 COMPARISON BETWEEN CENTER FREQUENCIES OF DEVICES WITH DIFFERENT
LENGTHS OF POLYIMIDE 123
Table 5.5 EFFECT OF DIFFERENT THICKNESSES OF POLYIMIDE ON CENTER FREQUENCY 124
Table A. 1 ELASTIC CONSTANT OF Si, SiO
2
, AlN AND Mo 137
Table A. 2 PIEZOELECTRIC CONSTANT OF AlN 137
Table A. 3 DIELECTRIC CONSTANTS OF Si, SiO
2
137
Table A. 4 DIELECTRIC CONSTANTS OF AlN 137
Table A. 5 MASS DENSITY OF Si, SiO
2
, AlN AND Mo 137
Table C. 1 FWHM MEASUREMENT CONDITIONS 162
List of figures
v
List of Figures
Figure 1.1 Schematic sketches of the four types acoustic sensors (a) the Thickness Shear Mode (TSM)
resonator, (b) the Surface Acoustic Wave (SAW) device, (c) the Acoustic Plate Mode (APM) device, (d)
the Flexural Plate Wave (FPW) or Lamb wave device 6
Figure 1.2 The thickness shear mode resonator 7
Figure 1.3 Rayleigh waves move vertically in a direction normal to the surface plane of a surface acoustic wave
(SAW) sensor. SAW waves are very sensitive to surface changes, but do not work well for most liquid
sensing applications 8
Figure 1.4 The wave energy is confined to within one wavelength from the surface of a SAW sensor. This
characteristic yields a sensor that is very sensitive to interactions with the surface 8
Figure 1.5 SAW with IDT excitation and detection 9
Figure 1.6 In the shear-horizontal acoustic plate mode (SH-APM) sensor, the waves travel between the top and
bottom surfaces of the plate, allowing sensing on either side 10
Figure 1.7 Schematic of a flexural plate wave device. The side view shows the different layers and membrane
movement. Interdigital electrodes are used for actuation 11
Figure 1.8 Side views and cross sections of four devices 12
Figure 1.9 Environmental influences to the SAW sensors 13
Figure 1.10 SAW wireless pressure sensor with one broadband reflective delay line 14
Figure 1.11 SAW pressure sensor, one IDT and with external sensor circuit Z 15
Figure 1.12 General structure of a SAW pressure sensor with two IDTs 15
Figure 1.13 Hexagonal SAW device 27
Figure 2.1 IDT parameters 30
Figure 2.2 Calculated values of wave velocity V
0
and Vs in SAW device AlN/Si substrate depend on the
normalized thickness khAlN of AlN layer 32
Figure 2.3 Calculated values of coupling factor K(%) in SAW device AlN/Si substrate depends on the
normalized thickness khAlN of AlN layer 32
Figure 2.4 Dependence of wave velocity in SAW device AlN/SiO
2
/Si substrate on the normalized thickness
khAlN of AlN layer and khSiO
2
33
Figure 2.5 Dependence of coupling factor K(%) in SAW device AlN/ SiO
2
/Si substrate on the normalized
thickness khAlN of AlN layer and khSiO
2
33
Figure 2.6 Displacement profile along the depth of the multilayer AlN/SiO
2
/Si, khSiO
2
=0.7854 34
Figure 2.7 Wave velocity AlN/Mo/Si substrate depends on the normalized thickness khAlN and khMo 35
Figure 2.8 Coupling factor K(%) in SAW device AlN/Mo/Si substrate depends on the normalized thickness
khAlN and khMo 35
Figure 2.9 Displacement profile along the depth of the multilayer AlN/Mo/Si, khAlN=2.7 36
Figure 2.10 Interdigital transducer diagram 37
Figure 2.11 Side view of the interdigital transducer and 2 analogous one-dimensional configurations (a) Actual
model, (b) “crossed-field” model, (c) “in-line field” model 37
Figure 2.12 Mason equivalent circuit for one periodic section in “crossed-field” model 38
Figure 2.13 Mason equivalent circuit for one periodic section in “in-line field” model 38
Figure 2.14 IDT including the N periodic sections connected acoustically in cascade and electrically in parallel
40
Figure 2.15 Equivalent circuit of propagation path, based on Mason model 41
Figure 2.16 Equivalent circuit of SAW delay line, based on Mason model 42
Figure 2.17 IDT including N periodic sections 43
Figure 2.18 Equivalent circuit IDT based on COM theory 47
Figure 2.19 Equivalent circuit of propagation path based on COM theory 49
Figure 2.20 Equivalent circuit of SAW delay line based on COM theory 50
Figure 2.21 Effect of O
12
on S21(dB), N=50, v
SAW
=5120m/s, =8m, K=0.066453, O
11
=0 51
Figure 2.22 Effect of O
11
on S21(dB), N=50, v
SAW
=5120m/s, =8m, K=0.066453, O
12
=0 51
Figure 2.23 Comparison between Hydrid model and COM model (O
11
=O
12
=0) 52
Figure 3.1 f/f0(ppm) depending on temperature in SAW device: AlN/SiO
2
(khSiO
2
=0.0785)/Si substrate 58
Figure 3.2 f/f0(ppm) depending on temperature in SAW device: AlN/SiO
2
(khSiO
2
=0.0785)/Si substrate 59
Figure 3.3 f/f0(ppm) depending on temperature in SAW device: AlN/SiO
2
(khSiO
2
=0.3927)/Si substrate 59
Figure 3.4 f/f0(ppm) depending on temperature in SAW device: AlN/SiO
2
(khSiO
2
=0.3927)/ Si substrate 60
Figure 3.5 The rectangle membrane with four fixed-boundaries 61
List of figures
vi
Figure 3.6 The infinitely long rectangular membrane with two fixed-boundaries 62
Figure 3.7 d in multilayer: Si (1 m), SiO
2
(200nm), AlN (1-5 m) 63
Figure 3.8 d in multilayer: Si (2.42 m), SiO
2
(200nm), AlN (1-5 m) 64
Figure 3.9 Pressure dependence of AlN elastic constants [132] 64
Figure 3.10 f/f
0
(ppm) by pressure-dependence of elastic in AlN/SiO
2
(khSiO
2
=0.1571)/Si substrate 66
Figure 3.11 The measurement of frequency shift only by different delay line 68
Figure 3.12 The measurement of frequency shift only by different delay line 68
Figure 3.13 The measurement of frequency shift only by different delay line (zoom in) 69
Figure 3.14 The measurements of frequency shift only by different delay line, on four wafers of N309P 69
Figure 3.15 The measurement of frequency shift only by different delay line, on four wafers of P538P 70
Figure 3.16 Pressure dependence of phase shift in SAW device: AlN(1-
5m)/SiO
2
(200nm)/Si (2.4m) 73
Figure 4.1 A configuration of SAW device 80
Figure 4.2 A configuration of SAW device with Mo layer 80
Figure 4.3 Masks for Trench, counter mask, hole, and PSG layers 81
Figure 4.4 General view for all of devices in one die 81
Figure 4.5 Description of devices 82
Figure 4.6 Top view of one trench designed 83
Figure 4.7 Trapezoid groove after etching trench 84
Figure 4.8 Trench of expected 1.2µm width 84
Figure 4.9 Trench of expected 3µm width 84
Figure 4.10 Perspective view of 2 µm wide trench 85
Figure 4.11 Perspective view after non-selective epitaxy 85
Figure 4.12 Slide view of 1.2µm wide trench, non selective epitaxy 87
Figure 4.13 Slide view of 1.2µm wide trench, selective epitaxy 87
Figure 4.14 Slide view of 2µm wide trench, non selective epitaxy 87
Figure 4.15 Slide view of 2µm wide trench, selective epitaxy 87
Figure 4.16 Slide view of 3µm wide trench, non selective epitaxy 87
Figure 4.17 Slide view of 3µm wide trench, selective epitaxy 87
Figure 4.18 Slide view of 4µm wide trench, non selective epitaxy 88
Figure 4.19 Slide view of 4µm wide trench, selective epitaxy 88
Figure 4.20 Etching is used to partially etch superficial Si layer 88
Figure 4.21 CMP is use to remove the groove and to adjust the required thickness of superficial Si layer 88
Figure 4.22 SEM image of a hole with expected 1.6µm in diameter 89
Figure 4.23 SEM image of trench and holes being outside the expected membrane 89
Figure 4.24 Wet HF 49% etching SiO
2
layer during 110 minutes throughout hole of 1.2µm in diameter 90
Figure 4.25 Vapor HF etching SiO
2
layer during 20 hours throughout hole of 1.2µm in diameter after wet HF
etching 90
Figure 4.26 Wet HF 49% etching SiO
2
layer during 110 minutes throughout hole of 2µm in diameter 90
Figure 4.27 Vapor HF etching SiO
2
layer during 20 hours throughout hole of 2µm in diameter after wet HF
etching 90
Figure 4.28 Wet HF 49% etching SiO
2
layer during 110 minutes throughout hole of 3µm in diameter 91
Figure 4.29 Vapor HF etching SiO
2
layer during 20 hours throughout hole of 3µm in diameter after wet HF
etching 91
Figure 4.30 Wet HF 49% etching SiO
2
layer during 110 minutes throughout hole of 4µm in diameter 91
Figure 4.31 Vapor HF etching SiO
2
layer during 20 hours throughout hole of 4µm in diameter after wet HF
etching 91
Figure 4.32 HF etching with 1.2µm-diameter hole during 110 minutes 92
Figure 4.33 HF etching with 2µm-diameter hole during 110 minutes 92
Figure 4.34 HF etching with 3µm-diameter hole during 110 minutes 92
Figure 4.35 HF etching with 4µm-diameter hole during 110 minutes 92
Figure 4.36 Top view of the membrane completed 93
Figure 4.37 SEM image of the membrane 93
Figure 4.38 Depositing PSG 93
Figure 4.39 Etching PSG 93
Figure 4.40 SEM slide view 1 of PSG plug 93
Figure 4.41 SEM image of a PSG plug 93
Figure 4.42 Influence of substrate roughness on crystal quality of AlN 94
Figure 4.43 The FWHM of 1µm and 3µm AlN films, (a) without Mo layer below AlN, (b) with Mo layer below
AlN 95
Figure 4.44 Effect of using bottom Mo on crystal quality of AlN, 1µm and 3µm 96
List of figures
vii
Figure 4.45 FWHM of AlN 1m films for four samples. The red line is measure 1, the green line is measure 2,
and the blue line is measure 3 97
Figure 4.46 The FWHM comparison of 1µm AlN films in four samples 97
Figure 4.47 AlCu metal layer is created on the AlN layer 98
Figure 4.48 Spin speed curve (coated for 30 seconds at indicated speed) 100
Figure 4.49 SEM images of polyimide on AlN 100
Figure 5.1 The pattern to measure the square resistance, Van Der Pauw method 104
Figure 5.2 The pattern for checking the isolation and continuity 105
Figure 5.3 The pattern to measure under etching 106
Figure 5.4 The mask 1 designed for parametric test: square resistance, isolation, continuity, under etching 107
Figure 5.5 The mask 2 designed for parametric test: isolation, continuity 108
Figure 5.6 Dies position on 200mm-wafer 109
Figure 5.7 Color map of isolation between pin 9 and pin 10 110
Figure 5.8 Color map of resistance continuity 110
Figure 5.9 Color map of isolation between pin 1 and pin 2, one die is not isolated 110
Figure 5.10 Color map of continuity pin 16, 1, 3 and 4 of one wafer 110
Figure 5.11 Results of square resistance characterization of all dies on one wafer 110
Figure 5.12 General view of device under test, frequency range of 50MHz-1GHz 111
Figure 5.13 The software interfacing between PC and machine 112
Figure 5.14 Snapshot of measurement with 2 probes GSG 112
Figure 5.15 Devices are cut and wire bonded 112
Figure 5.16 Box sealed to apply the pressure with the devices in it 113
Figure 5.17 Pressure meter with two valves 113
Figure 5.18 A typical insertion loss vs. frequency for two propagation paths of length 350 µm and 250 µm 114
Figure 5.19 Measured propagation losses at three center frequencies 115
Figure 5.20 Real part of input impedance 116
Figure 5.21 Acoustic input admittance Y
a
(f) extracted from Z
a
(f) 116
Figure 5.22 Coupling factor K(%) in AlN/Si, comparison between calculation and measurement 117
Figure 5.23 Coupling factor K(%) in AlN/SiO
2
/Si, comparison between calculation and measurement 118
Figure 5.24 Frequency response and Comparison between experiment (high resistance and normal substrate)
and simulation. 118
Figure 5.25 Comparison between AlN/Mo/Si and AlN/Si SAW devices 119
Figure 5.26 The thickness of Mo and AlN-dependence of wave velocity 120
Figure 5.27 The thickness of Mo and AlN-dependence of coupling factor 121
Figure 5.28 Atomic force micrographs of AlN 2µm with Mo layer below 122
Figure 5.29 Atomic force micrographs of AlN 2µm without Mo layer below 122
Figure 5.30 SAW devices with different length of absorber are realized 123
Figure 5.31 S21(dB) with different lengths of polyimide 123
Figure 5.32 The effect of different lengths of polyimide on the center frequency 124
Figure 5.33 Effect of polyimide on the center frequency, thickness of polyimide is 95nm in (a), and is 2850nm
in (b) 125
Figure 5.34 Simulation of S21(dB), effects of polyimide films on the f0 125
Figure 5.35 Measured membrane deformation 126
Figure 5.36 Measured phase shift by pressure 127
Figure 5.37 Frequency variation under pressure 127
Figure B. 1 Mason equivalent circuit for one periodic section in “crossed-field” model 139
Figure B. 2 Mason equivalent circuit for one periodic section in “in-line field” model 139
Figure B. 3 One periodic section represented by 3-port network, admittance matrix [y] 140
Figure B. 4 3-port network representation of one periodic section, with the change of sign between Y
13
and Y
23
to ensure that acoustic power flows symmetrically away from transducer 140
Figure B. 5 3-port network representation of one periodic section, with the no change of sign between Y
13
and
Y
23
140
Figure B. 6 IDT including the N periodic sections connected acoustically in cascade and electrically in parallel
142
Figure B. 7 The [Y] matrices and the model corresponsive models 143
Figure B. 8 “N+1/2” model IDT 147
Figure B. 9 Equivalent circuit of “N+1/2” model IDT 147
Figure B. 10 [Yd] matrix representation of “N+1/2” model IDT 147
Figure B. 11 [ABCD] representation of two-port network for one IDT 150
List of figures
viii
Figure B. 12 Two-port network for one IDT 151
Figure B. 13 Cascaded [ABCD] matrices of input IDT, propagation way and output IDT 154
Figure B. 14 [ABCD] matrix of SAW device 154
Figure C. 1 Optical Microscope image 157
Figure C. 2 Etching polyimide during 170s 158
Figure C. 3 Etching polyimide during 180s 158
Figure C. 4 WYKO used to measure membrane deformation in 2-D 159
Figure C. 5 WYKO used for 3-dimensional surface profile measurement 159
Figure C. 6 3-D profile of device fabricated completely 160
Figure C. 7 AFM image of Si layer 161
Figure C. 8 WYKO 2-D used to measure the roughness of Si layer 161
Figure C. 9 WYKO 3-D used to measure the roughness of Si layer after etching by HF 49% during 110 minutes
162
Glossary
ix
Glossary
AFM Atomic Force Microscope
APM Acoustic Plate Mode
BAW Bulk Acoustic Wave
CMP Chemical Mechanical Polishing
COM Coupling Of Mode
FE Finite Element
FEM Finite Element Method
FPW Flexural Plate Wave
FWHM Full-Width at Half Maximum
HF HydroFluoric acid
ID IDentification
IDT InterDigital Transducer
MEMS Micro Electro Mechnical System
PBC Periodic Boundary Condition
PCE Pressure Coefficient of Elastic constant
PCF Pressure Coefficient of Frequency
PSG PhosphoSilicate Glass
RF Radio Frequency
RIE Reactive Ion Etching
RTV Room Temperature Vulcanisation
SAW Surface Acoustic Wave
SCS Single Crystal Silicon
SEM Scanning Electron Microscope
SH Shear Horizontal
SOLT Short Open Load Through
TCF Temperature Coefficient of Frequency
TCV Temperature Coefficient of Velocity
TSM Thickness Shear Mode
VNA Vector Network Analyzer
AlCu Aluminium Copper alloy
AlN Aluminium Nitride
GaAS Gallium Arsenide
H3PO4 Phosphoric acid or orthophosphoric acid
LiNbO3 Lithium Niobate
LiTiO3 Lithium Titanate
Mo Molybdenum
NMP N-methyl-2-pyrrolidone
Pt-PbTiO3 Platinium - Lead Titanate
PVDF Polyvinylidene Fluoride
PZT Lead Zirconate Titanate
Si Silicon
SiC Silicon carbide
SiO2 Silicon dioxide
SOI Silicon On Insulator
ZnO Zinc Oxyde
Introduction
1
Introduction
In the field of the sensors and actuators, two great principles of detection and excitation
coexist:
+ The electrostatic has the easily integrated and advantage of being in high temperature.
However, it is very limited in term of density of energy and it requires strong supply voltages,
which is not easily compatible with integration on silicon.
+ The piezoelectric offers a strong density of energy and a lower supply voltage. The
piezoelectric materials have appeared and pushed by many developments on SAW (Surface
Acoustic Wave) and BAW (Bulk Acoustic Wave).
Surface acoustic wave (SAW) and bulk acoustic wave (BAW) devices have been widely
used in a variety of applications, both in consumer electronics as well as in industrial,
commercial, medical and military applications or equipment. Although the telecommunication
industry is the largest user of these devices, SAW based devices have many attractive features
to be explored. Due to their small size, high sensitivity to external physical parameters and
from the properties of the film deposited on the SAW substrate, they can react very fast to the
changes in the environmental conditions. As physical or chemical quantities can be measured
from remote locations without the need for a separate power supply, SAW sensors have some
advantages as follows:
+ They can be placed on moving or rotating parts, for instance, in tire pressure.
+ They cand be used in hazardous environments such as high voltage plants,
contaminated areas, strong radioactive areas, high vacuum process chambers, extreme heat,
where the use of conventional sensor with wire connection is impossible, dangerous for
human, complicated or expensive.
+ Besides, because SAW sensors can operate at high frequencies (GHz range), they
can be well protected from the low frequencies electromagnetic interference that occurs in the
vicinity of industrial equipment such as high voltage line.
The more common applications of acoustic wave sensors are Temperature, Pressure,
Torque, Mass, Humidity, Vapor Chemical, and Bio sensors. Among these sensors, pressure
sensor play a key part of many systems, both commercial and industrial.
SAW pressure sensors have been developed by using many different piezoelectric
materials. Conventional piezoelectric materials such as quartz, LiNbO
3
and LiTaO
3
suffer
Introduction
2
from a variety of limitations and in particular low SAW/BAW velocity as well as being
incompatible with the IC (Integrated Circuit) technology. As a low-cost technique, thin-film
sputtering of novel SAW materials like ZnO has gained much interest recently. However,
their manufacturing methods were not, until the beginning of this thesis, compatible with high
temperature process and consequently applications (>500°C). Besides, these piezoelectric
materials exhibit medium to low SAW velocity, making them expensive to use in the
microwave region due to increased lithography resolution requirements. The resonance
frequency of a SAW device is determined by the equation
/
ph
f v
, where f is the resonance
frequency, v
ph
is the phase velocity of SAW and
is the wavelength, which in turn is defined
by the electrode pitch in the interdigital transducer (IDT). Hence, high-resolution lithography
and/or the use of high acoustic velocity materials are the two main approaches for the
fabrication of high-frequency SAW devices. The first one, however, results in an increased
fabrication cost due to poorer reliability and durability,; the second one is the limitation to the
choice of commercially available piezoelectric materials.
For approximately six years, a new material, the aluminum nitride (AlN), has appeared in
the field of micro-electronics, pushed by many developments on BAW RF resonators of the
type. AlN is an attractive material for high-frequency SAW and for many SAW applications
due to its good properties, such as outstanding ultrasonic velocity, thermal and chemical
stability. Beside, its process of deposit compatible with silicon offers new prospects for the
realization of sensors and piezoelectric actuators, in particular its behavior at high temperature
(up to 1000
0
C).
The goal of this thesis is the design and realization of SAW pressure sensor using AlN.
This kind of device can be used in high temperature applications. However, in large range
of temperature, properties of materials are affected by temperature variations. Therefore, the
center frequency is sensible to temperature changes. For pressure application, this sensitivity
must be reduced. Usually, temperature compensation can be done by using one port Inter
Digital Transducer (IDT) and at least three reflectors to create several propagation paths of
different lengths and then a signal processing step is performed to reduced effect of
temperature. This technique was used for quartz pressure sensors. To solve this problem, in
SAW pressure sensors, we propose to use a multi-layers structure AlN/SiO
2
/Si to obtain an
effect of self temperature compensation, by choosing material having opposite temperature
coefficients.
Introduction
3
The organization of the manuscript
This thesis is divided into five chapters.
Chapter 1 presents a general view of acoustic wave devices and SAW sensors. It also
gives a comparison between piezoelectric materials and reason why choosing AlN as
piezoelectric layer. Another important point presented in this chapter is micro-machining
process. To model the SAW devices, some models were proposed and developed by many
groups. Among them, the equivalent circuit is chosen to model the SAW device.
From this point of chapter 1, equivalent circuit of SAW device based on Mason model and
Coupling-Of-Mode is presented in
chapter 2. This chapter also analyses the SAW parameters
in different structures of SAW devices (AlN/SiO
2
/Si, AlN/Si, and AlN/Mo/Si).
Chapter 3 gives the development of the model used for SAW pressure sensor and
mechanical analysis of the sensitive membrane under pressure. Besides, the effect of
frequency variation due to temperature changes is derived from materials properties. This
chapter also gives the results of frequency variations due to temperature changes.
Chapter 4 presents the details of fabrication process using surface micro-machining as
well as the characterization results of AlN films which is an important part in SAW devices.
The chapter 5 shows the parametric tests and procedure to check the device fabrication.
These tests and procedures allow a fast process control of the deposited/etched layers during
the fabrication, and also a fast characterization of all dies on the wafer. The major
experimental results, the explanations and analyses of obtained results will be given in this
chapter.
At the end, a general conclusion and perspectives are given.
This work was done at CEA/LETI/DIHS/LCMS and IMEP-LAHC, Grenoble from
10/2005-09/2008.
Chapter 1: Background
5
Chapter 1
BACKGROUND
1.1 ACOUSTIC WAVE DEVICES
Acoustic wave devices have been in commercial use for more than 60 years. They offer
many applications:
+ In electronics, telecommunications industry, acoustic wave filters used in mobile
cell phones and base stations. These are typically surface acoustic wave (SAW) devices which
act as band pass filters in both the radio frequency and intermediate frequency sections of the
transceiver electronics. They are also used as resonators, delay lines, convolvers or wireless
identification systems (ID tags).
+ In sensor devices:
automotive applications (torque, tire pressure sensors),
medical applications (chemical sensors),
Industrial and commercial applications (vapour, humidity, temperature,
mass sensors).
Acoustic wave sensors are so called because their detection mechanism uses a mechanical,
or acoustic, waves. As the acoustic wave propagates through or on the surface of the material,
any changes to the characteristics of the propagation path affect the velocity and/or amplitude
of the wave. Changes in velocity can be monitored by measuring the frequency or phase
characteristics of the sensor and can then be correlated to the corresponding physical or
chemical quantity being measured.
All acoustic waves devices and sensors use a piezoelectric material to generate and detect
acoustic waves. Devices have been constructed in a number of configurations for sensor
applications. Those devices most commonly used in sensor applications include:
the Thickness Shear Mode (TSM) resonator,
the Surface Acoustic Wave (SAW) device,
the Acoustic Plate Mode (APM) device,
The Flexural Plate Wave (FPW) or Lamb wave device.
Chapter 1: Background
6
Each of these devices shown in Figure 1.1 uses a unique acoustic mode.
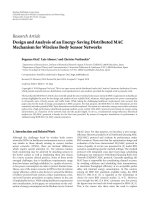
Figure 1.1 Schematic sketches of the four types acoustic sensors (a) the Thickness Shear
Mode (TSM) resonator, (b) the Surface Acoustic Wave (SAW) device, (c) the Acoustic
Plate Mode (APM) device, (d) the Flexural Plate Wave (FPW) or Lamb wave device
There is a distinction between these devices. They can be divided into two groups: one-
port device (TSM resonator) and two-port device (SAW, APM and FPW devices). In one-port
acoustic devices, a single port serves as both the input and the output port. The input signal
excites an acoustic mode which in turn generates charges on the input electrode. These signals
combine to produce an impedance variation that constitutes the TSM resonator response. In
two-port devices, one port is used as the input port and the other as an output port, these are
typically interchangeable. The input signal generates an acoustic wave that propagates to a
receiving transducer, which generates a signal on the output port.
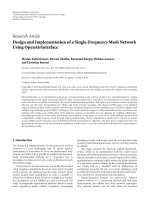
1.1.1 Thickness Shear Mode (TSM) resonator
The Thickness Shear Mode (TSM) Resonator widely referred to as a quartz crystal
microbalance (QCM), is the best-known, oldest and simplest acoustic wave device. As shown
in Figure 1.2, the TSM typically consists of a thin disk of AT-cut quartz with parallel circular
electrodes patterned on both sides. The application of a voltage between these electrodes
results in a shear deformation of the crystal.
(d)
Chapter 1: Background
7
This device is known as a resonator because the crystal resonates as electromechanical
standing waves are created. The displacement is maximized at the crystal faces, making the
device sensitive to surface interactions. The TSM resonator was originally used to measure
metal deposition rates in vacuum systems where it was commonly used in an oscillator
circuit. The oscillation frequency tracks the crystal resonance and indicates mass
accumulation on the device surface. In the late 1960s, the TSM resonator was shown to
operate as a vapour sensor.
The TSM features simplicity of manufacture, ability to withstand harsh environments,
temperature stability and good sensitivity to additional mass deposited on the crystal surface.
Because of its shear wave propagation component, the TSM resonator is also capable of
detecting and measuring liquids, making it a good candidate for a biosensor. Unfortunately,
these devices have the lowest mass sensitivity of the sensors examined here. Typical TSM
resonators operate between 5 and 30 MHz. Making very thin devices that operate at higher
frequencies can increase the mass sensitivity, but thinning the sensors beyond the normal
range results in fragile devices that are difficult to manufacture and handle. Recent work has
been done to form high-frequency TSM resonators using piezoelectric films and bulk silicon
micromachining techniques.
1.1.2 Surface Acoustic Wave Device
The stress-free boundary imposed by the surface of a crystal gives rise to a unique acoustic
mode whose propagation is confined to the surface and therefore is known as a surface
acoustic wave (SAW). In 1887, Lord Rayleigh discovered the surface acoustic wave mode of
propagation and in his classic paper predicted the properties of these waves [1]. The
theoretical aspect of acoustic wave was written by Viktorov [1]. Named for their discoverer,
Rayleigh waves have a longitudinal and a vertical shear component that can couple with a
Figure 1.2 The thickness shear mode resonator
Chapter 1: Background
8
medium in contact with the device’s surface (see Figure 1.3). The surface deformation is thus
elliptic. Such coupling strongly affects the amplitude and velocity of the wave. This feature
enables SAW sensors to directly sense mass and mechanical properties. The surface motion
also allows the devices to be used as microactuators. The wave has a velocity that can be ~5
orders of magnitude less than the corresponding electromagnetic wave, making Rayleigh
surface waves among the slowest to propagate in solids. The wave amplitudes are typically
~10 Å and the wavelengths range from 1 to 100 microns in sensors applications.
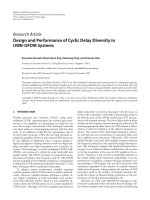
Figure 1.4 details the deformation field caused by a SAW propagating along the Z-axis and
the associated distribution of potential energy. Because Rayleigh waves have virtually all their
acoustic energy confined within one wavelength under the surface, SAW sensors have the
highest sensitivity of the acoustic sensors reviewed.
Figure 1.3 Rayleigh waves move vertically in a direction normal to the surface plane of a
surface acoustic wave (SAW) sensor. SAW waves are very sensitive to surface changes,
but do not work well for most liquid sensing applications
Figure 1.4 The wave energy is confined to within one wavelength from the surface
of a SAW sensor. This characteristic yields a sensor that is very sensitive to
interactions with the surface
Chapter 1: Background
9
One disadvantage of these devices is that Rayleigh waves are surface-normal waves,
making them poorly suited for liquid sensing. When a SAW sensor is contacted by a liquid,
the resulting compressional waves cause an excessive attenuation of the surface wave.
1.1.2.1 SAW excitation and detection
Viktorov presented some methods for the acoustic wave excitation [1]. And, useful method
was discovered by R.M.White of the University of California at Berkeley [3] in which surface
acoustic wave could be excited and detected by lithographically pattern interdigital electrodes
(or InterDigital Transducer IDT) on the surface of piezoelectric crystals (see Figure 1.5). This
discovery has led to widespread use of SAW devices in a number of applications such as
frequency filters, delay lines, resonators, convolvers, correlators.
Figure 1.5 SAW with IDT excitation and detection
1.1.2.2 SAW perturbation mechanisms
When SAW devices are used for sensors or thin-film characterization, the measured
responses arise from perturbation in wave propagation characteristics, specifically wave
velocity and attenuation, resulting from interactions between the SAW and a surface layer.
Because a SAW propagating in a piezoelectric medium generates both mechanical
deformation and an electrical potential, both mechanical and electrical coupling between the
SAW and surface film are possible. Therefore, a number of interactions between surface
waves and a surface film have been found that give rise to velocity and attenuation responses.
SAW-film interactions that arise from mechanical coupling between the wave and film
include
mass loading caused by the translation of the surface mass by SAW surface
displacement, elastic and viscoeleastic effects caused by SAW-induced deformation of a
surface film.
Chapter 1: Background
10
SAW-film interactions that arise from electrical coupling between the wave and film
include acoustoelectric interactions between electric fields generated by the SAW and charge
carriers in a conductive film. Some new interactions are being discovered all the time.
1.1.3 Acoustic Plate Mode (APM) devices
These devices utilize a shear-horizontal (SH) acoustic plate mode (APM), which has been
developed for sensing in liquids. SH modes have particle displacement predominantly parallel
to the device surface and normal to the direction of the propagation. The absence of a surface-
normal component of displacement allows each SH plate mode to propagate in contact with a
liquid without coupling excessive amounts of acoustic energy into the liquid. By comparison,
when surface acoustic waves are propagated at a solid-liquid interface, the surface-normal
displacement radiates compressional waves into the liquid and severely attenuates the wave.
These devices use a thin piezoelectric substrate, or plate, functioning as an acoustic
waveguide that confines the energy between the upper and lower surfaces of the plate (see
Figure 1.6). This is in contrast to the SAW, for which nearly all the acoustic energy is
concentrated within one wavelength of the surface. As a result, both surfaces undergo
displacement, so detection can occur on either side. This is an important advantage, as one
side contains the interdigital transducers that must be isolated from conducting fluids or gases,
while the other side can be used as the sensor.
Figure 1.6 In the shear-horizontal acoustic plate mode (SH-APM) sensor, the waves travel
between the top and bottom surfaces of the plate, allowing sensing on either side
Although being more sensitive to mass loading than the TSM resonator, SH-APM sensors
are less sensitive than surface wave sensors. There are two reasons: the first is that the
sensitivity to mass loading and other perturbations depends on the thickness of the substrate,
with sensitivity increasing as the device is thinned. The minimum thickness is constrained by
Chapter 1: Background
11
manufacturing processes. Second, the energy of the wave is not maximized at the surface,
which reduces sensitivity.
1.1.4 Flexural Plate Wave (FPW) or Lamb wave device
A sensor concept similar to SAW sensors but employing Lamb waves was first presented
by Stuart W.Wenzel, Richard M.White in 1988 [14]. In a flexural plate wave (FPW) or Lamb
wave device (see Figure 1.7), an acoustic wave is excited in a thinned membrane with a
thickness small compared to the propagation wavelength. As with the other acoustic sensors
mentioned above, the FPW device can sense quantities that cause its phase velocity to change.
A unique feature of FPW is that it can be dimensioned so that its phase velocity is lower
than that of most liquids, which lie in the range from 900 to about 1500 m/s. When the FPW
device contacts or is immersed in such a liquid, a slow mode of propagation exists in which
there is no radiation from the plate. Thus, the FPW device functions well in a liquid
environment and is therefore a good candidate for biosensing and chemical sensing in liquid
[1].
Figure 1.7 Schematic of a flexural plate wave device. The side view shows the
different layers and membrane movement. Interdigital electrodes are used for actuation
1.1.5 Comparation between four sensors
Figure 1.8 shows the side views and cross sections of four devices, in which lower
diagrams in each column illustrate the wave motion; double-headed arrows indicate directions
of surface particle displacements and shaded areas illustrate the wave motion or indicate the
depth of wave penetration in the plate.
Table 1.1 summarizes qualitatively the characteristics of four sensors discussed above.