love and rachinsky - 2007 - corporate governance, ownership and bank performance in emerging markets - evidence from russia and ukraine [rcgi]
Bạn đang xem bản rút gọn của tài liệu. Xem và tải ngay bản đầy đủ của tài liệu tại đây (115.72 KB, 37 trang )
Corporate Governance, Ownership and Bank Performance in
Emerging Markets: Evidence from Russia and Ukraine.
*
Inessa Love
Development Research Group
The World Bank
Andrei Rachinsky
Center for Economic and Financial Research
at New Economic School
Abstract:
This paper presents evidence on the relationship between ownership,
corporate governance and operating performance in banks using a sample of
107 banks in Russia and 50 banks in Ukraine surveyed by International
Financial Corporation in 2003-2006. We find some significant, but
economically unimportant relationship between governance and
contemporaneous operating performance and an even weaker link with the
subsequent performance. We conclude that aside from the popularity of the
governance in public discussion, corporate governance has at best a second-
order effect on operating performance in Russian and Ukrainian banks. We
also find that in both countries banks with more concentrated ownership have
lower rankings on corporate governance.
JEL codes: G3, G21
Keywords: corporate governance, banking, ownership, emerging markets
*
We thank Vanessa Moreira da Silva for excellent research assistance, IFC representatives (Patrick
Luternauer in Moscow office and Desmond O'Maonaigh in Kiev office) for kindly allowing us to use IFC
bank survey results, and Mobile for making the Russian financial data available to us. We are also grateful
to Bernard Black, Bob Cull, Leora Klapper and Martin Raiser for useful discussions. All errors are our
own. The views expressed in this paper do not necessarily represent those of the World Bank, its Executive
Directors, or the countries they represent. Corresponding author: Inessa Love,
, The
World Bank, 1818 H St NW Washington DC, 20433.
2
Introduction
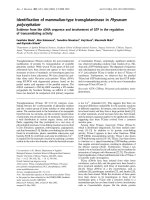
The banking sector in Russia and Ukraine has experienced rapid growth in recent years,
with total assets and equity more than doubling during the past 4 years between 2003 and
2006 (see Figure 1). Amidst this rapid growth, the issue of corporate governance has
received considerable attention among bankers and policymakers alike.
Research has demonstrated that financial institutions are critically important for growth
and efficient capital allocation (see Levine (2005)). In the rapidly growing economies of
Russia and Ukraine, as in many other emerging markets, the banks are set to play a
crucial role. It is, therefore, important to understand the key ingredients for maximizing
the performance of banks and their role in the growing economies. While the corporate
governance is deemed an important ingredient of bank operation, there is very little
empirical evidence to support the emphasis currently placed by market participants and
policy makers on the issue of corporate governance. The paper attempts to fill in this gap.
This paper explores the link between ownership, corporate governance and bank
performance using proprietary bank surveys of 50 banks in Ukraine surveyed in 2004,
and 107 banks in Russia (50 surveyed in 2003 and 81 in 2006). The surveys were
conducted by the local offices of the International Finance Corporation. The
questionnaires contained detailed questions about bank’s corporate governance and
ownership (see IFC (2004a), IFC (2004b), IFC (2007)). We supplemented the governance
data with financial data collected from Russia and Ukraine reporting agencies.
Russia and Ukraine present interesting case studies of banking sector and the issue of
corporate governance in particular. Most of the banks in these countries are de-novo
banks, i.e. those that entered the markets after the fall of the communist empire, while the
rest of the banks have changed the ownership from public to private in the last two
decades. A few of the remaining state owned banks have recently been active in
transforming their ownership structure and tapping the private financial markets with
equity share issuance (eg. Sberbank and VTB in Russia). The ownership is highly
3
concentrated in both countries, and almost all banks are controlled by a small group of
majority shareholders, often just one individual private owner. Foreign ownership is
increasing rapidly in both countries.
An important element in corporate governance research is the legal enforcement of the
laws on the books and provisions of the companies’ corporate charters and by-laws. Even
though the rule of law has improved from its post-communist low, it is still rather weak
in both Russia and the Ukraine. With the importance of corporate governance issues
given in the media and public discussions, many enterprises and banks go beyond of what
is required by law and adopt stricter corporate governance provisions suggested by
national and international best practices.
We find that in both countries banks with more concentrated ownership have lower
rankings on corporate governance. In other words, banks with more pronounced presence
of minority shareholders appear to have higher rankings on corporate governance. It is
not clear whether this relationship is due to the fact that banks with better corporate
governance are able to attract more minority shareholders, or whether banks with more
minority shareholders are more likely to adopt better governance practices to satisfy
minority shareholders’ demands. This is an important question to address in subsequent
research.
Our main focus is on the relationship between governance and performance. There are
several reasons to expect that better governed banks may have more efficient operations
and better performance. First, governance may reduce the incidence and amounts of
related-parties transactions and other “self-dealing” practices. Since such transactions are
usually sub-optimal from the efficiency point of view, the reduction in such transactions
should translate into improved performance. Second, better governed banks may have
lower cost of capital, especially if they employ subordinated debt financing. Third, better
governance may translate into more efficient and streamlined operations, as the
supervisory board and management functions are separated and modernized.
4
Most of the existing work on the relationship between governance and performance
focuses on publicly traded firms and measures performance as market values. Not much
is known on the potential influences of governance on operating performance, especially
in closely held private banks. With high ownership concentration, the controlling
shareholders are effectively in charge of running the bank and there is unlikely to be any
managerial agency costs. However, many banks in our sample do have minority
shareholders with less than 2% of ownership, so it’s these shareholders that are likely to
be affected by the inefficiencies and “self-dealing” by controlling shareholders.
We find some evidence of a positive contemporaneous relationship between governance
and performance in both countries, but it’s stronger in the Ukraine than it is in Russia.
For Ukraine we find that higher rankings on corporate governance index are associated
with higher contemporaneous return on assets, return on equity and net interest income.
For Russia we only find an association with return on assets and lower non-performing
loans.
To reduce the endogeneity problem (i.e. better performing banks may choose to have
better governance), we also evaluate the relationship between governance and subsequent
performance (the year after the governance was measured). For Ukraine we find a
positive but weaker relationship between governance and subsequent performance;
however we don’t find any relationship between governance and subsequent performance
in Russia.
The economic magnitude of the relationship is small in both countries. For example, one
standard deviation increase in corporate governance index results in about 0.3%-0.4%
increase in ROA, which is around 20% of one standard deviation in ROA. The magnitude
is slightly higher for ROE (significant for Ukraine only), but even then one standard
deviation change in governance results in about one-third of one standard deviation
change in ROE.
5
Aside from the potentially poor data quality and a small sample, our results are not strong
enough to suggest a robust relationship between governance and performance. Based on
our results it appears that aside from the popularity of the corporate governance issues in
public discussion, it has at best a second-order effect on performance in Russian and
Ukrainian banks.
Our paper adds to the broader literature on governance and performance, with a particular
focus on banking institutions. A significant research has focused on the effect of
ownership on performance, with a number of studies examining bank privatizations (see
for example a recent survey in Clarke, Cull and Shirley (2005). A separate strand of
literature examines foreign ownership and foreign entry and their impact on performance
(see Clarke, Cull, Martinez Peria and Sanchez, (2003)). For a discussion of specifics of
corporate governance in financial institutions see Levine (2004) and Macey and O'Hara
(2003). A survey of recent empirical literature on the topic of governance in banking with
specific focus on Russia and Eastern Europe can be found in Vernikov (2007).
A recent paper by Spong and Sullivan (2007) examines the relationship between bank
ownership and several governance aspects in US Midwest community banks. They focus
on the owner-manager agency problems and find that increasing ownership stakes for
hired managers and board improves bank performance. To the best of our knowledge, our
paper is the first example of relating corporate governance (measured by an index that
focuses on specific corporate governance provisions) to performance in banking
institutions.
A separate strand of literature examines relationship between corporate governance and
performance in publicly traded non-financial companies in emerging markets (see for
example Klapper and Love (2004) or Durnev and Kim (2005)). A recent example of such
research on Russia is Black, Love and Rachinsky (2006). They found strong and robust
relationship between governance and market values. However, there are several
important differences between the current paper and previous research: our paper looks at
banks rather than industrial companies, most of the banks in our sample are private rather
6
than publicly held, and we look at operating performance rather than market
performance, measured by Tobin Q. The link between governance and operating
performance is not as obvious as the link with the market performance. In the later case,
the stock price is determined by the marginal shareholder, who is likely to be a minority
shareholder and rely heavily on minority shareholder protection. Thus the stock price,
and hence the market capitalization, should directly reflect governance provisions that
protect minority shareholder rights.
In the case of operating performance, the link is not as obvious. However, as we
discussed above, better governance mechanisms may reduce the likelihood of inefficient
resource allocation (eg. lending to directed parties, consumption of perquisites, etc.) and
therefore increase operating efficiency. These gains should be reflected in better
operating performance.
The rest of the paper is organized as follows: Section 1 describes our data, Section 2
presents our results, Section 3 lists a number of caveats and Section 4 concludes.
1. Data
1.1. Corporate Governance Data
We use two proprietary surveys completed by the International Finance Corporation,
IFC, of 50 banks in Ukraine surveyed in 2004, and 107 banks in Russia (50 surveyed in
2003 and 81 in 2006).
1
The surveys are described and the data analyzed in detail in the
original publications by IFC (see IFC 2004a, 2004b, 2007). For Russia our sample of 81
banks surveyed in 2006 represents 7% of all registered banks and 20% of total assets in
the banking sector as of September 2006 (IFC, 2007). For Ukraine, our sample of 50
banks represents 32% of all banks, 41% of total capital and 45% of total assets in the
banking sector of Ukraine as of April 2004 (see IFC, 2004b).
1
We found that 24 banks were present in both waves of the survey in Russia.
7
The surveys contain very detailed questions about the bank’s corporate governance
practices. In selecting questions we relied on the OECD corporate governance principles
and commonly known best practices to choose the questions most relevant and least
ambiguous with the direction of their effect on corporate governance. We selected
questions for which there was some variation in our sample (specifically, we did not
include questions for which over 90% of the banks answer in the same way).
2
Finally, we
limited our list to questions that were present in both waves of the survey in Russia,
which allows us to compare the evolution of governance in Russia over time. Fortunately,
most of the questions we selected for Russia, with the exception of 3 questions, were also
available in the survey in Ukraine.
Our final list contains 26 questions broken down into 5 general categories:
I. Commitment to Corporate Governance
II. Shareholder Rights
III. Supervisory Bodies
IV. Audit
V. Transparency and Disclosure
The exact questions for each of these categories are given in Table 1. The variables are
coded as dummies, where one indicates better governance. For each of the 5 categories,
we created one index that is a sum of questions in each category. The overall index of
corporate governance is a sum of all 26 questions. For ease of inference we standardized
our governance index to have zero mean and standard deviation of one for use in
regressions.
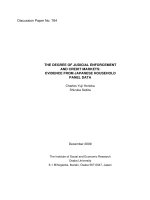
Figure 2 presents histograms for our corporate governance indices in Russia and Ukraine.
The distributions seem fairly “normal” with wide variation within each country and no
visible outliers. In both countries the minimum value is about 6.5; the maximum is 15.5
in Ukraine and 19 in Russia (this difference is due to 3 fewer questions available in
2
For example all banks conduct the annual general meeting of the shareholders and almost all banks
provide information about the agenda of the meeting, annual reports and the time and location of the
meeting prior to the AGM (because these are required by law)
8
Ukrainian survey). Looking at individual governance categories, presented in Table 1,
Russian Banks score higher than Ukrainian for most of the individual questions in all
categories except the audit (in which it is about the same). It appears that corporate
governance is somewhat better in Russian Banks than it is in Ukrainian Banks.
1.2. Ownership variables
As the main measure of ownership concentration we use the natural logarithm of the
number of shareholders. We also create an estimated Herfindahl index of ownership
concentration, using the information on percent ownership held in different ownership
categories.
3
In addition, we create two dummy variables – Small owners, equal to one if there are any
owners with less than 15% shares and Large owners, equal to one if there are any owners
with more than 15% ownership share. Clearly, they both cannot be equal to zero (a bank
must have either small or large shareholder). In our sample about 70% of banks in both
countries have both – large and small shareholders and the rest of banks have either only
large shareholders (16% of the sample in Ukraine and about 9% in Russia) or only small
shareholders (16% in Ukraine and 21%in Russia).
4
Ownership concentration is very similar in both countries, and it’s marginally more
concentrated in Ukraine – the average number of shareholders is 50 in Russia and 47 in
Ukraine, the average Herfindahl index is 0.32 in Russia and 0.28 in Ukraine.
3
The survey included information on 8 ownership categories: 75-100, 50-74.0, 25-49.9, 15-24.9, 10-14.9,
5-9.9, 2-4.9 and less than 2. We assumed that everyone in each ownership category had the similar stakes.
4
The 15% cutoff point was empirically chosen. In the first round of regressions we used a number of
dummies for each of the ownership categories listed in footnote 3. We found that three “small shareholder”
dummies – those with less than 2% and those between 2% and 15% stakes behaved similarly in regressions
and had coefficients not significantly different from each other. We observed similar patterns for dummies
for “large owners” groups. Therefore we decided to combine them into two broader groups to save on
degrees of freedom.
9
Despite such high measures of concentration, our measures are likely to underestimate
true ownership concentration because in most cases the ultimate owners are unknown.
5
1.3. Financial Variables
We collected financial data for Russia from the financial information agency Mobile. The
data are available quarterly since 2002 and the latest data point is October 2006.
6
Mobile
collects the data from financial reports submitted to the Central Bank of Russia. We
collected financial data for Ukraine from the NBU – National Bank of Ukraine - website.
The data are available annually, for 2003-2006. Note that since early 2004 both Russia
and Ukraine banks are required to report their financial results following the IAS –
International Accounting Standards.
We constructed a number of traditional performance variables and additional control
variables available in our data. They are described in Table 2.
7
To eliminate influential observations, we removed extreme values outside of 1% and
99% range (for variables bounded by zero we only eliminated top 1% of observations).
We made an exception for growth rates (of assets and capital) as those distributions
appeared to have more influential observations and eliminated 5% on each side for these
two variables.
1.4. Control variables
5
Unfortunately, the survey question about the number of shareholder in each of the ownership category did
not specify whether the question referred to ultimate owners or to immediate owners. But even if it did, it’s
unlikely that such information would be disclosed as such information is very hard to come by in Russia
and Ukraine.
6
When using 2006 data we adjusted the flow variables, like sales, income, expenses, etc. by multiplying by
4/3 to annualize the data which are reported for the 3 quarters of the year.
7
We have also experimented with the Profit Efficiency Rank, constructed following the methodology of
Berger and Mester (1997) and Berger et al.(2005). These estimates were only available for Russia, as in
Ukraine we did not have enough data for input choices to estimate the production function. The relationship
of the PER and governance was not significant.
10
From the corporate governance survey we selected several additional variables that may
capture the differences in governance and performance. We control for state ownership
(as an indicator variable) in the Russian sample because state ownership plays a
prominent role in the Russian Banking sector. In our sample 34% of all banks have at
least some state ownership. There are no banks with government ownership in our
Ukrainian sample.
We also control for foreign ownership, as foreign owners may instill better governance
norms and also have more efficient operations and performance. Foreign ownership is
rapidly growing in both countries. While in our Russia sample foreign owned banks
represent 13% of the sample (note that this is across two rounds of the survey), in
Ukraine in 2004 only 6% of our sample banks have any foreign owners (see Table 2).
Since 2004 the proportion of foreign ownership has grown to about 25% of total banking
sector in Ukraine.
Bank size may be another important element of performance as banks may enjoy
economies of scale in both – adoption of corporate governance norms and financial
operations. We measure size with the (logarithm) of total assets. Finally, we control for
geographic location of the bank with the “Central Region” dummy, which includes
Moscow in Russia and Kiev in Ukraine.
1.5. Descriptive Statistics
Table 3 reports descriptive statistics on financial performance measures and control
variables for Russia (Panel A) and Ukraine (panel B). This table reports financial ratios
for the years 2003-2006, all years that are used in the analysis, even though different
regressions will include different years (as described in the next section).
We observe that Banks in our sample are somewhat higher performing in Russia, than in
Ukraine – the average/median ROA is 2.4%/2% in Russia and 1.5%/1.1% in Ukraine.
Similarly ROE and NII (net interest income) are slightly higher in Russia. On the other
11
side, the capital ratios appear to be higher in Ukraine – the average is 0.2 vs. 0.16 in
Russia. The growth rates are slightly higher in Ukraine.
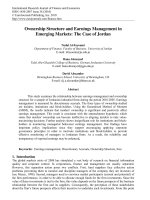
Figure 3 presents simple scatter plots of the governance index and the number of
shareholders, with a fitted bi-variate regression line. In both countries there is a visible
positive relationship, which is somewhat stronger in Ukraine.
Table 4 presents correlations between corporate governance index and other ownership
variables (Panel A for Russia and B for Ukraine). Correlations with ownership confirm
the positive relationship between ownership and number of shareholders and negative
relationship with the Herfindahl index of ownership concentration (which is inversely
related to the number of shareholders).
Interestingly, we find that in Ukraine banks with small owners have better governance
than banks without small owners (while the Large owners dummy is not significant). In
Russia the banks with large owners do worse than banks without the large owners (while
the small owners dummy is not significant). In both countries higher ownership
concentration is negatively related to governance, but it is driven by somewhat different
categories of bank owners – small ones in Ukraine and large ones in Russia.
Table 4 also presents the correlations between corporate governance and financial
performance variables (panel C for Russia and D for Ukraine). The correlations between
governance and performance variables are low and mostly insignificant. In Russia ROA
and ROE are significantly positively correlated with governance, while reserves are
negatively correlated. In Ukraine the only significant correlation is with net interest
income.
2. Regression Results
2.1. Determinants of Corporate Governance
12
We start with analysis of our corporate governance index in Table 5. Panel A reports
results for the Russian sample and Panel B for Ukrainian sample. We find that in both
countries ownership concentration is significantly related to governance. Our preferred
measure of ownership concentration is (log of) the number of shareholders. We also use
the Herfindahl index of ownership concentration (which is inversely related to the
number of shareholders) and two dummies – small owner dummy and large owner
dummy.
8
In both countries number of shareholders is positively related to governance
index, but in Ukraine the relationship is more significant and is almost three times larger
in magnitude. Similarly for the Herfindahl index we find that it’s negatively related to
governance and, again, the significance and magnitude are stronger in Ukraine. For the
large and small owner dummies we find some differences: in Russia we find that banks
with large owner do worse than banks without large ownership, and in Ukraine we find
that banks with small owners do better than banks without small ownership. However the
cumulative effect is the same in both countries (i.e. less concentration is linked to better
governance).
We also find that in Russia governance has improved over the past 3 years – the dummy
for year 2006 is significant and large – the governance has improved by 0.6 of one
standard deviation. (Note that the governance index is standardized to have mean zero
and standard deviation of one). This is consistent with the conclusion made in the IFC
report that compared detailed survey responses for two years (see IFC, 2007).
Only in Ukraine we find some evidence that prior performance (i.e. a year before the
governance is measured) is positively linked with subsequent governance. However, it’s
only significant for ROA (at 5%), while for ROE the significance level is within 15%. In
Russia the coefficients are positive, but not significant.
8
We have also experimented with different ownership dummies, including a dummy for major shareholder
(i.e. an owner with over 50% stake), large block-holders (shares between 15-50%), small block-holders
(shares between 2-15%) and minority shareholders (shares under 2%). We found that large block-holder
dummy was insignificantly different from major shareholder dummy (and both are now included in the
large owner dummy) and that small block-holder was insignificantly different form minority shareholder
dummy (both are now included in the small owner dummy).
13
Surprisingly, there are no other significant relationships that would predict the index of
corporate governance. Neither foreign nor state ownership dummies are significant. Also
non-significant are the dummies for central region, the capital adequacy ratios and
proportion of loans in bank’s assets.
The only robust finding so far is that banks with more concentrated ownership have lower
rankings on corporate governance. However, without time series data we are not able to
establish whether this relationship is due to the fact that banks with better corporate
governance are able to attract more minority shareholders, or whether banks with more
minority shareholders are more likely to adopt better governance practices to satisfy
minority shareholders’ demands. This is an important question to address in subsequent
research.
2.2. Corporate Governance and Contemporaneous Performance
In this section we put aside the issues of endogeneity for a moment and explore
contemporaneous relationship between governance and performance. We revisit the
endogeneity issue in the next section. We report all our main results using the aggregate
corporate governance index. The results on subindicies were mostly insignificant, and so
we do not report them in the paper (they are available on request).
The results are reported in Table 6. Panel A reports results for Russia and Panel B for
Ukraine. In both countries we find a relatively weak relationship between governance and
ROA – it’s significant only at 10% in both countries (despite the fact that Russian sample
is over twice the size of Ukrainian sample), while the relationship with ROE is only
significant (at 5%) for Ukraine and is not significant in Russia in our full specification.
9
The economic magnitude of the relationship is small in both countries. For example, one
standard deviation increase in corporate governance index results in about 0.3%-0.4%
9
The ROE is significant at 5% in Russia if we only include size and year dummy as controls and no other
control variables are included. Excluding controls for the own capital and proportion of loans does not
significantly affect our results.
14
increase in ROA, which is around 20% of one standard deviation in ROA. The magnitude
is slightly higher for ROE (significant for Ukraine only), but even then one standard
deviation change in governance results in about one-third of one standard deviation
change in ROE.
We also find the net interest income to be significantly related to governance in Ukraine
but not in Russia. In Ukraine better governance results in higher interest income and
lower (but not significantly lower) interest expense, with the net effect of significant
relationship to net interest income. This is in line with the argument that better
governance systems allow banks to cut the expenses and gain from higher interest rates
on loans. The later could be due to reduction in loans to related parties with favorable
interest rates (and hence the average interest on loans is higher). However, in Russia both
– interest expense and interest income (the later is significant only at about 11%) rise as a
function of governance index, with no net effect on the net interest income.
In Russia we also find that better governance results in lower NPL – non-performing
loans. This could be because better governance results in less related parties transactions
or better credit evaluation. As a result of lower NPL, reserves are also slightly lower in
Russia (although not significant at conventional levels
10
). There is no NPL data for
Ukraine and reserves are not significant in Ukraine sample. We don’t find any
relationship between governance and the growth rates of assets or capital in either
country.
Considering numerous control variables we find that in Ukraine larger banks on average
have higher performance, which is not consistently true for Russia. We also find that
banks with larger number of shareholders (less concentrated ownership) under-perform
those with more ownership concentration in Ukraine (again, this is not true in Russia).
10
We found reserves to be slightly more significant (at around 10%) in some other specifications with
some of our controls excluded or with added control for listed on stock exchange or plans to list.
15
In Year 2006, relative to 2003 we find that Russian banks report higher levels of NPL
and lower net interest income. This maybe a note of concern to policymakers.
2.3. Corporate Governance and Subsequent Performance
As noted earlier, corporate governance maybe endogenous to performance. Because
corporate governance is a choice variable, better performing banks may choose to adopt
stricter corporate governance mechanisms, perhaps as a way of signaling their higher
performance potential. Therefore, the contemporaneous relationship between governance
and performance is likely to be biased. The bias, however, is more likely to be upward
because of the positive reverse causality between performance and governance. So the
consistent estimates, if we were able to obtain them, are likely to be weaker than those we
described in the previous section.
In this section we explore the relationship between governance and subsequent
performance. We use financial performance data in the year following the governance
measurement, which reduces the endogeneity problem. Table 7 reports the results for
Russia, in Panel A and Ukraine in Panel. B. Note that because the second wave of
Russian governance data is completed at the end of 2006 and the latest financial data for
Russia are of the end of 2006, in this section we can only use the first wave of Russian
governance data.
We find no significant relationship between governance and subsequent performance in
Russia. If anything, the relationship with the ROA and ROE is negative (but not
significant).
In Ukraine we find a weak relationship with ROA (only significant at about 11%) and
somewhat stronger relationship with ROE (significant at 5%). The coefficient on
governance in the net interest income regression is also positive, but only “near-
significant” at about 15%. Surprisingly the growth in capital is negative, which is
counter-intuitive.
16
3. Caveats
The overall findings so far suggest that the relationship between governance and
performance is relatively weak and small in magnitude. There are a number of caveats
one should consider before making definite conclusions from this research.
First, the financial data maybe unreliable. In the environment of weak bank supervision
in Russia and Ukraine, the financial data reported by Banks to the supervisory agency are
likely to be noisy at best and unreliable at worst. In addition, the practice of financial
reporting using International Accountings Standards is relatively new in both countries,
which may exacerbate the concerns over the data quality. However, the financial data we
use in this paper have been used in a number of other related papers with sensible results
(for example, Karas, Pyle and Koen (2006), Golovan et al.( 2007)). This caveat is not
limited to this particular study on Russia and Ukraine, but extends to any empirical work
on emerging markets of which there are too many to name.
Second, the governance data maybe unreliable. It’s plausible that the survey respondents
did not answer the surveys truthfully. Their incentives in answering the surveys are
unclear, especially because IFC offers corporate governance educational and consulting
services to the banks in the survey. However, it is not obvious, apriori, if this potential for
a future relationship with IFC would lead banks to overstate their governance (to make it
look better) or to understate it (with hopes that it may generate some additional assistance
from IFC
11
).
Third, the variation in our corporate governance index might be insufficient to pick up
much effect because the banks in our sample range from “bad” to “less bad” rather than
from “bad” to “good.” The IFC concluded that while the governance is improving, it was
still far from perfect in 2006 survey (see IFC, 2007).
11
Even though the banks who receive assistance from IFC had to pay for it, apriori the possibility of such
assistance may affect the incentives in providing the survey results.
17
Fourth, the questions contained in the IFC survey that were available to us may not
capture the particular elements of governance that really matter for performance in these
countries. It’s hard to know what these “important elements” are without additional data.
Vernikov (2007) argues that “alien concepts of corporate governance make it into formal
norms and are subsequently complied with or imitated by market participants, but have
limited impact on the structure and control…” He further argues that in Russia, the
transplanted system of laws and corporate governance norms is picked from all over the
world and is not cohesive. It is plausible that the indicators of good governance that are
important in the Anglo-American type of corporations are not all that important in the
Russian and Ukrainian business world.
Finally, our samples are small and perhaps insufficient to generate strong statistical
significance. The small sample issue has less implication for the low magnitudes of the
effect observed as it’s mainly an issue with the lack of statistical significance.
4. Conclusion
This paper presents evidence on the relationship between ownership, corporate
governance and operating performance in banks using a sample of 50 banks in
Ukraine surveyed in 2004 and 107 banks in Russia surveyed in 2003 and 2006. We
find some significant, but economically unimportant relationship between
governance and contemporaneous operating performance and an even weaker link
with the subsequent performance. We conclude that aside from the popularity of the
governance in public discussion, corporate governance has at best a second-order
effect on operating performance in Russian and Ukrainian banks. We also find that
in both countries banks with more concentrated ownership have lower rankings on
corporate governance.
Despite the potential limitations of this study described in the paper, this exercise is the
first one, to our knowledge, of relating a broad index of corporate governance to
18
performance in banking institutions. If it stimulates the additional research on the topic,
part of our objective would be complete.
Finally, in this paper we explore only one dimension of the bank performance,
specifically the operating financial performance imperfectly captured by our measures of
ROE, ROA, net interest income, etc. However, corporate governance is most likely to
play an important role in the issue of bank stability and bank’s ability to provide liquidity
in difficult market conditions. The impact on stability may turn out to be the most
important benefit of good corporate governance for Russia and Ukraine, and emerging
markets in general. This would be an important question to address in further research.
19
References
Berger, A.N. and Mester, L.J., 1997, Inside the black box: What explains differences in
the efficiencies of Financial Institutions?, Journal of Banking and Finance 21, 895-947.
Berger, A.N., G. Clarke, R. Cull, L, Klapper and G.F. Udell, 2005, Corporate
Governance and Bank performance: A joint analysis of the static, selection, and dynamic
effects of domestic, foreign and state ownership, Journal of Banking and Finance 29,
2179-2221.
Black, B., I. Love and A. Rachinsky, 2006, Corporate Governance Indices and Firms'
Market Values: Time Series Evidence from Russia, Emerging Markets Review, vol. 7 No.
4, pp.361-379.
Clarke G., R. Cull, and M.M. Shirley, 2005, Bank Privatization in Developing Countries:
A Summary of Lessons and Findings, Journal of Banking and Finance 29, 1905-1930.
Clarke G., R. Cull, M.S. Martinez Peria, S. Sanchez, 2003, Foreign Bank Entry:
Experience, Implications for Developing Economies, and Agenda for Further Research,
The World Bank Research Observer, vol. 18, no. 1, pp.25-59.
Durnev, A. and E. H. Kim (2005), “To Steal or Not to Steal: Firm Attributes, Legal
Environment, and Valuation,” Journal of Finance Vol. 60, pp. 1461-1493.
Golovan’ S.B., O.U. Kosturina, E.B. Pastuxova, A.M. Karminskiy and A.A. Perceckiy,
2007, Cost Efficiency of Russian Banks, New Economic School, Working paper #71.
IFC, 2004a, A Survey of Corporate Governance Practices in the Russia Banking sector,
International Finance Corporation, Moscow (mimeo), www.ifc.org/rcgp
IFC, 2004b, A Survey of Corporate Governance Practices in the Ukrainian Banking
sector, International Finance Corporation, Kyiv (mimeo).
IFC, 2007, Russia Banking Sector Corporate Governacne Survey: A snapshot on
Improvements Made, International Finance Corporation, Moscow (mimeo),
www.ifc.org/rcgp
Karas, A., W. Pyle and K. Schoors, 2006, Sophisticated discipline in a nascent deposit
market: Evidence from post-communist Russia, BOFIT Discussion Papers #13, 2006.
Klapper, Leora F. and Inessa Love (2004), “Corporate Governance, Investor Protection,
and Performance in Emerging Markets,” Journal of Corporate Finance Vol.10, pp.287-
322.
Levine, R., 2004, The Corporate Governance of Banks: A Concise Discussion of
Concepts and Issues, The Certified Accountant, 18, April, 2004.
20
Levine, R., 2005, “Finance and Growth: Theory and Evidence.” in Handbook of
Economic Growth, Eds:Philippe Aghion and Steven Durlauf, The Netherlands: Elsevier
Science, 2005.
Macey, Jonathan R. and O'Hara, Maureen, 2003, "The Corporate Governance of Banks."
Economic Policy Review, Vol. 9, No. 1, April 2003. Available at SSRN:
Spong, Kenneth and Sullivan, Richard J., 2007, "Corporate Governance and Bank
Performance," Working paper, Federal Reserve Bank of Kansas.
Vernikov A., 2007, Corporate Governance and Control in Russian Banks, Working paper
WP1/2007/02, Moscow State University, Higher School of Economics.
21
Figure 1. Total Assets and Equity Growth in Ukraine and Russia in 2003-2006.
Total Assets and Equity growth in Russia
0
500
1,000
1,500
2,000
2,500
3,000
3,500
2003 2004 2005 2006
bln. RUB
0
100
200
300
400
500
bln. RUB
Total Assets Equity
Total Assets and Equity growth in Ukraine
0
20
40
60
80
100
120
140
2003 2004 2005 2006
bln. UAH
0
2
4
6
8
10
12
14
16
bln. UAH
Total Assets Equity
22
Figure 2. Distribution of Corporate Governance Index
Distribution of corporate governance index
(Russia)
0
2
4
6
8
10
12
6.
5
7.
5
8.5
9.
5
1
0
.5
1
1.5
1
2
.
5
13.5
1
4.5
1
5
.5
1
6
.5
1
7.5
19
Distribution of corporate governance index
(Ukraine)
0
2
4
6
8
10
12
14
16
6.5
7.5
8
8.5
9
9.5
10
10.5
11
11.5
12
12.5
13
13.5
14
15
15.5
23
Figure 3. Corporate Governance Index and the Number of Shareholders
Corporate governance index and the number of shareholders
(Russia)
-3
-2
-1
0
1
2
3
1 10 100 1000 10000 100000
Corporate governance index and the number of shareholders
(Ukraine)
-3
-2
-1
0
1
2
3
1 10 100 1000 10000 100000
24
Table 1. Corporate Governance Index
Elements of CGI
Average
Russia
Average
Ukraine
I. Commitment to
Corporate Governance
0.53 0.36
Code of corporate conduct 1 if bank has its own corporate governance
code, 0.5 if bank plans to develop it, 0
otherwise
0.56 0.43
Disclosure of corporate
governance practices
1 if bank periodically disclose to
stakeholders its corporate governance
practices and the extent to which they
conform with national or international best
practice, 0 otherwise
0.66 N/A
Corporate governance
committee or corporate
governance officer
1 if bank’s BoD have a Corporate
Governance Committee or a designated
Corporate Governance Officer in place, 0
otherwise.
0.31 0.14
Training 1 if bank provides training in corporate
governance issues to management or
members of BoD, 0 otherwise.
0.71 0.54
Independent register 1 independent register holds banks share
register, 0 otherwise.
0.40 0.32
II. Shareholders rights 0.70 0.61
Notification on shareholders
meeting
1 if announcement of AGM is sent to
shareholders by mail, 0 otherwise.
0.85 0.92
Additional information to
notice of AGM
1 if supporting documents to each agenda
item are provided before AGM, 0
otherwise.
0.80 0.66
Secret voting 1 if voting at the AGM is conducted by
ballot, 0 otherwise.
0.69 N/A
Notification on results of
AGM
1 if results of AGM are sent personally to
shareholders, 0 otherwise.
0.46 0.26
III. Supervisory bodies 0.60 0.51
Independent directors 1 if there are independent directors in BoD,
0 otherwise.
0.66 0.30
Minority representatives 1 if there are representatives of minority
shareholders in BoD, 0 otherwise.
0.53 0.44
Professional directors 1 if members of BoD are paid for their
duties, 0 otherwise.
0.60 0.24
Insider information 1 if responsibility concerning the
disclosure and use of confidential and
insider information for their personal or
third parties interests is specified, 0
otherwise.
0.70 0.26
Committees 1 if there are any committees within BoD,
0 otherwise.
0.32 0.28
25
Roles of supervisory bodies 1 if BoD defines mission and business
strategy while ExB participates in day-to-
day management of a bank, 0 otherwise.
0.38 0.96
Assessment of BoD 1 if there is assessment of members of BoD
performance, 0 otherwise.
0.72 0.72
Assessment of ExB 1 if there is assessment of members of ExB
performance, 0 otherwise.
0.90 0.88
IV. Audit 0.71 0.73
Internal audit 1 if there exists internal audit department, 0
otherwise.
0.89 0.92
Appointment of external
auditor
0 if external auditor is appointed by ExB, 1
otherwise.
0.84 0.82
Additional services
provided by external auditor
1 if external auditor does not provide
additional services, 0 otherwise.
0.40 0.44
V. Transparency and
Disclosure
0.56 0.26
Ownership of members of
BoD and ExB
1 if bank's annual report discloses
information on shares held by members of
BoD and ExB, 0 otherwise.
0.45 0.26
Remuneration of members
of BoD and ExB
1 if bank's annual report discloses
information on remuneration of members
of BoD and ExB, 0 otherwise.
0.35 0.00
Ultimate shareholders 1 if ultimate shareholders are known to
wide public, 0 otherwise.
0.60 0.34
Related party and large
transactions
1 if related party transactions and
transactions involving more then 10% of
the book value of the Bank’s assets are
disclosed, 0 otherwise.
0.42 0.42
Affiliated parties and
indirect shareholdings
0 if list of affiliated parties and indirect
shareholdings is not published, 1
otherwise.
0.80 N/A
Languages 0 if information provided to shareholders
and investors is in Russian only, 1
otherwise.
0.76 N/A