economic and health consequences of pesticide use in paddy production in the mekong delta, vietnam
Bạn đang xem bản rút gọn của tài liệu. Xem và tải ngay bản đầy đủ của tài liệu tại đây (454.7 KB, 39 trang )
Research Reports
Economic And Health Consequences Of
Pesticide Use In Paddy Production In The
Mekong Delta, Vietnam
by Nguyen Huu Dung And Tran Thi Thanh Dung
ABSTRACT
Paddy productivity and variable factors efficiency were calculated based on a farm survey.
Logit regression was employed to relate econometrically a set of farmer characteristics to
indicators of pesticide exposure to identify types of health impairments that may be
attributed to prolonged pesticide use. Then, the pesticides' negative effects on farmers'
health were estimated by means of dose-response function. The empirical results indicated
that the amount of pesticides applied was far higher than the optimal level for profit
maximization. Insecticides influenced negatively and significantly farmers' health via the
number of contacts rather than the total dose. Meanwhile, the higher the number of the
doses and the number of applications of herbicides and fungicides, the bigger the health
cost due to exposure. Since economic gains from input savings and a decrease in health
cost outweighed productivity losses, a tax of 33.4 percent of pesticide price was proposed.
1.0 INTRODUCTION
Paddy rice has long been the major food crop in Vietnam, covering around 65 percent of the cultivated
area. Most ecological regions manage to grow two to three croppings in a year. By far, the Mekong
Delta is the biggest cultivated region in Vietnam, accounting for more than 50 percent of paddy
produced in a year. Taking advantage of the changes in economic policy-orientation that took place in
the late 1980s, paddy production grew rapidly at an impressive rate of 5.1 percent between 1986 and
1995. The production growth in rice, the primary staple of the population, has been more than double
the population growth in 1995. This significant growth has helped to overcome the food crisis faced by
the country for more than two decades and generated rice surplus that enhanced export earnings.
However, with the widespread use of high yielding varieties (HYVs) since the late 1960s, farmers have
tended to increase input application over time to sustain yields under intensive cultivation systems. Thus,
while an increase in yields and production could be seen at the farm level, there may have been a
corresponding increase in other costs brought about by the greater dependence on chemical inputs,
5/15/03 12:32 PMEconomic And Health Consequences Of Pesticide Use In Paddy Production In The Mekong Delta, Vietnam
Page 1 of 39http://203.116.43.77/publications/research1/ACF124.html
namely: pesticides and inorganic fertilizers. In particular, the rapid increase in the use of pesticides has
posed threats to the environment such as adverse health effects on farmers and others exposed to
pesticides, and pollution of drinking water and aquaculture. Further expansion and intensification in rice
production, therefore, face the challenges of formulating and implementing an agricultural growth strategy
that is both economically and environmentally sustainable.
2.0 ENVIRONMENTAL PROBLEMS IN PADDY FARMING DUE TO PESTICIDES
Mekong Delta is located in the southern side of Vietnam (long. 8º60’N to 10ºN and lat. 104º50’E to
106º80‘E), traversing 12 provinces, namely: Longan, Tiengiang, Bentre, Vinhlong, Cantho, Travinh,
Dongthap, Angiang, Tiengiang, Soctrang, Baclieu, and Camau. At present, land for farming and
aquaculture is about 2.6 million ha, representing two-thirds of total area of 3.9 million ha (General
Statistical Office, 1995). Single and double rice croppings are dominant cropping systems in the
Mekong Delta, taking up 70 percent of the agricultural land. Some 20 percent are planted to upland
crops and perennials.
Under current production systems, while other pest management practices have been declining, chemical
pesticide use in paddy production has been steadily increasing in Vietnam. As reported by the Plant
Protection Department, pesticide use in rice accounted for 65.5 percent of total market value of
pesticides in 1996. Insecticide was the most (85%) widely used pesticide among rice growers in the
Mekong Delta. Fungicide use was relatively low, and only about 4 percent used herbicide (Heong et. al
1994). The high insecticide use in the Mekong Delta is closely in accordance with intensive cultivation;
most insecticides are sprayed at the initial stages of the rice growing season (Mai, 1995). The farmers’
management studies implemented by the National Institute for Agriculture Planning and Projection
(NIAPP) provided some evidence about the overuse of pesticides in Southern Vietnam (World Bank,
1995). This trend of pesticide overuse to control the brown plant hopper had been prevalent in the
Mekong Delta only. As a result, expenditures on pesticides of farmers in the Mekong Delta had been
significantly higher than in the Red River Delta in North Vietnam (Table 1). The frequency of application
was also greater in the Mekong Delta, although very high applications of pesticides could be seen in
most rice farming regions of the country. It was applied 5.3 times per season (World Bank, 1995). The
figure is rather high compared with that obtained from some study sites in the Philippines.
Table 1. Pesticide expenditures and application, 1990-1991.
Region / Country Expenditure (USD /
ha)
Number of applications
China 25.6 3.5
India 24.9 2.4
Philippines 26.1 2.0
Indonesia 7.7 2.2
Northern Vietnam 22.3 1.0
5/15/03 12:32 PMEconomic And Health Consequences Of Pesticide Use In Paddy Production In The Mekong Delta, Vietnam
Page 2 of 39http://203.116.43.77/publications/research1/ACF124.html
Southern Vietnam 39.3 5.3
Source: FAO, 1995
It was observed that farmers improperly applied hazardous pesticides in combination with other
chemicals. Improper use and handling of pesticides had also been reported in some recent studies. Their
dangerous effects on human health could already be found at the controlling level upon importation,
through the wholesale process, and at the farm level (FAO, 1995). Poisoning symptoms due to use and
unsafe handling of hazardous pesticides had been observed. The risk from pesticide exposures to
farmers’ health was expected to increase with applications because of fatal toxicity of chemical
pesticides. However, the number of poisoning symptoms would be greater since in most cases farmers
did not go to the hospital. On the other hand, local health officials did not often diagnose exactly
poisoning symptoms due to pesticide exposures. As such, estimating health costs from pesticide use such
as costs of treatment and opportunity cost of farmers’ time required to recuperate was essential to
consider the effect of pesticide on the environment. Health status of farmers and fish and shrimp
cultivators in the region had been badly affected by pesticide exposure and residues in the water.
However, these possible external costs of pesticide to the environment resulting from misuse of
production resources have not yet been considered in rice production in the Mekong Delta agriculture.
In the light of the adverse effects of pesticides, it is vital to know how current use of pesticide endangers
farmers’ health and labor productivity, or whether the marginal gain from reduced pesticide use
surpasses the marginal loss in rice productivity and farmers’ benefit. Such information would help in
developing policies in the direction of restricting pesticide use.
3.0 OBJECTIVES OF THE STUDY
This study investigated the impacts of pesticide exposure on rice farmers’ health in Mekong Delta,
Vietnam. The overall objectives were to examine pesticide productivity and estimate the optimal level for
profit maximization; determine types of health impairments caused in farmers by pesticide use, and
estimate the damage costs due to health impairment brought about by pesticide exposure. From these,
recommendations on regulation of pesticide use may be suggested to policymakers.
Some hypotheses in the domain of pesticide exposure and epidemiological issues would be specifically
examined and verified as follows: 1) Probabilities of health risk are related to farmers’ characteristics and
pesticide exposure; 2) Health costs from pesticide exposure substantially raise the cost of paddy
production; and 3) Alternative regulatory schemes that reduce pesticide application in rice production
would be able to improve social welfare via better health and profitability.
4.0 METHODOLOGY
4.1 Estimation Procedure
The empirical analyses of this study relied on three procedures. Initially, production elasticity and optimal
level of pesticides were derived from the yield function model. Then, Logit regressions were done to
relate the positive incidence of health ailments to pesticide exposure (Health Risk Logit Regression
5/15/03 12:32 PMEconomic And Health Consequences Of Pesticide Use In Paddy Production In The Mekong Delta, Vietnam
Page 3 of 39http://203.116.43.77/publications/research1/ACF124.html
Model). Next, to quantify the health impairment of farmers with respect to personal characteristics of
farmers and their use of pesticides, two sets of dose - response functions were constructed: one using
the survey data and the other using coefficients adjusted and transferred from the Philippines (Health
Cost Model)
4.2 Pesticide Productivity and Optimal Level for Profit Maximization
4.2.1 Rice yield function
The Cobb-Douglas function was used to relate material inputs to rice yield in the Mekong Delta in order
to examine pesticide productivity. This function in Log-linear form is expressed as follows:
LnY = Ln 0 + 1 Soil + 2 Mefarm + 3 Lafarm + 4EDU2 + 5EDU3 +
1LnNPK + 2LnTodose + 3LnHirLab + 4LnFarlab
αα α α ααβ
βββ
where:
LnY = natural logarithm of yield (ton/ha)
LnNPK = natural logarithm of total nitrogen, phosphorus, and potassium
fertilizers (kg/ha)
LnTodose = natural logarithm total dosage of all pesticides used (gram a.i./ha)
LnHirlab = natural logarithm of hired labor (mandays/ha)
LnFarlab = natural logarithm of family labor (mandays/ha)
Mefarm = 1 if medium farm ( 5-10 acres) = 0 if otherwise
Lafarm = 1 if big farm (>10 acres) = 0 if otherwise
Soil = 1 if soil class is category 1 = 0 if otherwise
EDU2 = 1 if farmers get secondary school level = 0 if otherwise
EDU3 = 1 if farmers get high school and upper level = 0 if otherwise
4.2.2 Optimal level of pesticide for profit maximization
To determine the optimal amount of pesticides used, under the assumption of profit maximization
behavior, the following relationship was derived:
The marginal physical product (MPP) of pesticides was equated to the ratio of the pesticide and paddy
price, that is: MPP = dY/dTodose = Pp/Py.
Thus MPP = 2 (Y/Todose) = Pp/Py. The optimal amount of pesticides, then, will be:β
Todose* = ( 2 .Y. Py) / Ppβ
where:
β2 = production elasticity of pesticides
MPP = marginal physical product of pesticides
Pp = the unit price of pesticides (VND/gram a.i.)
Py = the farm gate price of the paddy (VND/kg)
4.3 Health Risk Logit Regression Model (Health Risk Model)
5/15/03 12:32 PMEconomic And Health Consequences Of Pesticide Use In Paddy Production In The Mekong Delta, Vietnam
Page 4 of 39http://203.116.43.77/publications/research1/ACF124.html
A Logit model was used to relate econometrically a set of medical risk indicators to a set of farmer
characteristics and to estimate probabilities of health risk due to pesticide exposure. The overall
mathematical expression can be presented as:
Ln Odds ( ) (Specific, multiple health impairments) = + 1 (Pesticide exposure)
+ 2 (Farmers’ characteristics)
αβ
β
: is the probability of having a specific health impairment and 1- is the
probability of not having a specific health impairment. To know the probability of a farmer
in the survey area suffering from a specific health impairment, the following formula was
employed:
where Pi Pi
= Exp. ( + iXi) / 1+ Exp. ( + iXi)Pi αβ αβ
The dependent variable was considered as a discrete dependent variable, and the symptoms and
epidemiological data were collected to construct this variable.
The independent variables in the model were defined as follows:
Variables and Notation Definition
AGE (sample farmer’s age) Years since birth
EDU (farmer’ s education) Years of formal education
HEALTH (a proxy for health and
nutrition)
Farmer’s weight (kg) by height
(meter)
SMOKE (active smokers) = 1 if smoking regularly; = 0
otherwise
DRINK (alcohol drinking habit) =1 if drinking regularly; = 0
otherwise
TOCA1 (total dose of categories I & II) Gram a.i. per hectare
TOCA3 (total dose of categories III &
IV)
Gram a.i. per hectare
TODOSE (total dose of pesticides) Gram a.i. per hectare
4.4 Health Cost Model
Health costs of farmers from pesticide exposure were linked with total pesticide dose, pesticide
exposure (the number of times the farmer gets in touch with pesticides), pesticide hazard categories, and
"other" personal characteristics. Based on the environmental economics literature on health production
5/15/03 12:32 PMEconomic And Health Consequences Of Pesticide Use In Paddy Production In The Mekong Delta, Vietnam
Page 5 of 39http://203.116.43.77/publications/research1/ACF124.html
function, the following log - linear regression model was assumed in the estimation:
LnHC = f (LnAGE, HEALTH, SMOKE, DRINK, LTODOSE, LINDOSE, LHEDOSE,
NA, NA1, NA3, TOCA1, TOCA3, IPM, CLINIC)
In which:
LnHC = Log of health costs of farmers
LnAGE = Log of farmers’ age
HEALTH = Farmers’ weight by height
SMOKE = Dummy for smoking (0 for nonsmokers, and 1 for smokers)
DRINK = Dummy for drinking alcohol (0 for nondrinkers & 1 for drinkers)
IPM = Dummy for IPM adopter (0 for non-IPM farmers & 1 for IPM
farmers)
LTODOSE = Log of total dosage of all pesticides used (gram a.i./ha)
LINSECT = Log of insecticide dose used (gram a.i./ha)
LHERB = Log of herbicide dose used (gram a.i./ha)
LFUNG = Log of fungicide dose used (gram a.i./ha)
TOCA1 = Total dose of categories I & II (gram a.i./ha)
TOCA3 = Total dose of categories III & IV (gram a.i./ha)
NA = Log of number of applications of pesticides/ season
NA1 = Number of times in contacting with TOCA1/ season
NA3 = Number of times in contacting with TOCA3/ season
CLINIC = Dummy for those who had hospital access 0 for those without
hospital access)
Health cost components. In this study, the total cost (in VND) incurred by farmers due
to pesticide induced illness was calculated based on the following kinds of costs:
opportunity costs of work loss days (assumed to be equal to wage multiplied by the
number of days off) and restricted activity days; costs of recuperation (meals, medicines,
doctors or hospitals) which were obtained through direct interview with sprayers; and costs
of protecting equipment.
Actual health cost incurred in a single season only and health costs during the last four
years (1992-1996) were used in alternative estimation models. The estimated health cost
for the population was weighted by percentage of farmers going to the clinic.
The average medical treatment cost was then added to the estimated heath cost for the
ones who did not go to the clinic to get the final estimated health cost of farmers due to
pesticide exposure. (The average medical treatment cost is given in the appendix.)
The total number of times of getting in touch with TOCA1 and TOCA3 was a bit
different from the number of applications of pesticides. This was because NA1 and NA3
were defined as the number of times that farmers had contact with a certain kind of
pesticide and, therefore, each farmer could be exposed to more than one type of pesticide
during one application. This means that the sum of NA1 and NA3 would be at least equal
to or larger than the number of applications. This separation was expected to more
explicitly reflect the impact of pesticide on farmers’ health impairments.
5/15/03 12:32 PMEconomic And Health Consequences Of Pesticide Use In Paddy Production In The Mekong Delta, Vietnam
Page 6 of 39http://203.116.43.77/publications/research1/ACF124.html
Coefficients of the health cost function from the Philippines were used to estimate the
health cost to farmers in the Mekong Delta and to compare them with current results.
Production data and other information on Mekong Delta farmers were used in the
transferred model.
4.5 Data Set and Method of Collection
4.5.1 Site selection
A field survey was undertaken by interviewing a sample of individual farmers from six sub-districts in
four provinces of the Mekong Delta, including Tien Giang (Nhi My, Cai Lay dist.), Dong Thap (Tan Phu
Trung, Chau Thanh dist.), An Giang (Vinh My, Chau Doc dist.; Long Dien B, Cho Moi dist.), and Can
Tho (Thanh Xuan, Dong Phuoc, Chau Thanh dist.). These six sites were selected based on various
levels of intensive paddy cultivation and pesticide application. In addition, farmers in these study sites
were those interviewed in the 1992 dry season for the study on economics of rice production. This
enabled the researchers to examine whether the relationship between pesticides and health cost existed
in the area. The random sampling method was used to choose farmers for personal interviews at each
study site. A total of 180 farmers were interviewed in these six villages (30 farmers for each site). The
survey, begun in January 1997 and completed in April 1997, was done in cooperation with officials from
the local Extension Centers and Plant Protection Sub-Departments in the Mekong Delta provinces.
4.5.2 Data
Data necessary for this study were mainly derived from two sources: (1) farm household survey in the
Mekong Delta and (2) pesticide dose-response functions in relevant countries (i.e., the Philippines). All
data were collected and recorded according to a formatted questionnaire which contained the following
information: farm inputs and prices; pesticide exposure; farmers’ and family characteristics and other
variables affecting health; symptoms due to prolonged exposure to pesticides; medical history and
expenditures incurred in treating the illness of farmers particularly focused on health impacts caused by
pesticide use; farmer’s awareness of the change in health conditions due to greater or prolonged
pesticide use; farm outputs and prices; and income from the farm and other sources.
Data on production and health problems were recorded by farmers during the 1996/97 winter-spring
season with the help of local agricultural officers. Final checking of data was done at the study sites by a
research team from the Environmental Economics Unit (EEU), Department of Economics, Vietnam
National University at Ho Chi Minh City. Production data in the 1992/93 winter-spring rice season of
sample farmers were used for comparison and as references.
5.0 PESTICCIDE REGULATION POLICY IN VIETNAM
5.1 Pesticide Regulation Policy
The Plant Protection Department is the authorized agency that designates pesticide application in
Vietnam agriculture. The Department has offices at all provinces and districts, establishing a complete
national network. It has contributed greatly to agricultural production through its successful operations,
especially in the Mekong Delta. Since 1993, many new regulations on plant protection and pesticide use
were enacted and actively undertaken throughout the country, including the following:
5/15/03 12:32 PMEconomic And Health Consequences Of Pesticide Use In Paddy Production In The Mekong Delta, Vietnam
Page 7 of 39http://203.116.43.77/publications/research1/ACF124.html
a. The decree on plant protection and quarantine was promulgated by the National Assembly on
February 15, 1993. This decree aims to improve the efficiency of State management in terms of
increasing the effectiveness of shielding resources, contributing to better production and to the
protection of public health and environment. In terms of plant protection chemicals, some
significant points include:
The manufacturing, export, import, storage reservation, distribution, and use of all plant
protection chemicals will undergo the State's unified management in accordance with
regulations. The Government stipulates the build-up, management, and use of a reserve
fund for plant protection chemicals at all levels.
The Ministry of Agriculture and Rural Development defines and announces the list of
pesticides permitted, restricted, and banned from use as well as promulgates the testing of
pesticides in the list in each period. Transport and application of plant protection chemicals
not in the list are strictly prohibited as well as production and sale of fake and expired
chemicals, chemicals of unknown origin and without trade-mark, or chemicals with
specifications and qualities inappropriate to registered trade-mark or patents.
Any organization/individual with complete requirements for plant protection and quarantine
and other conditions as given in the regulations, which has been granted a license by
government authorities, will be allowed to produce, export, import, and distribute plant
protection chemicals.
Safety to the people and the environment during production, storage, and transportation of
plant protection chemicals must be ensured.
a. Ordinances on plant protection, plant quarantine, and pesticide management were enacted on
November 27, 1993 based on the decree dated February 15, 1993. For pesticide management,
the ordinances covered the issues related with pesticide manufacturing, formulation, export,
import, allocation, usage, inspection, and testing at the reserve fund for plant protection chemicals.
b. Pesticide registration: the aim of pesticide registration is to ensure the technical efficiency, safety to
human beings and environment, and other requirements of the regulation policy. The legislative
structure of pesticide registration in Vietnam contains the decree, ordinances and decisions above.
The Pesticide Control Center was set up in 1994 to implement the State's functions regarding the
management of pesticide for quality, residues on agricultural and forestry products, and testing of
new pesticides.
c. The detailed regulations on plant protection and pesticide were published by the Ministry of
Agriculture and Rural Development in 1995. Effective 1994/95, most Plant Protection Sub-
Departments (PPSD) were no longer responsible for pesticide sales and distribution.
d. The Ministry of Agriculture and Rural Development announced on May 22, 1996 the list of plant
protection chemicals allowed, limited, or prohibited from being used.
e. Investment in pest management and production of pesticides: the State encourages domestic and
foreign organizations and individuals to invest in many forms of prevention and control of pests as
well as to produce plant protection chemicals in Vietnam (extracted from chapter I about general
regulations). However, in 1996, MARD recommended that licenses be no longer issued to
companies that are either joint ventures or with 100% foreign capital to build factories producing
plant protection chemicals.
5.2 Vietnam IPM Program
5/15/03 12:32 PMEconomic And Health Consequences Of Pesticide Use In Paddy Production In The Mekong Delta, Vietnam
Page 8 of 39http://203.116.43.77/publications/research1/ACF124.html
Vietnam has adopted Integrated Pest Management in rice as an approach to plant protection. This
program is still continuing and has helped increased agricultural productivity.
The practice of rice IPM in Vietnam began when Vietnam became a participant in the FAO inter-
country rice IPM program in March 1989. It was only in April 1992, however, that Vietnam officially
took part in the IPM network. In 1994, a national IPM program for rice was instituted to strengthen the
country's capacity to provide more efficient service to rice farmers. At the same time, the IPM network
coordinated by the International Rice Research Institute contributed to the Farmer Participatory
Research approach so as to directly transfer IPM program to rice farmers (Mai, 1994). The main
objective of the program was to increase small-scale farmers’ knowledge and help them make better
decisions in the pest control of rice production systems.
The IPM program in Vietnam had two training courses: Training of Trainers and Farmers' Field Schools.
Other approaches to transfer this technology included plant protection games, IPM seminar, radio, and
television which had less significant impact and needs to be adapted and evaluated.
More than 1,350 IPM trainers had undergone Training of Trainers. After this training, this group of IPM
trainers conducted Farmers' Field Schools (FFS) in all 53 provinces of Vietnam. Over 7,000 FFSs (25-
30 participants for each one) had been organized in 3,000 villages in Vietnam. The IPM trainers served
as resource persons for other farmers in their villages. As a result of the FFS and the data from the
surveys of farmers’ practices in their own fields, farmers participating in the IPM program reduced their
pesticide use by approximately 75 percent on the average. They were able also to save on the amount of
fertilizers and seeds they used, hence, lowering production costs. More importantly, the IPM farmers
gained similar or higher yields than non-IPM farmers.
6.0 PESTICIDE USE IN RICE FARMING
6.1 Types of Pesticides Used by Mekong Delta Rice Farmers
The type and amount of pesticides used in rice crops depended on the pest population and their
potential damages to the crop as well as farmers’ perception regarding pest management practices. The
survey in the 1996/97 Winter-Spring season showed that farmers used 17, 30, and 28, of herbicides,
insecticides, and fungicides, respectively (Tables 2, 3, and 4).
Table 2. Types of herbicides used in the Mekong Delta, classified using the WHO category.
Category Common Name Trade Name
II Paraquat Gramoxone 20 SL
III Butachlor + Propanil Cantanil 550 EC
III 2.4 D Anco 720 EC
III 2.4 D OK 720 EC
III 2.4 D 2,4 D 720 EC
5/15/03 12:32 PMEconomic And Health Consequences Of Pesticide Use In Paddy Production In The Mekong Delta, Vietnam
Page 9 of 39http://203.116.43.77/publications/research1/ACF124.html
III MCPA + Fenxaprop-P-ethyl + 2.4 D Tiller 50 EC
III Propanil Wham 80 DF
III 2.4 D Vi 2,4 D 80 WP
IV Metsulfuron Methyl Ally 20 DF
IV Butachlor Batoxim 60 EC
IV Butachlor Echo 60 EC
IV Butachlor Meco 60 EC
IV Pyrazosulfuron Ethyl Sirius 10 WP
IV Metsulfuron Methyl + Bensulfuron Sindax 10 WP
IV Pretilachlor Sofit 300 EC
IV Oxadiazon Ronstar 25 EC
IV Fenxaprop-P-ethyl Whip’s 7,5 EC
Source: 1997 survey
Table 3. Types of insecticides used in the Mekong Delta, classified using the WHO category.
Chemical Type Category Common Name Trade Name
Organochlorine II Edosulfan Thiodan 30 EC
Organophophate II Diazinon Basudin 50 EC
II Fenitrothion Sumithion 50 EC
Ia Methyl parathion Methyl Parathion
50EC
Ib Methamidophos Filitox 60 SC
Ib Methamidophos Monitor 50 SC
Ib - Azodrin 50 EC
Carbamate II Fenobucarb Bassa 50 EC
II Fenobucarb Bassan 50 EC
II Fenobucarb + Hopsan 75 EC
5/15/03 12:32 PMEconomic And Health Consequences Of Pesticide Use In Paddy Production In The Mekong Delta, Vietnam
Page 10 of 39http://203.116.43.77/publications/research1/ACF124.html
Phenthoate
Ib Carbofuran Furadan 3 G
Ib Benfuracarb Oncol 20 EC, 25
WP
Pytheroid II Alpha-cypermethrin Cyper alpha 5 EC
II Deltamethrin Decis 2,5 EC
II Alpha-cypermethrin Fastac 5 EC
II Alpha-cypermethrin Fastocide 5 EC
II Fenvalerate +
Dimethoate
Fenbis 25 EC
II Lambda-cyhalothrin Karate 2,5 EC
II Alpha-cypermethrin Sapen alpha 5 EC
II Cypermethrin Sherpa 25 EC
II Esfenvalerate Sumi alpha 5 EC
II Alpha-cypermethrin Vifast 5 EC
II Cypermethrin Visher 25 EC
Others II Metaldehide Deathline Bullet 4G
II Cartap Padan 4 G, 95 WP
II Fipronil Regent 0.3 G, 800
WP
IV Buprofezin Applaud 10 WP
IV Etofenprox Trebon 10 EC
Source: 1997 survey
Table 4. Types of fungicides used in the Mekong Delta, classified using the WHO category.
Category Common Name Trade Name
II Tricyclazole Beam 75 WP
II Propiconazole Tilt 250 EC
5/15/03 12:32 PMEconomic And Health Consequences Of Pesticide Use In Paddy Production In The Mekong Delta, Vietnam
Page 11 of 39http://203.116.43.77/publications/research1/ACF124.html
III Iprobenphos Kitazin 50 EC
III Copper Oxychloride Viben - C 50 WP
III Triadimenol Bayfolan
III Isoprothiolane Fuji - one 40 EC
IV MAFA Dinasin 6,5 EC
IV - Komix TS 9
IV Validamycine Vivadamy 3 EC
IV Zineb Zineb 80% WP
IV Hexacodazole Anvil 5 SC
IV Carbendazim Appencarb super 50 FL
IV Carbendazim Bavistin 50 FL
IV Benomyl Bemyl 50 WP
IV Benomyl Bendazol 50 WP
IV Benomyl Benlat C 50 WP
IV Carbendazim Cadazim 50 FL
IV Carbendazim Carbenzim 50 WP
IV Captan Captan 7,5 WP
IV Zineb + Bordeaux +
Benomyl
Copper - B WP 75%
IV Carbendazim Derosal 50 SC, 60 WP
IV Mancozeb Dithane 2-78 72 WP
IV Benomyl Fundazol 50 WP
IV Thalide + Kasugamycin Kasai 21,2 WP
IV Mancozeb Mancozeb 80 WP
IV Benomyl Mimyl 12,5 SP
IV Pencycuron Monceren 25 WP
5/15/03 12:32 PMEconomic And Health Consequences Of Pesticide Use In Paddy Production In The Mekong Delta, Vietnam
Page 12 of 39http://203.116.43.77/publications/research1/ACF124.html
IV Thiophanate-Methyl Topsin 50 WP, 70 WP
IV Iprodione Rovral 50 WP (10 G)
IV Validamycine Validacine 5 WP, 5 EC
Source: 1997 survey
Based on the World Health Organization (WHO) classification of pesticides, farmers used mostly
insecticides in categories I and II, which are classified as moderately and extremely hazardous,
respectively. In the Organochlorines (OCs) group, although Edosulfan is restricted in Vietnam, it was still
used by 3 percent of the farmers in the Mekong Delta. However, as shown in Table 5, there was a
significant decrease in the use of restricted insecticides in rice production in the 1996/97 dry season. For
instance, the proportion of farmers and the amount of Methyl Parathion applied in the 1996 dry season
were far less than those in the 1992 dry season. A comparison of insecticide type used showed that 17
percent of insecticide sprays in Vietnam compared with 20 percent in the Philippines belonged to
WHO's category Ia, i.e. extremely hazardous chemicals; most of these sprays were Methyl parathion
(Heong, et al., 1994). At present, Organophophates (e.g., Methyl parathion & Methamidophos) and
Carbamates (e.g., Carbofuran and Benfuracarb) are restricted by the Ministry of Agricultural and Rural
Development but Mekong Delta farmers (4.5%, 19.1%, 3%, and 1%, respectively) continued to use
them. This may be partly due to the availability of the stocks of these insecticides after their ban and their
relatively cheaper price and wide-spectrum toxicity. There could also be some weakness in the
enforcement and control of the use of hazardous chemicals or unavailability of choices for substitution.
Table 5. Trend in pesticide use of rice farmers in the Mekong Delta
Item WHO
Classification
1992/93 Dry
Season
1996/97 Dry
Season
% Ave./ha % Ave./ha
1. Types
Methyl
Parathion
Ia 36 625 4.5 180
Metaphos Ia 3.3 365 - -
Azodrin Ib 26 631 5.6 317.5
Monitor Ib 26 737 17.4 424
Thiodan II 8 460 2.8 29.8
Furadan Ib 10 45.6 2.8 350
Quantity( g
a.i./ha)
11,786 11,017
Source: 1992 and 1996 dry season surveys.
5/15/03 12:32 PMEconomic And Health Consequences Of Pesticide Use In Paddy Production In The Mekong Delta, Vietnam
Page 13 of 39http://203.116.43.77/publications/research1/ACF124.html
On the other hand, about 60 percent of paddy farmers used insecticides in the Pytheroids group with
diverse types such as Cypermethrin, Deltamethrin, and Alpha-cypermethrin, together with Carbamates
like Fenobucarb, which is classified in the moderately hazardous category (II). Compared with the
extremely hazardous insecticides, use of the latter categories to some extent could mitigate risks from
pesticide exposure to farmers’ health. However, their use does not mean that farmers are free from the
dangers of poisoning.
Given the current direct seeding techniques in rice farming, using herbicide is almost a must for farmers to
eradicate weeds at the very early stage of crop growth. Farmers often use 2,4-D, Butachlor and
Fenxappro-P-ethyl to control weeds. In contrast to insecticides, of the 17 types of herbicides listed in
Table 2, only one, Gramoxone, belonged to category II. This kind of hazardous herbicides poses
potential damage to health. Gramoxone, at only 5ml of active ingredients, can cause death when
ingested. Although restricted, it was still in use, thus there were cases of acute poisoning symptoms
among rice farmers. However, not more than 2 percent of the farmers used this herbicide. The rest of
the herbicides belonged to category III and IV, which the WHO defines as slightly hazardous and
unlikely to present acute hazard in normal use, respectively. As mentioned, 2,4-D is one of those that
cause many symptoms of disorders for sprayers because of pesticide exposures.
Another big group of pesticides that farmers applied to control rice disease was fungicides (Table 4).
About 30 types of fungicides were used in the 1996/97 dry season. The most popular fungicides were
Propiconazole, Iprodione, Validamicine, and Zineb. Although fungicides do not cause serious and acute
damage to farmers’ health, they have been reported to cause some harm to farmers' skin and eyes.
There were other pesticides that did not belong to the groups mentioned above, but were used by nearly
50 percent of the sample farmers. They included Applaud and Trebon which belonged to category IV,
which WHO considers as products unlikely to present acute hazard in normal use. They were used by
about 10 percent of the farmers.
6.2 Quantity of Pesticide Use
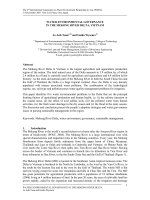
Figure 1 shows that among the pesticides, insecticides were used the most (394 grams a.i. per hectare)
followed by herbicides (323 grams a. i. per hectare) and fungicides (300 grams a.i. per hectare) in
Mekong Delta. On the average, farmers applied 1,017 grams a.i./ha per crop of pesticides. The amount
of pesticides used by the sample farmers decreased by 43 percent compared with the amount they used
in the 1992 dry season. A general decrease in the quantity of pesticide use was observed, which could
be attributed to the implementation of the IPM program. Farmers tended to use less hazardous but
highly effective pesticide types.
Integrated Pest Management as practiced by more than 30 percent of the farmers helped reduce
significantly the amount of pesticides applied per unit of area. Pesticide dose used by IPM farmers
(883.9 grams/ha) was lower than that applied by non-IPM farmers (1,081 grams/ha). This difference
was statistically significant at 0.1 level. Farmers' adoption of the practice of not spraying insecticides in
40 days after sowing could be the main reason for the significant decrease. This result implies that costs
of pesticide use and health damages likewise had been mitigated.
5/15/03 12:32 PMEconomic And Health Consequences Of Pesticide Use In Paddy Production In The Mekong Delta, Vietnam
Page 14 of 39http://203.116.43.77/publications/research1/ACF124.html
Figure 1. Pesticide dose used in rice farming (a.i. gram/ha).
To visualize better the usage level of pesticides at the study sites, six villages were divided into two
groups. Group 1 included the villages of NhiMy, VinhMy, and DongPhuoc; the rest of the villages
belonged to group 2. Results showed that this division resulted in very significant results at the 0.01 level
with respect to insecticides, fungicides, and herbicides. The pesticide use levels of group 1 were
significantly higher than those of group 2. This implies that farmers’ health at three villages, namely:
NhiMy, VinhMy, and DongPhuoc, was easily impaired by their high level of pesticide application.
Table 6. Pesticide use in the 1996-97 winter-spring rice crop, classified by dose.
Kinds of Pesticide Group 1 Group 2 t - ratio
Insecticide 503.6 287.2 3.09***
Fungicide 397.3 204.9 3.70***
Total pesticide 1,229.0 806.0 3.97***
Source: 1997 survey
6.3 Frequency of Pesticide Application
The threat to health from exposure to pesticides may also result from frequent contact with pesticides
belonging to hazardous categories. In the last few cropping seasons, the average frequency of pesticide
application had slightly declined. Farmers decreased their frequency of insecticide application but raised
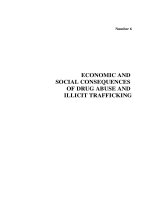
that of herbicide or fungicide spraying due to demand of their rice fields. More than 22 percent of the
respondents applied pesticides 3 times for each crop (Figure 2). None of the farmers applied pesticides
10 times or more, unlike in the earlier seasons. This reflected partly the farmers’ perception of the
efficiency of pesticide use.
5/15/03 12:32 PMEconomic And Health Consequences Of Pesticide Use In Paddy Production In The Mekong Delta, Vietnam
Page 15 of 39http://203.116.43.77/publications/research1/ACF124.html
Figure 2. Number of pesticide applications in the 1996-97 dry season.
6.4 Farmers’ Behavior and Perception in Pesticide Application
Examining the farmers’ behavior and perception helped to understand their current pesticide practice. As
shown in Table 7, more than 95 percent of the farmers perceived that long-term application of pesticides
affects health.
Table 7. Farmers’ perception of effects on health of prolonged pesticide use.
Degree of
Effect
(% of
respondent)
Nhi
My
Tan P
Trung
Long
Dien
Vinh
My
Thanh
Xuan
Dong
Phuoc
Region
No effect 6.7 0.0 16.7 4.0 0.0 0.0 4.6
Very little effect 13.3 20.0 13.3 4.0 27.6 10.0 14.9
Little effect 26.7 30.0 33.3 38.5 20.7 26.6 29.0
Much effect 30.0 23.3 13.3 30.5 31.0 6.7 22.3
Very much
effect
20.0 26.7 16.7 11.5 17.3 16.7 18.3
Extremely large
effect
3.3 0.0 6.7 11.5 3.4 40.0 10.9
Source: 1997 survey
5/15/03 12:32 PMEconomic And Health Consequences Of Pesticide Use In Paddy Production In The Mekong Delta, Vietnam
Page 16 of 39http://203.116.43.77/publications/research1/ACF124.html
However, only 33.3 percent of the farmers used protection equipment such as cap, mask, and clothing
when spraying. The most common reasons for not using safety equipment were that farmers did not feel
comfortable wearing protection equipment (21.8%), they had no money to buy them (17.8%), and using
protection clothing was not suitable for the local condition (17.5%) (Table 8). It was also shown that
farmers who participated in IPM activities used safety gears more often than non-IPM farmers.
Table 8. Use of protection equipment when spraying pesticides as reported by farmers
User/Non-user
(% of
respondents)
Nhi
My
Tan P
Trung
Long
Dien
Vinh
My
Thanh
Xuan
Dong
Phuoc
Region
Equipment users 46.7 20.0 13.3 24.0 35.5 60.0 33.3
Non-users due to
No money to buy 0.0 36.7 26.7 16.0 17.2 10.0 17.8
Uncomfortable 20.0 23.3 16.7 56.0 6.9 13.3 21.8
Inappropriate 6.6 6.7 30.0 0.0 0.0 0.0 7.5
Unnecessary 10.0 13.3 6.6 4.0 24.2 10.0 11.6
Other reasons 16.7 0.0 6.7 0.0 17.2 6.7 8.0
Source: 1997 survey
On the other hand, the sources of information which influenced farmers in their application of pesticides
were very diverse. About 27.7 percent of the respondents received help from agricultural extension
officials about the types and quantity of pesticides that should be applied (Table 9). These often were
farmers who followed the IPM program, therefore, had basic knowledge about pests. The rest (72.3%)
obtained information from other sources such as experience, television, newspapers, input sellers, radio,
etc. A large number of farmers relied on their own experience (26%), on TV advertisement (14.1%), or
on material input sellers (11.9%).
Table 9. Information sources of farmers regarding pesticide application.
Information
Source
Nhi
My
Tan P
Trung
Long
Dien
Vinh
My
Thanh
Xuan
Dong
Phuoc
Region
Other farmers 0.0 3.3 31.0 14.6 0.0 0.0 7.9
Agricultural
extension
10.0 40.0 17.2 35.5 33.3 30.0 27.7
5/15/03 12:32 PMEconomic And Health Consequences Of Pesticide Use In Paddy Production In The Mekong Delta, Vietnam
Page 17 of 39http://203.116.43.77/publications/research1/ACF124.html
Television 6.7 10.0 24.2 14.3 23.4 6.7 14.1
Radio 6.7 6.7 0.0 10.6 16.7 3.3 7.3
Newspaper 0.0 6.7 0.0 0.0 0.0 0.0 1.1
Input sellers 20.0 13.3 3.4 3.6 20.0 10.0 11.9
Experience 36.6 20.0 24.2 21.4 3.3 50.0 26.0
Other sources 20.0 0.0 0.0 0.0 3.3 0.0 4.0
Source: 1997 survey
6.5 Pesticide Application and IPM Program in the Mekong Delta
After IPM activities were introduced in the Mekong Delta by the Plant Protection Department, the IPM
farmers accounted for 32.6 percent of the sample farmers in the six study sites. Although the number of
farmers (58 over 178 interviewed farmers) applying methods of cultivation associated with IPM
program was not yet high enough as expected, the efficiency of the IPM program after five years of its
introduction to the farmers was undeniable.
Significant differences between IPM farmers and non-IPM farmers were observed regarding some
aspects of pesticide use (Table 10). IPM farmers used lesser amount of pesticides belonging to all
categories than non-IPM farmers. Moreover, the number of applications of non-IPM farmers (3.7) was
higher than that of IPM farmers (3.5). As a consequence, pesticide efficiency and health ailments due to
exposure were different among groups of farmers as presented in the next sections.
Table 10. Some production characteristics of IPM and non-IPM farmers, 1997.
Pesticide Exposure IPM Non-IPM T ratio Region
Category I & II (gram
a.i./ha) (CA1)
394.70 457.60 0.88 436.90
Category III & IV
(gram a.i./ha) (CA3)
533.88 602.90 0.94 580.10
Average dose of
pesticides /ha
883.90 1,081.00 1.93** 1,017.00
Nof applications
o
3.46 3.67 0.94 3.60
N of exposure to
CA1
o
2.10 2.70 2.33*** 2.50
N of exposure to
CA3
o
2.80 2.60 0.60 2.65
Source: 1997 survey; **, ***: statistical significance at 0.05 and 0.01, respectively
5/15/03 12:32 PMEconomic And Health Consequences Of Pesticide Use In Paddy Production In The Mekong Delta, Vietnam
Page 18 of 39http://203.116.43.77/publications/research1/ACF124.html
7.0 PESTICIDE AND RICE PRODUCTIVITY
Pesticides are commonly expected to contribute to increased rice yields by minimizing damages caused
by pests. However, a continuous increase in pesticide application in excess of the necessary level will
cause spillover effects on both economic return and ecological environment, especially on farmers’
health. Therefore, it is essential for paddy farmers to keep the pesticide amount at the optimal level in
order to maximize profit and reduce costs to environment in which cost to farmers’ health is a serious
concern.
7.1 Estimated Contribution of Production Factors to Rice Yield
Regarding technical efficiency of production scales, the results in Table 11 showed that large farms were
more efficient productivity-wise than smaller farms. Phuong (1997), using enterprise budgeting to
examine the benefits of rice production, also obtained the same conclusion. However, some previous
studies in rice production (Dung, 1994) revealed that economic efficiency was higher in small farms (< 9
acres). Hired and family labors contributed positively and significantly to rice yields. The influence of
family labors to rice yield was similar to that of hired labors, with estimated coefficients of 0.102 and
0.099, respectively. The IPM program contributed significantly to an increase in rice yields. This
supports the results presented in the previous sections. The coefficients of education variables also
revealed that rice yield of higher-educated farmers was higher than that of lower-educated farmers. Soil
class was also positively and significantly related to rice yield. Rice yield per hectare of soil class 1 was
higher than that of other classes according to the value of this coefficient.
Table 11. Multiple regression analysis of yield function in the Mekong Delta, 1997.
Dependent Variable: Loga of yield
Explanatory Variable Estimated
Coefficient
Standard Error
Constant 0.328 0.296
Log of NPK 0.086* 0.052
Log of hired labor 0.099*** 0.032
Log of family labor 0.102*** 0.028
Log of pesticides 0.035*** 0.013
Dummy for medium farms 0.031 0.032
Dummy for large farms 0.087** 0.034
Dummy for soil class 0.054* 0.029
5/15/03 12:32 PMEconomic And Health Consequences Of Pesticide Use In Paddy Production In The Mekong Delta, Vietnam
Page 19 of 39http://203.116.43.77/publications/research1/ACF124.html
IPM 0.047* 0.027
Dummy for secondary school 0.017 0.029
Dummy for high school & the
upper
0.023 0.033
R squared 0.261
F- value 5.86***
*, **, *** : statistically significant at 0.10, 0.05, and 0.01 respectively.
Denotes natural logarithm
a
Most noticeable in the yield function is that agro-chemicals had significant effects on yield. Yield (in
natural logarithm form) increases by 0.86 percent corresponding to a 10 percent rise in the amount of
fertilizers used (in natural logarithm form). Similarly, a 10 percent increase in total dose of pesticides will
contribute to a micro-increase of 0.346 percent in yield. However, economic returns should be
considered before investing further amounts of fertilizers and pesticides. This raises the question of what
optimal levels of these chemicals should be applied so as to get maximum profit, given current farm-gate
prices.
Given the average yield (6,440 kg/ha) and prices of rice (1,283 VND/kg) and pesticide (385 VND/
gram of active ingredient), the optimal level of pesticide that farmers should have applied in the 1996
winter-spring rice season for profit maximization is:
Optimal application of pesticide* = (0.0346 x 6,440 x 1,283)/385 = 742.6 grams
However, the mean level of pesticide used in the Mekong Delta was 1,017 grams a.i. per hectare. As
such, farmers overused pesticides by 274.4 grams a.i. per hectare. In other words, farmers lost 105,644
VND (274.4 x 385) per hectare because of an uneconomical investment of pesticides in their rice
farming. Profit maximization is attained at the optimal level, therefore any increase in pesticide use higher
than the optimal level is really not a rational investment. Moreover, in the trend of overusing pesticide,
environmental problems are inevitably generated.
7.2Efficiency in Rice Production of the IPM Program
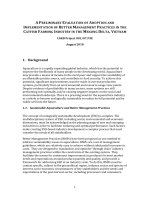
In economic terms, production performances of IPM farmers were much better than those of non-IPM
farmers as presented in Table 12 and Figure 3. It was hypothesized that the IPM program contributes
significantly to a decrease in costs rather than an increase in yield. However, the current data revealed
that rice yield of IPM farmers was also higher by 400 kg per hectare than that of non-IPM farmers.
Moreover, pesticide costs of IPM farmers were lower than those of non-IPM farmers. Thus, the total
production cost of the former was larger than that of the latter though insignificantly different from zero.
As a consequence, the benefit cost ratio (0.94) of IPM farmers was higher than that of non-IPM farmers
(0.79). The most significant point is that the IPM program successfully helped farmers to decrease health
costs from pesticide exposure. Health cost of IPM farmers was lower than that of non-IPM farmers at
0.1 level of confidence. In this sense, net benefits of IPM and non-IPM farmers were 4,069,300 (VND)
and 3,356,400 (VND), respectively.
Table 12. Rice production economics in the Mekong Delta, 1996/97 dry season.
5/15/03 12:32 PMEconomic And Health Consequences Of Pesticide Use In Paddy Production In The Mekong Delta, Vietnam
Page 20 of 39http://203.116.43.77/publications/research1/ACF124.html
Item IPM
Farmer
Non-IPM
Farmer
t - ratio 1996/97
Dry
Season
1992/93
Dry
Season
Yield (kg/ha) 6,700 6,300 3.13*** 6,440 6,163
Pesticide cost
(VND)
318,600 327,500 0.78 324,600 249,400
Labor cost (VND) 1,763,000 1,614,000 -1.42** 1,662,000 1,029,000
Fertilizer cost
(VND)
1,028,000 983,700 -1.01 998,000 724,500
Seed cost (VND) 352,500 406,300 1.86*** 388,900 234,300
Other cost (VND) 1,245,000 1,219,000 -0.40 1,227,000 771,800
Total cost (VND)
a
4,707,000 4,550,000 -1.08 4,601,000 3,009,000
Return (VND) 8,865,000 7,998,000 -3.14*** 8,279,000 5,983,000
Benefit (VND) 4,158,000 3.447,000 -2.67** 3,667,000 2,973,000
Return to
pesticides
21.6 18.9 -0.94 19.73 27.07
Return to fertilizers 5.30 4.60 -2.04** 4.86 6.49
Return to labors 3.70 3.40 -1.03 3.50 4.84
Cost/kg of rice
(VND)
710 737 1.06 728.00 500.00
Benefit/Cost ratio 0.94 0.79 -2.1** 0.84 0.89
Benefit/Return ratio 0.46 0.41 -1.91** 0.43 0.47
Estimated health
cost
b
88,700 90,600 0.38 89,310.00 -
Net benefit (VND) 4,069,300 3,356,400 -2.61*** 3,577,690 -
: 1997 survey, health cost not included, Estimated from model 1Source
ab
: Economic indicators in the table are defined as follows:Note
= Yield in kg x price per kgReturn
= Return - total costBenefit
= Costs of pesticides, fertilizers, seeds + costs of labors + other costsTotal cost
= (Return - all costs other than pesticides)/total pesticide costReturn to pesticides
5/15/03 12:32 PMEconomic And Health Consequences Of Pesticide Use In Paddy Production In The Mekong Delta, Vietnam
Page 21 of 39http://203.116.43.77/publications/research1/ACF124.html
= (Return - all costs other than fertilizers)/total fertilizer costReturn to fertilizers
= (Return-all costs other than labor)/total labor costReturn to labor
= Benefit: Health Cost AvoidedNet benefit
Figure 3. Cost and benefit of Mekong Delta farmers.
8.0 FARMERS' HEALTH PROFILE AND HEALTH COST DUE TO PESTICIDE
EXPOSURE
8.1 Farmers’ Health Impairments from Pesticide Exposures
Results of the 1996-97 winter-spring crop survey (Table 13) revealed that 69.7 percent of the farmers
were quite sure of the acute poisoning symptoms from pesticide exposure. Meanwhile, only 1.4 percent
of the respondents had no opinion on the effects of pesticide exposure. Investigating differences in health
status via an interview with direct sprayers showed evidence of eye, skin, cardiovascular, and
neurological effects. The farmers' interview revealed that each person can get simultaneously more than
one acute poisoning symptom. Among the poisoning symptoms caused by exposure, the impact of
chemical pesticides on the eyes and neurological system (headache, dizzy) and dermal effects were the
most discernible to farmers (Table 14).
Table 13. Farmers’ perception of pesticide poisoning symptoms (% of respondents who got
symptoms).
Farmers’
Opinion
Nhi
My
Tan P
Trung
Long
Dien
Vinh
My
Thanh
Xuan
Dong
Phuoc
Region
No opinion 0.0 6.70 00.0 00.0 0.0 0.0 1.4
5/15/03 12:32 PMEconomic And Health Consequences Of Pesticide Use In Paddy Production In The Mekong Delta, Vietnam
Page 22 of 39http://203.116.43.77/publications/research1/ACF124.html
Maybe 0.0 3.30 10.7 20.0 0.0 0.0 6.3
Sure 11.8 10.0 3.5 4.0 0.0 5.5 5.8
Rather sure 70.6 76.7 67.9 64.0 91.7 38.9 69.7
Completely
sure
17.6 3.30 17.9 12.0 8.3 55.6 16.8
Source: 1997 survey
Table 14. Percentage of respondents who experienced pesticide poisoning.
Symptom Nhi
My
Tan P
Trung
Long
Dien
Vinh
My
Thanh
Xuan
Dong
Phuoc
Region
Eye irritation 3.3 20.0 10.0 20.0 10.3 10.0 12.1
Headache 14.3 70.0 44.3 52.0 34.5 23.3 41.8
Dizzy 6.7 36.7 33.3 48.0 49.3 46.7 26.2
Vomit 0.0 3.30 6.7 24.0 10.3 3.3 7.5
Diarrhea 0.0 3.30 0.0 22.0 0.0 0.0 2.3
Fever 0.0 10.0 10.0 16.0 17.3 13.3 1.9
Convulsion 0.0 0.0 3.3 22.0 0.0 0.0 2.3
Shortage of
breath
10.0 13.30 10.0 24.0 13.8 16.7 14.4
Heart trouble 3.3 20.00 20.0 52.0 3.4 3.3 16.1
Skin irritation 10.0 26.70 43.3 73.1 17.2 23.3 31.4
Cough 0.0 3.3 0.0 15.4 0.0 0.0 2.9
Others
(fatigue,
trouble
sleeping)
36.7 50.00 53.3 53.8 34.5 33.3 43.4
Source: 1997 survey
8.1.1 Eye effects
5/15/03 12:32 PMEconomic And Health Consequences Of Pesticide Use In Paddy Production In The Mekong Delta, Vietnam
Page 23 of 39http://203.116.43.77/publications/research1/ACF124.html
Table 15 presents the determinants of farmers’ health impairments. In the five senses of the human being,
the eye provides the most help to people in terms of perception. Eye irritation decreases sight and other
unexpected symptoms. Farmers generally paid little attention to bad effects of pesticide on the eyes and
other organs. Incidence of eye irritation increased significantly with drinking habit and exposure to
herbicides and fungicides (TOCA3). The ratio of weight by height carried a negative sign as expected on
eye abnormalities. In addition, a number of contacts with pesticides of categories I & II (NA1)
contributed significantly to an increase in eye irritation while the number of herbicide exposure (NA3) did
not have both the expected positive sign and statistical significance.
8.1.2 Neurological effects
The incidence of headache was significantly associated with drinking habit, age, and nutritional status;
drinking habit influenced most strongly the incidence of farmers’ headache. Farmers with drinking habit
experiencedthis symptom more easily than non-drinking farmers. The smoking habit had the expected
positive sign though not significant. Herbicide and fungicide (TOCA3) had a significantly positive effect
on this symptom; the effect of insecticides (TOCA1) was also positive but not significant. In fact, a 1
percent rise in TOCA3 contributed slightly to a probability of 0.00073 percent increase (in log of the
odds) in farmers’ headache after spraying.
Farmers at the sample mean with respect to age and health status who did not drink alcohol had a 22
percent probability of experiencing headache. Meanwhile, farmers who frequently drank alcohol had a
50 percent probability of getting headache. In addition, a doubling of total doses of herbicides and
fungicides from the mean level would lead to an increase of headache symptom by 60 percent.
Furthermore, the probability of neurological problems doubled with respect to change in farmers’ age.
Table 15. Logit regression on health impairments of rice farmers.
Variable Eye
Effect
Headache Skin
Effect
Multiple
Ailments
Multiple
Ailments
96’
Constant -1.74*
(0.98)
0.33
(1.93)
-0.37
(0.68)
1.17
(0.85)
-4.23**
(1.71)
Age 0.0033
(0.0079)
0.025*
(0.014)
-0.012***
(0.0058)
- 0.001
(0.0063)
0.03**
(0.014)
Smoking 0.13
(0.44)
0.035
(0.19)
0.18
(0.42)
Drinking 0.73***
(0.23)
1.25***
(0.43)
0.30**
(0.17)
0.31*
(0.176)
1.2***
(0.43)
Weight/height -0.056** -0.095* -0.036*** -0.038* 0.032
5/15/03 12:32 PMEconomic And Health Consequences Of Pesticide Use In Paddy Production In The Mekong Delta, Vietnam
Page 24 of 39http://203.116.43.77/publications/research1/ACF124.html
(0.026) (0.05) (0.018) (0.023) (0.041)
TOCA1 0.000033
(0.00018)
0.00033
(0.00045)
-0.000092
(0.00015)
0.00009
(0.0002)
0.00035
(0.00046)
TOCA3 0.001***
(0.00018)
0.00073*
(0.0004)
0.0011***
(0.00015)
0.0014***
(0.00025)
0.00084*
(0.00045)
NA1 0.195***
(0.061)
0.12
(0.12)
0.15***
(0.047)
0.25***
(0.058)
0.11
(0.13)
NA3 -0.058
(0.057)
-0.185
(0.11)
0.086**
(0.042)
0.12**
(0.057)
-0.044
(0.11)
Log-likelihood -443.2 -101.53 -681.34 -545.94 -101.57
Chi-square 63.15*** 23.1*** 138.53*** 144.56*** 23.2***
*, **, ***: statistically significant at 0.10, 0.05, and 0.01 respectively.
Figures in parentheses are standard errors.
8.1.3 Skin effects
Skin problems were popularly discerned in rice farmers who were often exposed to pesticides. The
Logit regression estimates indicated that the incidence of skin problems was positively and significantly
related to the dose of herbicides and fungicides. In contrast to theoretical expectation, the coefficient of
total doses of categories I & II carried a negative but insignificant sign. This reflected the dominant effect
of the number of contacts with insecticides on the skin. As expected, the general health status with a
negative sign was related significantly to skin effects.
Farmers at the sample average for age and nutritional status who did not apply any herbicide had a 35
percent probability of skin problems. The probability of skin irritation rises to 56 percent for farmers at
the mean level of three times of contact with herbicides and 60 percent for farmers with four times of
herbicide contacts.
8.2 Incidence of Multiple Health Impairments
The analysis presented above considers separately the impact of pesticide on specific illness.
Nevertheless, farmers experiencing pesticide exposures over time may be confronted with several health
impairments at the same time. The regression results showed that the incidence of multiple health
impairments was positively and significantly related to drinking habits, total doses of herbicides and
fungicides, as well as to the number of contacts with insecticides, herbicides, and fungicides. NA1
impacted more strongly on farmers’ health impairments than NA3. At the sample mean age and health
status, farmers who did not apply any herbicides or fungicides had a 45 percent probability of
experiencing two or more poisonings at the same time. The average level of three herbicide contacts
increases this probability by 85 percent. An additional dose of herbicide from the mean level shots up to
5/15/03 12:32 PMEconomic And Health Consequences Of Pesticide Use In Paddy Production In The Mekong Delta, Vietnam
Page 25 of 39http://203.116.43.77/publications/research1/ACF124.html