household demand for improved water services in ho chi minh city-
Bạn đang xem bản rút gọn của tài liệu. Xem và tải ngay bản đầy đủ của tài liệu tại đây (380.79 KB, 31 trang )
-
Economy and Environment Program
for Southeast Asia
Tanglin PO Box 101
Singapore 912404
Phone: (65) 6831-6854
Fax: (65) 6235-1849
E-mail:
Web site:
www.eepsea.org
R E S E A R C H R E P O R T
N
o. 2005-RR3
Household Demand for
Improved Water Services in
Ho Chi Minh City: A
Comparison of Contingent
Valuation and Choice
Modeling Estimates
Pham Khanh Nam andTran Vo Hung Son
Environmental Economics Unit
University of Economics – HCMC
1A Hoang Dieu St, Phu Nhuan District
Ho Chi Minh City, Vietnam
()
This report assesses the willingness of people in Ho
Chi Minh City, Vietnam to pay for improvement in
their water supply system. It also investigates what
aspects of water supply, such as quality and water
pressure, are most important. The study was carried
out in response to the growing number of water
supply problems in the city. It was also done to
highlight the need for ‘consumer demand’ to be given
priority in water supply planning.
Many of the households surveyed already had to do a
lot – and spend a lot of money – to cope with the
unreliable, poor-quality public water supply they
currently use. The report also finds that people are on
average willing to pay between VND148,000 and
VND175,000 for improvements in their water supply;
that households without piped water are more willing
to pay for improved services than those that already
enjoy a fixed supply; and that ‘non-
p
iped’ households
p
lace more importance on water quality than water
pressure.
EEPSEA Research Reports are the outputs of research projects supported by the Economy and
Environment Program for Southeast Asia. All have been peer reviewed and edited. In some cases, longer
versions may be obtained from the author(s). The key findings of most EEPSEA Research Reports are
condensed into EEPSEA Policy Briefs, available upon request. The Economy and Environment Program
for Southeast Asia also publishes EEPSEA Special Papers, commissioned works with an emphasis on
research methodology.
Library and Archives Canada Cataloguing in Publication
Pham, Khanh Nam
Household demand for improved water services in Ho Chi Minh City:
A comparison of contingent valuation and choice modelling estimates
(Research report, ISSN 1608-5434, 2005-RR3)
Co-published by the International Development Research Centre.
Includes bibliographical references.
ISBN 1-55250-164-7
1. Water-supply – Economics aspects – Vietnam – Ho Chi Minh City
2. Water quality management – Vietnam- Ho Chi Minh City
I. Tran Vo Hung Son
II. Economy and Environment Program for Southeast Asia.
III. International Development Research Centre (Canada).
IV. Title
V. Series: Research report (Economy and Environment Program for Southeast Asia); 2005-RR3.
HD1698.V5K42 2005 333.9’12’09597 C2005-980092-5
The views expressed in this publication are those of the author(s) and do not necessarily
represent those of the Economy and Environment Program for Southeast Asia or its
sponsors. Unless otherwise stated, copyright for material in this report is held by the
author(s). Mention of a proprietary name does not constitute endorsement of the
product and is given only for information. This publication may be consulted online at
www.eepsea.org.
Household Demand for Improved Water Services in
Ho Chi Minh City: A Comparison of Contingent
Valuation and Choice Modeling Estimates
Pham Khanh Nam
and
Tran Vo Hung Son
February, 2005
Comments should be sent to: Pham Khanh Nam, Environmental Economics Unit,
University of Economics – HCMC, 1A Hoang Dieu Street, Phu Nhuan District, Ho Chi
Minh City, Vietnam, Tel + 84 8 9972227, Fax + 84 8 8453897
Email:
EEPSEA was established in May 1993 to support research and training in
environmental and resource economics. Its objective is to enhance local capacity to
undertake the economic analysis of environmental problems and policies. It uses a
networking approach, involving courses, meetings, technical support, access to
literature and opportunities for comparative research. Member countries are Thailand,
Malaysia, Indonesia, the Philippines, Vietnam, Cambodia, Lao PDR, China, Papua New
Guinea and Sri Lanka.
EEPSEA is supported by the International Development Research Centre (IDRC); the
Swedish International Development Cooperation Agency (Sida); and the Canadian
International Development Agency (CIDA).
EEPSEA publications are also available free of charge online at .
ACKNOWLEDGEMENTS
We would like to express our sincere appreciation to Prof. Dale Whittington,
University of North Carolina at Chaper Hill; Dr. Wiktor Adamowicz, University of
Alberta; Dr. Fredrik Carlsson, University of Goteborg; and Dr. David Glover, Director
of EEPSEA, Singapore, for their valuable comments on our study proposal and analysis,
and to Mr. Truong Dang Thuy, University of Economics HCMC, for his help with the
survey.
All opinions, findings, conclusions, or recommendations expressed in this report
are those of the authors and do not necessarily reflect the views of EEPSEA. The
authors alone remain responsible for any errors in this paper.
TABLE OF CONTENTS
Executive Summary 1
1.0 Introduction 1
2.0 Background 2
3.0 The Models 3
3.1 Analytical Framework 3
3.2 Contingent Valuation Model 4
3.2.1 The Design 4
3.2.2 The Modeling 5
3.3 Choice Modeling 7
3.3.1 The Design 7
3.3.2 The Modeling 8
3.4 Sampling Strategy and Questionnaire 9
4.0 Results 10
4.1 Profile of Respondents 10
4.1.1 Socio-economic Characteristics of Households 10
4.1.2 Water Use Characteristics and Perceptions 11
4.2 Determinants of Willingness-to-pay Responses of Households 13
4.3 Contingent Valuation Results 14
4.4 Choice Modeling Results 16
4.5 Comparing WTP Estimates 19
5.0 Conclusion 20
References 21
LIST OF TABLES
Table 1: Social and water use profiles of survey households 11
Table 2: Average monthly coping costs in thousand VND 12
Table 3: Estimated parameters of the logarithmic utility model 14
Table 4: Estimated mean and median WTP in thousand VND 15
Table 5: Turnbull estimates for non-piped water households 15
Table 6: Multinomial logit models and marginal WTP for a change in each attribute 17
Table 7: Estimates of household willingness to pay (thousand VND/month) 18
LIST OF FIGURES
Figure 1: Analytical framework 4
Figure 2: The contingent valuation question 5
Figure 3: An example of a choice set 8
HOUSEHOLD DEMAND FOR IMPROVED WATER SERVICES IN
HO CHI MINH CITY: A COMPARISON OF CONTINGENT VALUATION
AND CHOICE MODELING ESTIMATES
Pham Khanh Nam and Tran Vo Hung Son
EXECUTIVE SUMMARY
Urban water utility authorities in Ho Chi Minh City are facing difficulties in
valuing the benefits of improved water service projects. This study used a contingent
valuation model and a choice model to estimate household preferences for water
services.
Single-bounded dichotomous choice questions were asked to derive households’
willingness to pay for possible improvements in water services; the choices included
higher water quality and reliable water pressure. In the choice modeling survey, non-
piped households (i.e. those not connected to central water supplies) were presented
with a series of choice sets, each containing one water project option, defined by water
quality levels and water pressure levels. The results showed that the amount that
households were willing to pay for improved water services was higher than the sum of
their existing water bills plus coping costs (incurred by coping behaviors like collecting,
pumping, treating, storing or purchasing water). The marginal values for the water
quality attribute were much higher than for the water pressure attribute. The welfare
estimates obtained from contingent valuation and choice modeling were fairly similar.
Without knowing the costs of providing various service improvements, we
cannot recommend specific improvements. However, we have established that (survey)
households in HCMC have a clear preference for improvements in water quality over
water pressure and a substantial willingness to pay for it and this is important
information for policy-makers and for future research.
1.0 INTRODUCTION
Water service providers are often under pressure to improve domestic water
services, without having the expertise necessary to assess how valuable these
improvements would be to consumers. Economic analysis can play an important role in
this regard (Altaf, Jamal & Whittington, 1992). In developing countries, many master
plans of new treatment plants and distribution systems unquestionably take the
engineer-dominated supply approach while the nature of water users’ needs is
neglected. Criticisms of this approach focus on the failure of such programs which
ignore the demographic and financial realities (Whittington et al, 1993). From the mid-
1980’s, a new vision based on the demand-oriented approach has emerged. This new
approach asserts that water utility bodies need to understand actual household water use
behavior and the observed ability and willingness to pay for improved water services
(Whittington et al, 1990).
In Vietnam, frequent failures with respect to urban water improvements have
been costly experiences. While many domestic water projects have been approved to be
1
quickly launched into operation, a lack of understanding of household demand for
water, household demographics, financial status, and household water use behaviour on
the part of the provideres have resulted in failed projects and frustration at both ends.
The final result is that the people’s demand for reliable water services has not been met
(Water Supply Company, 2002). Households in Ho Chi Minh City (HCMC) are using
unreliable, poor quality piped water and paying relatively cheap monthly water bills.
Many households also use non-piped water e.g. from tube-wells, for their daily
domestic needs.
In this study, we estimated household preferences for an improved water service
in Ho Chi Minh City using the discrete choice Contingent Valuation (CV) Model and
Choice Modeling (CM). We also aimed to compare welfare estimates of CV and CM
methods. The CM outcomes are often theoretically considered as providing more policy
relevant information, for example, marginal willingness to pay for attributes of projects
and preferences for a set of scenarios. (See Adamowicz, 1998a and Bateman et al.,
2002) for further discussions on comparison between CV and CM.) We used CV, which
is more traditional than CM, to crosscheck the CM outcomes. In the last two decades,
CV studies have been undertaken to value various aspects of water uses (Carson &
Mitchell, 1987; MacRea & Whittington, 1988; Whittington, Lauria & Mu, 1991;
Bachrach & Vaughan, 1994; Choe et al., 1996; Koss & Khawaja, 2001; Whittington et
al, 2002). Considering a wider context than just water uses, it is evident that only a few
studies compare CV and CM (Boxall et al, 1996; Adamowicz et al, 1998a; Hanley et al,
1998).
The rest of this paper is organized as follows:- in Section 2, we describe the
background of the study; in Section 3, we briefly introduce the analytical framework
and discuss the underlying economic theory and the design of CV and CM experiments;
results are presented and discussed in Section 4; and finally, Section 5 summarizes our
findings and presents some policy implications.
2.0 BACKGROUND
Ho Chi Minh City is the biggest city in Vietnam, covering an area of
approximately 2,000 square kilometers with a current population of about 5.5 million.
The state-owned utility board, called the Water Supply Company (WSC), is responsible
for service provision in Ho Chi Minh City, which includes public taps and private
connections in households and enterprises. As of August 2003, the WSC controlled
321,537 private connections in Ho Chi Minh City (WSC, 2004). So far, private
companies are not allowed to do business in this sector.
Currently, Ho Chi Minh City has sufficient surface and ground water to meet its
present needs (World Bank, 2004). There is no water shortage even in the dry season.
However, while the demand for domestic water is estimated at 1,250,000 cubic meters
per day, the existing piped water capacity can only meet around 70 per cent of this
demand.
Lack of capital and ineffective management has limited the city’s ability to
utilize existing water resources to provide its population with clean and safe water.
Most of the water pipelines in the city were installed over 30 years ago and have been
seriously deteriorating. As a result, estimates of water loss are in the order of 30% to
40% (WSC, 2004). It is widely perceived that there is significant heterogeneity in the
2
taste, smell, color, and cleanliness of water in different parts of the city. In certain areas
of the city, households without piped water rely on alternative sources of water, such as
private wells and tanker truck vendors. The number of uncontrolled private wells may
account for nearly 400,000 cubic meters per day (WSC, 2002).
Households tend to make quite substantial investments to address the problems
associated with the unreliable, poor quality public piped water supply. Electric pumps
are often used to extract water from the private wells or to suck water out of the
distribution system to fill storage tanks on the roof of the house. Drinking water is often
filtered and boiled. Sometimes bottled water and water bought from vendors are used as
a last resort (see details in section 4.1). These coping activities are expected to affect
household preferences for improved water projects (Pattanayak et al, 2004).
3.0 THE MODELS
3.1 Analytical Framework
Respondents were divided into two groups: households with existing piped
water service and households without piped water service. Single-bounded dichotomous
choice questions were asked of both groups to derive household willingness to pay for
an improvement in water services, which included higher water quality, and higher
water supply reliability. Choice Modeling (CM) was conducted only for households
without piped water connections because they were the group for which service
improvements were most likely to have the greatest impact. They were presented with
four choice sets, each containing one improved water project option, which was defined
by water quality levels and water pressure levels, and the status quo option.
3
Improved water service -
home-owners
(n=1,872)
Contingent
Valuation
(n=1,473)
Choice
Modeling
(n=399)
Piped water
(n=641)
8 monthly bills
Non-piped water
(n=832)
4 connection fees
5 monthly bills
40,000 (n=80)
80,000 (n=80)
120,000 (n=79)
160,000 (n=79)
200,000 (n=80)
240,000 (n=81)
280,000 (n=80)
320,000 (n=82)
Non-piped water
(n=399)
Water quality
- Low (Base case)
- Medium (MEDQ)
-Hi
g
h
(
HIGH
Q)
Water pressure
- Low (Base case)
- Medium (MEDP)
-Hi
g
h
(
HIGHP
)
Monthly bill
- 40,000 (Base case)
- 80,000
- 140,000
- 220,000
-
280,000
1,200,000
- 40,000 (n=41)
- 100,000 (n=43)
- 140,000 (n=42)
- 180,000 (n=42)
-
280,000 (n
=
44)
1,800,000
- 40,000 (n=44)
- 100,000 (n=44)
- 140,000 (n=43)
- 180,000 (n=44)
-
280,000 (n
=
41)
5,000,000
- 40,000 (n=39)
- 100,000 (n=39)
- 140,000 (n=39)
- 180,000 (n=39)
-
280,000 (n
=
39)
700,000
- 40,000 (n=41)
- 100,000 (n=41)
- 140,000 (n=43)
- 180,000 (n=43)
-
280,000 (n
=
41)
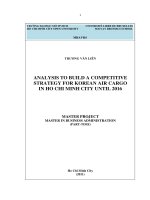
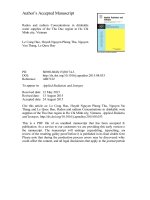
Figure 1. Analytical framework
1
3.2 Contingent Valuation Model (CVM)
3.2.1 The Design
Among various elicitation formats, the single-bounded dichotomous choice
question was chosen to obtain a household’s willingness to pay for a proposed
improvement of water services. Carson, Groves & Machina (1999) argues that the
close-ended single bounded format is incentive compatible when a survey is perceived
by respondents as a potential source of influence on policy decision-making. (In CVM,
it is important to provide respondents with incentives to reveal their true willingness-to-
pay (WTP). Incentive compatibility is one of the important characteristics of a CVM
design.)
1
The exchange rate was 15,400 VDN = 1 USD at the time of the survey in September 2003.
4
Split-sample designs were undertaken separately for piped and non-piped
households. (“Piped” households are connected to the municipal water supply. “Non-
piped” households are not connected and get their water from wells, water vendors or
other sources.) For households without piped water services, a connection fee and a
monthly water bill were introduced to the respondent. Therefore, among other factors,
the willingness to pay of a household depends on both the connection fee and monthly
water bill. Unfortunately, there is no welfare measurement model that captures two
different compensating surpluses (Freeman, 2003). Therefore, working on the
assumption that the capital market in Ho Chin Minh City (HCMC) works
competitively
2
, the connection fee was amortized by a social discount rate of 12%
3
to
the monthly bill as the only cost variable. Based on the information gained from focus
groups and pretest surveys, we set the bid vector such that it followed the rule that “the
highest price should typically be rejected by 90-95% of the respondents” (Kanninen,
1993). Eight prices were used in the discrete question for households with piped water
services. Four connection fees and five monthly bills were used for households without
piped water services (see Figure 1).
Considering statistical requirements for the models (Bateman et al, 2002), the
sample size for households with piped water was decided at 640 respondents (8 bids
*80 respondents for each bid). Similarly, the sample size for households without piped
water was 800 respondents (4 connection fees*5 monthly bills*40 respondents for each
split price package). Respondents facing the dichotomous choice questionnaire were
randomly assigned one of the initial bid amounts.
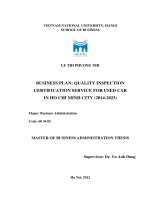
The payment vehicles could be (1) higher total monthly water bills, (2) higher
per person monthly water bills, or (3) higher cost per cubic meter of a fixed volume of
water. Based on pretests and focus group discussions, the higher household monthly
water bill was finally chosen because it is actually the way respondents think when they
have to compare the costs of using the improved water service and the benefits of that
service. (See Figure 2 for the shortened WTP question.)
If the piped water system I described above goes ahead, assume that this piped
water is the only source of water your family is going to use. A typical household in
HCMC would use about 23 cubic meters per month so we assume that this will
satisfy your family’s water needs too. This would mean that a family like yours
would have a monthly water bill of [……………] VND. Would your family willing to
pay for this improved water services? 1=Yes
Æ
go to C2 0=No
Æ
go to C3
Figure 2. The Contingent Valuation Question
3.2.2 The Modeling
The general form of the discrete choice CV model applied in this research
follows the approach suggested by Hanemann (1984). V
ij
, utility of household j for an
improved water service in the state i = 1 (i = 0 for the status quo) is the function of
2
This assumption was based on the fact that credit accessibility for home-owners in Ho Chi Minh City
for household expenses is generally provided by the bank (CIEM, 2004).
3
This discount rate was estimated from the ADB’s guidelines for project appraisal in developing
countries and a case study of Vietnam (ADB, 1999).
5
attributes of the existing and offered water source and the household’s socioeconomic
characteristics:
V
ij
= V
i
(M
j
, z
j
, ε
ij
) (1)
where M
j
is the j
th
household’s discretionary income, z
j
is the vector of household
characteristics and attributes of the resource, and ε
ij
is unobserved preferences. The
binary choice CV question will force the respondent to choose between the
improvement of water service at the required monthly bill t, and the status quo.
To measure welfare, this study used the logarithmic utility model. While the
random utility model with a linear income function assumes that the marginal utility of
income is constant across scenarios posed by the CV questions, the logarithmic utility
model allows the marginal utility of income to vary across utility states as money
income changes.
The probability of responding ‘yes’ to the proposed scenario is as given below.
(See Haab and McConnell, 2002, for a detailed process of model development.)
[
]
[
]
)ln())ln((
0011 jjjjjjjj
MztMzPYesP
ε
β
α
ε
β
α
+
+
≥
+
−
+=
(2)
or
[]
⎥
⎥
⎦
⎤
⎢
⎢
⎣
⎡
≥+
⎟
⎟
⎠
⎞
⎜
⎜
⎝
⎛
−
+= 0ln(
j
j
jj
jj
M
tM
zPYesP
εβα
(3)
Assuming the random variable ε
j
is distributed normally with mean zero and
variance σ
2
, we have the standard normal probability of a ‘yes’ response:
[]
⎥
⎥
⎦
⎤
⎢
⎢
⎣
⎡
⎟
⎟
⎠
⎞
⎜
⎜
⎝
⎛
⎟
⎟
⎠
⎞
⎜
⎜
⎝
⎛
−
+Φ=
σβα
j
jj
jj
M
tM
zYesP ln
(4)
The term
⎟
⎟
⎠
⎞
⎜
⎜
⎝
⎛
−
j
jj
M
tM
ln
is called composite income. The parameter vector
{∝/σ,β/σ} can be estimated by running a probit on the data matrix
⎪
⎭
⎪
⎬
⎫
⎪
⎩
⎪
⎨
⎧
⎟
⎟
⎠
⎞
⎜
⎜
⎝
⎛
−
j
jj
j
M
tM
z ln,
and
allows to calculate the mean WTP:
[]
⎥
⎥
⎦
⎤
⎢
⎢
⎣
⎡
⎟
⎟
⎠
⎞
⎜
⎜
⎝
⎛
+−−=
2
2
2
1
exp1
β
σ
β
α
ε
jjj
zMWTPE
(5)
and median WTP:
[]
⎥
⎥
⎦
⎤
⎢
⎢
⎣
⎡
⎟
⎟
⎠
⎞
⎜
⎜
⎝
⎛
−−=
jjj
zMWTPMD
β
α
ε
exp1
(6)
There are several techniques to calculate the confidence intervals of mean and
median WTP such as the Delta method (Greene, 2000), Bootstrapping, and the Krinsky
and Robb procedure (Haab & McConnell, 2002; Bateman et al, 2002). We applied the
Delta method in this study.
6
We also used the Turbull estimator (Carson et al, 1994; Haab & McConnell,
2002) to estimate the WTP of non-piped households for improved water services at each
connection fee. The Turnbull WTP results provide a better understanding of how
household preferences change as the connection fees change.
3.3 Choice Modeling (CM)
3.3.1 The Design
CM is a stated preference technique in which respondents choose their most
preferred resource use option from a number of alternatives. In a CM experiment,
individuals are given a hypothetical setting and asked to choose their preferred
alternative among several alternatives in a choice set, and they are usually asked to do
so for several choice sets. Each alternative is described by a number of attributes, which
are the subject of analysis, including a monetary attribute (see Figure 3.) The respondent
makes trade-offs between the levels of one attribute and the levels of other attributes
implicitly weighing and valuing the attributes within the choice sets. CM allows one to
understand and model how individuals evaluate product attributes and choose among
competing offerings.
The attributes and levels of attributes were developed using the results from two
focus group discussions and a pretest of 47 sample households. The focus groups were
used to determine the attributes (see Blamey et al., 1998 for detailed discussions on the
typical procedures) by addressing the following issues: definition of attributes, number
of levels for an attribute, levels of monetary attributes, wordings, and the impact of
photographs. The results showed that respondents considered two functional attributes
of an alternative when choosing a water service: water quality and water pressure.
Levels of these attributes were qualitative expressions
4
decided on by the focus groups.
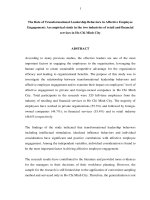
In the survey, respondent households were informed that it would be possible to
connect to and use a piped water service and that they would have to pay a higher
monthly water bill in return. Respondents were also told that the volume of water used
in a month would be fixed according to their household demand. Respondents were
given clear explanations of the attributes i.e. water quality and water pressure, and the
levels of these so that they could understand the choice set. They were also told that
there were two options available for the use of domestic water in Ho Chi Minh City: to
continue with the current situation, or to connect to and use piped water services.
Respondents were then presented with four choice sets showing various options for
their water uses (See Figure 3 for a sample choice set. There were 32 choice sets in
total). The options in the choice sets were defined using three different attributes: water
quality, water pressure, and household monthly water bill. Before answering the choice
sets, respondents were faced with framing questions, which reminded them to keep in
mind the improved water service embedded in an array of substitute and complementary
goods (Rolfe & Bennett, 2000).
4
See Blamey et al (1998) for a discussion on the advantages and disadvantages of qualitative and
quantitative expressions of levels.
7
Connection Status quo
Water quality
(Drink straight from tap –
high quality)
(Boil and filter before
drink – low quality)
Water pressure
(Strong pressure)
(Low pressure)
Total household monthly
water bill
140,000 VND 40,000 VND
CHOOSE ONLY ONE ⇒
F F
Figure 3. An example of a choice set
3.3.2 The Modeling
Choice modeling shares a common theoretical framework (i.e., the use of the
indirect utility function) with other environmental valuation approaches in the random
utility model (McFadden, 1973). Facing alternatives that present trade-offs among
attribute levels, each individual seeks to maximize her own utility as shown in the
following equation:
U
j
= maxV(A
j
, y – p
j
c
j
) (7)
Where maxV is maximum utility V; c
j
is an alternative combination j (profile j) as a
function of the vector A
j
; p
j
is the price of each profile; and y is the household’s income.
The individual chooses (on behalf of his household) the profile j if and only if:
V
j
(A
j
, y – p
j
c
j
) > V
i
(A
i
, y – p
i
c
i
) ∀ i ≠ j (8)
Suppose that the choice experiment consists of M choice sets, where each choice
set, S
m
, consists of K
m
alternatives, such that S
m
={A
1m
,…, A
Km
}, where A
i
is a vector
of attributes. From equation (8) we can then write the choice probability for alternative j
from a choice set S
m
as:
8
P{j| S
m
} = P{ V
j
(A
jm
, y – p
j
c
j
) + ε
j
> V
i
(A
im
, y – p
i
c
i
) + ε
i
} = P{ V
j
(…) + ε
j
–
V
i
(…) > ε
i
; ∀i ∈ S
m
} (9)
McFadden (1973) argued that if the error terms in the above equation are
independently and identically distributed with a Type I extreme value distribution (a
Gumbel distribution), the choice probability for alternative j will be as follows:
∑
∈
=
Si
Vi
Vj
e
e
jP
λ
λ
)(
(10)
The conditional logit model in equation (10) is the most common model used in
applied work (Adamowicz, Louviere & Swait, 1998b).
In this study, the estimated utility function V
j
takes the form as follows:
∑
+=
kkj
XV
βα
(11)
where α is an alternative specific constant, β is a coefficient and X is a variable
representing an attribute. The utility function may take another form if socio-economic
variables are included. Because these variables are invariant across alternatives in the
choice set, they have to be estimated interactively with α or one of the attributes X:
∑
∑
∑
+++=
khkhkkj
XSSXV
βαβα
(12)
where S represents socio-economic variables.
Once the parameter estimates have been obtained through equation (12), welfare
estimates are obtained through the equation (13), which is described by Adamowicz,
Louviere & Williams (1994):
⎥
⎦
⎤
⎢
⎣
⎡
−−=
∑∑
j
V
j
V
M
jj
eeCS
10
lnln
1
β
(13)
where β
M
is the coefficient of the money attribute (marginal utility of income),
and V
j0
and V
j1
represent the initial and subsequent states.
The marginal willingness to pay for a change in attribute is given by the
equation:
M
j
j
MWTP
β
β
−=
(14)
3.4 Sampling Strategy and Questionnaire
We used the 1999 population census as the sampling frame, which covered 22
districts of Ho Chi Minh City and around one million households (General Statistics
Office, 2001). Expert interviews and pretests showed that the research population did
not constitute a homogeneous group. Households in different areas had different water
9
use status and demographics that could affect their preferences for the proposed
scenario. Stratified random sampling was thus applied to obtain a representative sample.
Ho Chi Minh City was stratified into 22 non-overlapping sub-populations i.e. districts.
Wards
5
were randomly selected from each district. After a ward was selected to be
included in the sample, sub-wards and then households were randomly chosen.
The survey was conducted simultaneously in the chosen areas and all interviews
were face-to-face for each household (the sampling unit). Heads of household or their
wives were interviewed – as women commonly take charge of home practices, they
were considered reliable sources of information about their household’s water use
behavior.
The household CV and CM questionnaires were developed using the results
from four focus groups, two for CV and two for CM, and a pretest of 47 households.
The questionnaires consisted of four sections. The first section introduced the
background of the survey to the respondents. Section 2 covered the socio-economic
profile of the household such as number of persons, household size, number of women,
age, gender, education, occupation, and household income. Section 3 asked about
household water use and sanitation such as type of water source, type of water used,
monthly water bills, coping activities, type of waste services, and the capital and O&M
costs of different water-related investments. Section 4 was on stated preference
exercises. The CV questionnaire included a detailed account of existing domestic water
services, a full scenario of the improved water services, including payment vehicles, and
a single-bounded WTP question. The CM questionnaire provided a similar background
as the CV questionnaire but the scenario focused on explaining attributes of the piped
water project and the choice sets.
4.0 RESULTS
4.1 Profile of Respondents
4.1.1 Socio-economic Characteristics of Households
Table 1 provides basic information on sample households. A typical respondent
is female, 45 years old, with around nine years in school, and living with a family of
five other people. The mean household size of the connected households, who typically
reside in the center of HCMC, is larger than that of the unconnected households
implying a migration to the center of the city. Monthly water bills take up around three
per cent of total monthly expenditure of piped water households. This figure is
relatively lower than the international statistic of around five per cent (United Nations,
2000), for an equal volume of water used. The monthly water costs of non-piped water
households are not available here due to lack of information on the health effects of
(and therefore, costs of consuming) underground water.
In general, household income levels are low. For example, about 78% of the
households reported income levels of less than 5,000,000 VND per month, which
translates to less than US$1.6 per capita per day for an average household. The average
5
In Ho Chi Minh City, a district is divided into sub-units called wards. A district may have around 10
wards (minimum is 6 and maximum is 22).
10
household monthly income of the connected households was higher than that of the
unconnected households, reconfirming the fact that the access to piped water tends to
favor the rich (United Nations, 2000).
Table 1. Social and water use profiles of survey households
Piped water Non-piped water
Description Variable
Mean (Std.) Mean (Std.)
Socio-economic characteristics
% of female respondents FEMA 67 (47) 0.57 (0.49)
Household size (N) HHSIZE 6.5 (3.4) 5.7 (2.8)
Number of children in the household (N) NCHILD 1.0 (1.2) 0.9 (1.1)
Years in school of respondent (years) EDU 9.7 (3.9) 8.5 (3.9)
Age of respondent (years) - 45.5 (13.6) 44.1 (13.2)
Type of house:
1 = more than 2 floors, 0 = otherwise
HOUSE 0.17 (0.37) 0.03 (0.17)
Household monthly income (‘000 VND) HHINC 4,204 (3,206) 3,723 (2,426)
Own a fridge: 1 = yes, 0 = no FRIDGE 0.88 (0.51) 0.60 (0.48)
Location of house:
1 = household locates in area 1,
0 = otherwise
LOCA 0.49 (0.50) 0.35 (0.47)
Monthly expenditure (‘000 VND) - 2,745 (1,857) 2,096 (1,210)
Water use profile
Use of private well-water (1 = yes, 0 = no) - 0.12 (0.3) 0.82 (0.4)
Use of vendor water (1 = yes, 0 = no) - - 0.10 (0.3)
Volume of water used (m
3
) - 31.8 (21.7) -
Monthly water bill (‘000 VND) - 83.8 (79.7) -
Use of bottled water to drink
(1 = yes, 0 = no)
BOTTLE 0.07 (0.3) 0.21 (0.4)
Use of filter (1 = yes, 0 = no) FILTER 0.12 (0.3) 0.23 (0.4)
Use of tank to store water (1 = yes, 0 = no) TANK 0.62 (0.5) 0.92 (0.3)
Use of pump (1 = yes, 0 = no) - 0.43 (0.5) 0.83 (0.4)
Waste discharge (1 = flushing to sewer,
0=else)
SANIT 0.35 (0.5) 0.16 (0.4)
Perception on water service
Health: 1 = water is perceived safe or
neutral, 0 = otherwise
HEALTH 0.33 (0.47) 0.20 (0.40)
Water pressure: 1= pressure is perceived
strong or normal, 0 = otherwise
PRESS 0.63 (0.48) -
Water outage, 1 = water is always available
24/7, 0 = otherwise
AVAIL 0.67 (0.46) 0.75 (0.43)
4.1.2 Water Use Characteristics and Perceptions
Table 1 also shows household perceptions of water services and water use
characteristics, which are categorized by source of water, volume, monthly cost,
supplement facilities to cope with problems in existing water services, and sanitation.
Three kinds of main water sources are presented, namely private wells, bottled and
vendors.
Although piped water households use piped water, some of them also use water
from private wells as a supplement source and bottled water for drinking purpose. Their
11
reported average volume of water use is quite close to the WSC estimate, which is
around 35 cubic meters (WSC, 2002). Besides, they spend money on coping facilities
such as pumps, tanks and filters to address the problems of sub-standard piped service.
More than a half of these households own tanks for water storage to cope with
low water pressure and water outage. Nearly half have invested in pumps to suck water
from the main pipe and pump it up to the tank on the roof of the house. Sanitation
services of connected households are better those of non-piped households, mainly due
to their higher incomes and most of them reside in the urban areas. However, only about
one-third of these households flush waste discharge to sewers, causing potential
contamination of underground water in the dense urban areas.
As for non-piped water households, most of them use water from private tube-
wells, which require them to be equipped with electric pumps. They cope with water
problems more than the connected households do. Purchasing bottled water and water
from vendors are expensive solutions for those who cannot rely on wells. Most of them
have tanks, which are simply used to store water sucked from wells. Boiling and
filtering are two popular activities to treat water before drinking or cooking. All the
survey households reported that they boiled their water before drinking it.
Table 2 presents estimates on four common forms of coping behaviors. The
pumping costs comprise the current cost of putting in a new well, cost of electric pump
and cost of electricity. The costs for wells and electric pumps were amortized into
monthly costs based on a lifespan of 10 years and 3 years, respectively. The cost of
electricity was calculated based on information from focus groups and key informant
interviews. The treatment costs consist of boiling and filtering costs. We estimated the
boiling cost based on the volume of electricity consumed in boiling. The cost of a filter
was amortized into the monthly costs based on an assumed 5-year lifespan of the filter.
Storage costs are based on the amortized monthly cost of tanks. Purchase costs are for
bottled water, and water from vendors or other sources. These costs are reported by the
respondent. As shown in Table 2, the average coping costs of a non-piped water
household is threefold the coping costs of a piped water household.
Numbers in the table are average costs for a household, for example, the average
pumping cost for a piped water household is 16,000 VND. Coping costs include
pumping, treatment, storage and purchase costs. However, a household may have
pumping cost but may not purchase water. The average coping cost was calculated
based on the proportion of households with different kinds of costs.
Table 2. Average monthly coping cost in thousand VND
Costs Piped water household Non-piped water
household
Pumping costs 16 31
Treatment costs
(filter & boil)
16 18
Storage costs 10 7
Purchase costs 52 62
Average coping costs 25 75
12
4.2 Determinants of Willingness-to-pay Responses of Households
A household's willingness to pay for an improvement in water services would be
a function of the proposed change in the attributes of the services, and of all other
factors which influence the household's valuation of that change (Whittington et al,
2002). We hypothesize that the probability of responding “yes” to a proposed
improvement scenario in water services is a function of three categories: (1) respondent
and household characteristics; (2) perceptions of water problems; and (3) coping
activities. The descriptions of these explanatory variables are presented below.
The first category of the explanatory variables encompass household size,
number of children living in the family, composite income, and ownership of
refrigerators (fridges). Those below 12 years old are defined as children in this study.
This variable may have a positive or negative effect on the “yes” response depending on
the household’s affordability for substitute expenditures such as children’s education,
food, etc. The composite income, as shown in Section 4.2, includes both household
income and the bid, and has the same sign as income. The variable ‘fridge’ was used for
non-piped water households to identify those who could easily pay the connection fee.
The scenario was that the respondent faced two bids: a one-time payment connection
fee and a monthly bill. In the welfare measurement, connection fees were amortized and
added up with monthly bills. However, in reality, a “yes” response depends on how
large the connection fee is which in turn depends on the household’s affordability to
make a one-time payment of money. We captured the latter by using a proxy –
ownership of fridge. We chose education level and gender of respondents as
representative variables. Age was not included because respondents made decisions for
the whole family, not just for themselves as individuals.
The second group of the explanatory variables relates how respondents perceive
their water usage in terms of health effect, water outage and water pressure. The third
group concerns the coping activities of respondent households in treating water service
problems. For non-piped water households, the variable for ‘ownership of tank’ was not
applied because there was a high level of homogeneity in this factor. The location of the
house (loca) was a dummy variable, and referred to two main areas in Ho Chi Minh
City: groundwater in area 1 is aluminous at different levels and ground water in area 2
is non-aluminous. We expected households in area 1, which included districts 6, 7, 8,
11, Nha Be, and Binh Chanh, to be more willing pay for the project scenario. The
variable for sanitation (sanit) was included since if waste discharge goes to a septic
tank, it may affect the quality of water in a private well by the endosmosis process.
We used the binary discrete choice models (see section 3.2.2) separately for
piped water and non-piped water households. The results are presented in Table 3.
Given the null hypothesis that the parameter β of the composite income and ∝
i
of other
exogenous variables are equal to zero, we used the chi-square table for 11 degrees of
freedom at the 95% confidence interval, which equals 19.67, to reject the hypothesis.
The signs of the coefficients of both piped and non-piped water models all make sense,
except for the health variable. In this case, answers for the questions on perceptions on
the health effects of piped water are not homogeneous. In the case of non-piped water,
the health effects are clearer and easier to perceive.
13
For piped water households, four coefficients – hhsize, nchild, press and
composite income – are statistically significant at 99% level of confidence. The
coefficient gender is statistically significant at 95% level of confidence. The probability
of a “yes” increases with increases in household size, composite income and the
incidence of male respondents. It decreases when water pressure is perceived as strong
or normal, and with increases in the number of children in the household. Here, there
seems to be a trade-off between the monthly water bill and other expenditures for
children for households with a limited budget.
As for non-piped water households, three coefficients – fridge, bottle and
composite income – are statistically significant at 99% level of confidence. The
coefficient avail is statistically significant at 95% level of confidence. The probability
of a “yes” response decreases with increases in the availability of water, in that a
household with a private well that rarely runs out of water will have a lower probability
of a “yes” response. The probability of a “yes” increases with increases in the composite
income and if the household owns a fridge. As mentioned earlier, ownership of a fridge
is a proxy for the affordability of a one-time payment connection fee. The probability
of a “yes” also increases for households using bottled water for drinking purposes.
Table 3: Estimated parameters of the logarithmic utility model
Piped-water service Non-piped water service
Composite income 7.21 (0.000) 5.45 (0.000)
CONSTANT -0.17 (0.491) -0.76 (0.704)
Respondent and Household characteristics
EDU 0.96E-03 (0.947) 0.32E-03 (0.979)
GENDER 0.23 (0.045) 0.15 (0.106)
HHSIZE 0.07 (0.000) 0.02 (0.185)
NCHILD -0.18 (0.000) 0.05 (0.277)
HOUSE 0.23 (0.109) 0.04 (0.880)
FRIDGE - 0.30 (0.002)
LOCA - 0.13 (0.199)
Perceptions of water problems
HEALTH 0.05 (0.626) -0.15 (0.195)
AVAIL 0.16 (0.202) -0.27 (0.023)
PRESS -0.41 (0.000) -
Coping activities
FILTER 0.03 (0.846) -
TANK 0.28 (0.016) -
BOTTLE - 0.35 (0.002)
SANIT - -0.09 (0.481)
Log-likelihood -371 -516
Chi-squared 131 111
Number of observations 641 832
Note: p-values in parenthesis
4.3 Contingent Valuation Results
The WTP question for non-piped water households have vectors for two bids;
the connection fee and the monthly water bill. So far, there are no models for this kind
of WTP question from past research. One approach is include the two costs as separate
variables. However, this would probably create problems in welfare measurement.
14
(Equation 2 in section 3.2.2 implies that there is only one cost variable, t, which is a
trade-off for consuming the given goods or services.) Another approach is to convert the
connection fee into a monthly cost and add it to the monthly water bill as one cost
variable. This approach also poses a problem: there is a change in the payment vehicle.
In the CV experiment, the respondent makes a choice based on a proposed one-time
payment connection fee while in the welfare measurement, the connection fee is treated
as a monthly amortization. These two payment vehicles would be seen as comparative
on the assumption that the capital market in HCMC allows all households equal access
to credit in paying for the connection fee. In other words, the government would need to
guarantee a household’s right of access to credit for the installment of tap water service.
The logarithmic utility model, with the assumption that the error term is
normally distributed, was used to estimate the parameters shown in Table 3.
Substituting these parameter values and the mean values of covariates in Table 1 into
equations (5) and (6), we have estimates of the mean and median values of WTP for
improved water services. The results are presented in Table 4. Values at 95%
confidence intervals are also given. As mentioned earlier, we also used Turnbull
estimates for non-piped water households to see the WTPs at various connection fee
levels. The Turnbull WTP estimates are shown in Table 5.
Table 4. Estimated mean and median WTP in thousand VND
Piped water households Non-piped water households
Mean WTP
108
[26 – 191]
94
[11 – 176]
Median WTP
148
[74 – 221]
154
[91 – 218]
Note: 95% confidence interval in parenthesis. (The range is an indication of the accuracy of the welfare
measures in the WTP.)
Table 5. Turnbull estimates for non-piped water households
Connec
-tion
fee
700 1,200 1,800 5,000
Monthl
y bill
Share of
Yes (%)
Turnbul
l WTP
Share of
Yes (%)
Turnbul
l WTP
Share of
Yes (%)
Turnbul
l WTP
Share of
Yes (%)
Turnbul
l WTP
40 88 5 83 7 84 6 46 22
100 63 24 58 25 59 25 44 3
140 54 14 41 25 40 27 26 25
200 42 23 36 10 27 24 21 10
280 27 42 21 43 22 15 15 14
108 110 97 74
For piped water households, the mean WTP for the proposed improved water
service is 108,000 VND. The median WTP is 148,000 VND.
For non-piped water households, the mean WTP for connection to and use of
improved water services is 94,000 VND. The median WTP is much higher at 154,000
VND. We chose the median WTP estimates for discussion for these were more sensible
and robust than the mean WTP (Bateman et al, 2002).
15
The Turnbull estimates of WTP, given different connection fees, ranged from
74,000 VND to 108,000 VND. The higher the connection fee, the lower the monthly
bill that the household is willing to pay. Although the Turnbull estimates are not
directly comparable with parametric estimates, we can clearly see that there is no large
divergence between parametric and non-parametric results in this study.
4.4 Choice Modeling Results
Two different multinomial logit models were estimated using the data from the
survey. The first model (Model 1) shows the importance of choice set attributes in
explaining a respondent’s choice of two options; to continue in the current situation, i.e.
using water from private wells, or to connect to the pipeline system. Attributes were
described using effect codes. These codes are constructed for three level attributes by
coding the first two levels as dummy variables, and the third as -1 (Adamowicz,
Louviere & Williams, 1994). For example, the effect code for level 1 is created as
follows: if the alternative contains the first level selected, level 1 = 1; if the alternative
contains the second level, level 1=0; if the alternative contains the third level, level 1 = -
1. In this way, the coefficent of the base level is the negative sum of the coefficients of
the other two levels.
The second model (Model 2) includes both socio-economic variables to correct
the heterogeneity in preferences. These variables are set to interact with an alternative
specific constant (ASC). Utility is determined by the levels of the three attributes in the
choice sets (cost, water quality, and water pressure). Therefore, the model provides an
estimate of the effects of a change in any of these attributes on the probability that the
project or status quo scenario will be chosen.
The parameter estimates of these models are presented in Table 6. In Model 1,
the explanatory power of the model is relatively high (McFadden R-squared statistic is
26.99 percent). Coefficients for all attributes are statistically significant at 99% level of
confidence and have the expected sign, except for the medium pressure variable
(MEDP). The effect of the constant is positive and statistically significant at 99% level
of confidence, indicating that if everything else is held constant, it is more likely that a
household will maintain the status quo. The coefficient of the cost attribute is negative
and statistically significant, indicating that for each thousand dong increase in a
household’s monthly bill, the probability of choosing piped water service over the status
quo decreases by 0.02 (2%).
The results for Model 2 are shown in the third column of Table 6. Among the
covariates, only the INCOME variable interacted with the alternative specific constant
for the improved project alternative and is statistically significant at 99% level of
confidence. Consistent with expectations, this interaction shows that respondents were
more likely to support the improved water service project if they had a higher income.
16
Table 6: Multinomial logit models and marginal WTP with a change in each attribute
Model 1
Effect codes
Model 2
Effect code & ASC
interaction
Variables
Descrip-
tion
Coeff.
(p-values)
Marginal
WTP
(thousand
VND)
Coeff.
(p-values)
Marginal
WTP
(thousand
VND)
CONSTANT
2.7
(0.000)
-
4.7
(0.000)
-
COST
Monthly
water bill
-0.02
(0.000)
-
-0.02
(0.000)
-
MEDQ
Medium
water
quality
0.6
(0.000)
33
0.8
(0.000)
41
HIGHQ
High water
quality
1.7
(0.000)
87
1.9
(0.000)
94
MEDP
Medium
water
pressure
0.2
(0.100)
-
0.4
(0.004)
18
HIGHP
Strong
water
pressure
0.9
(0.000)
48
1.1
(0.000)
57
SEX
Gender of
respondent
- -
0.2E-01
(0.8451)
-
AGE
Age of
respondent
- -
-0.2-02
(0.5706)
-
INCOME
Monthly
household
income
- -
-0.2E-
03***
(0.2E-04)
-
Summary
statistics
Log-likelihood -1568 -1362
Chi-squared 1168 1233
McFadden R
2
0.3 0.3
Observations
399 samples
(see Figure 1) x
8 lines/samples
3192 (0 skipped) 2941 (255 skipped)
Estimates of implicit prices for each of the non-monetary attributes are shown in
Table 6. These estimates indicate that, for example, households are willing to pay
33,000 VND per month for a change from the status quo to a medium quality of water
and about 48,000 VND per month for strong water pressure.
However, these implicit prices do not provide welfare estimates of
compensating surplus. The array of compensating surplus can be estimated by setting up
multiple alternative scenarios. Table 7 presents the current state and four scenarios for
the improved water service project and the corresponding estimated WTP for each
scenario.
17