fish, fishers, seals and tourists- economic consequences of creating a marine reserve in a multi-species, multi-activity context
Bạn đang xem bản rút gọn của tài liệu. Xem và tải ngay bản đầy đủ của tài liệu tại đây (216.32 KB, 25 trang )
NATURAL RESOURCE MODELING
Volume 15, Number 4, Winter 2002
FISH, FISHERS, SEALS AND TOURISTS:
ECONOMIC CONSEQUENCES OF CREATING
A MARINE RESERVE IN A MULTI-SPECIES,
MULTI-ACTIVITY CONTEXT
JEAN BONCOEUR
Universit´e de Bretagne Occidentale
Centre de Droit et d’Economie de la Mer
Brest, France
E-mail address:
FR
´
ED
´
ERIQUE ALBAN
Universit´e de Bretagne Occidentale
Centre de Droit et d’Economie de la Mer
Brest, France
OLIVIER GUYADER
IFREMER
Service d’Economie Maritime
Brest, France
OLIVIER TH
´
EBAUD
IFREMER
Service d’Economie Maritime
Brest, France
ABSTRACT. This paper investigates some economic con-
sequences of creating a marine reserve on both fishing and
ecotourism, when the range of controllability of fishing effort
is limited and the impact of the reserve on ecosystem is con-
sidered. The issue is illustrated by the example of creating
a no-take zone in part of a region where fishing is managed
through a limited entry license system, and which is inhabited
by two interacting stocks : a stock of prey (fish) and a stock of
predators (seals). While the former is targeted by commercial
fishing, the latter is not subject to harvest but is a potential
basis for a commercial non-extractive activity (seal watching).
Analysis is conducted with the help of a bioeconomic model
combining the features of marine reserve modeling and of mul-
tispecies modeling. Following a description of the model, re-
sults of several simulation runs are presented. These show
that creating a marine reserve has more complex economic
implications than predicted in studies focused exclusively on
one stock and/or commercial fisheries. More specifically, the
Support from the French National Program of Coastal Environment (PNEC)
and from the EU funded VALFEZ research project (project QLK5-CT 1999-01271)
is gratefully acknowledged.
Copyright
c
2002 Rocky Mountain Mathematics Consortium
387
388 BONCOEUR, ALBAN, GUYADER AND TH
´
EBAUD
model shows that the dynamics of the two interacting stocks
reduces the benefits of the no-take zone for the fishing in-
dustry, while it makes the creation of this zone provide an
opportunity for the development of ecotourism. Due to this
dynamics, the model suggests that the optimal size of the re-
serve is larger when ecotourism is taken into account along
with fishing activities.
KEY WORDS: Marine protected areas, multispecies inter-
actions, ecotourism, bioeconomic modeling.
Introduction. Various achievements are expected from the creation
of marine reserves (Shackell et al. [1995]; Murray et al. [1999]). The
objectives pursued can usually be classified under one of the following
three categories: ecosystem preservation, fisheries management and
development of non-extractive recreational activities. At a general
level, the degree of compatibility between these objectives is difficult
to assess. It is bound to vary from case to case, depending on local
conditions. The variety of interests at stake is a source of potential
conflicts during the process of creating a marine reserve (Dixon et al.
[1993]; Polunin et al. [2000]), which calls for the development of tools
helping a global assessment of its impact (Hoagland et al. [1995]), both
in terms of efficiency (global surplus) and equity (distributional effects
among the various categories of stakeholders).
Up to now, the economic discussion concerning marine reserves has
mainly focused on their use as a fisheries management tool. Making
use of a single-species multiple-cohort model incorporating a stock-
recruitment relationship, Holland and Brazee [1996] have shown that
marine reserves could improve sustainable catches in overexploited fish-
eries, given a fixed level of fishing effort. Introducing uncertainty into
the harvested fraction of the stock and using a global discrete-time
logistic model, Lauck et al. [1998] have advocated marine reserves as
a way of implementing the precautionary principle in fisheries man-
agement. Also using a global logistic model, Hannesson [1998] and
Anderson [2000] have questioned the usefulness of marine reserves as a
tool for fisheries management in a deterministic context, as long as free
access is accepted outside the reserve. The assumption of space ho-
mogeneity inside the fishery, which is common to the above mentioned
papers, was relaxed by Sanchirico et al. [1999].
Marine reserves may also have an economic impact on ecotourism
(Agardy [1993]), a term being used here for naming non-extractive
FISH, FISHERS, SEALS AND TOURISTS 389
recreative activities related to the ecosystem. Studies considering this
question mainly deal with tropical areas (see e.g. Kenchington [1993];
Dixon et al. [1993]; Davis and Harriot [1995]; Buerger, Hill et al.
[2000]), and treat the consequences of marine reserves on ecotourism as
a direct corollary of their impact on fish biomass. The standard case
is that of a coral reef, which becomes more attractive for snorkellers
and scuba-divers if a fishing ban increases the number and/or size of
fish within the reef or close to it. Models used for assessing reserves as
fisheries management tools may be used to study this case, provided a
relationship between fish abundance and frequency of visits by tourists
is worked out. Once such a relationship is incorporated, these models
may be used to investigate the question of optimal reserve design and
appropriate supplementary measures within the general framework of
cost-benefit analysis (Hoagland et al. [1995]).
However, the coral-reef case is hardly transferable to temperate areas,
where observation of fish in their ecosystem (by diving, tours in glass-
bottom boats or other means) in most cases cannot be regarded as a
major opportunity for the development of ecotourism. If marine wildlife
observation has proved to be an important attraction for ecotourism
in many of these areas, the link with fish biomass, if any, is usually
indirect, i.e., operates through the ecosystem. One interesting case
is that of marine mammal watching, which has become a significant
source of incomes in some areas (Anon. [1994]; Hoyt [1995]; Hvenegaard
[1997]). In the case where the diet of these mammals makes them
competitors of fishers
1
, implementing a marine reserve in part of a
fishing zone may have indirect economic consequences both on the
fishing industry and ecotourism, through its impact on the stock of
marine mammals. Making use of multispecies modeling is helpful to
investigate such indirect consequences.
This paper presents a simple bioeconomic model describing some
consequences of implementing a marine reserve in part of an area where
fishing is conducted under a limited entry license system, and which is
inhabited by two interacting stocks: a stock of prey (fish) and a stock of
predators (seals). While the former is targeted by commercial fishing,
the latter is not subject to harvest but is a potential basis for the
development of ecotourism (seal watching)
2
. First the structure of the
model is described, then the results of some simulations are presented.
These results are used to discuss the direct and indirect impacts of the
390 BONCOEUR, ALBAN, GUYADER AND TH
´
EBAUD
reserve on both fishing activities and ecotourism.
1. Description of the model.
1.1 Hypothesis. The model presented here combines two topics
which are usually treated separately: marine reserve modeling and
multi-species modeling. The treatment of each of these topics is highly
simplified and based respectively on Hannesson [1998] and Flaaten
[1989]. The main biological and technical assumptions of our model
follow the hypothesis made by these two authors:
• deterministic, continuous time
3
self-regenerating model, applied
to a zone considered ecologically homogeneous and relevant for the
management of the living marine resources inhabiting it;
• distinction between two stocks, related by a prey-predator relation-
ship where the instantaneous mortality rate of prey by the predators
is supposed to be proportional to the biomass of predators, and the
predator carrying capacity of the area is supposed to be proportional
to the biomass of prey (Flaaten); in our model, prey will be called
“fish” (stock F) and predators “seals” (stock S);
• global representation of each stock (or each substock in the case of
fish), the natural dynamics of which follows a logistic curve;
• tendency of the fish stock to spread uniformly over the area under
survey, at a rate which depends on an exogenous mobility coefficient
(Hannesson)
4
;
• proportionality of CPUE to fish density inside the fishing zone
(Hannesson).
However, our institutional/economic hypotheses are slightly different:
• like Hannesson, we suppose that the area under survey is split into
two subspaces: a reserve, i.e., a zone where fishing is forbidden (zone 1)
and a zone open to fishing (zone 2); but, unlike that author, we assume
a limited entry license system, or some other regulation resulting in an
effective control over fishing effort; however, we acknowledge that, due
to political/social considerations, the regulator’s ability to lower fishing
effort is limited
5
.
• Unlike Flaaten, we suppose that only one of the two interacting
FISH, FISHERS, SEALS AND TOURISTS 391
stocks is harvested: while fish are targeted both by seals and fishers,
seals are not harvested but may have some economic value as a resource
for a non extractive recreative use (seal watching)
6
. We assume that
the demand for seal watching is a non-linear increasing function of the
stock of seals in the area under survey.
All prices are treated as exogenous.
1.2 Equations. The dynamics of both stocks is modeled as follows:
(1)
dX
F 1
dt
= r
F
.X
F 1
.
1 −
X
F 1
α.X
F max
− T − β.X
F 1
.X
S
(2)
dX
F 2
dt
= r
F
.X
F 2
.
1 −
X
F 2
(1 − α).X
F max
+ T − β.X
F 2
.X
S
− Y
F
(3)
dX
S
dt
= r
S
.X
S
.
1 −
γ.X
S
X
F 1
+ X
F 2
with:
X
Fi
the fraction of the fish stock biomass in subregion i, i =1, 2
X
S
the seal stock biomass
r
F
the intrinsic growth rate of the fish stock biomass
r
S
the intrinsic growth rate of the seal stock biomass
X
F max
the fish carrying capacity of the total region under survey
T the net instantaneous transfer of fish from the reserve to
the fishing grounds
Y
F
the instantaneous catch of fish by fishers in the region open
to fishing
α the share of the reserve in the total region under survey
β the predation coefficient (instantaneous fish mortality rate
per seal biomass unit)
γ the equilibrium ratio between fish biomass and seal biomass
The net transfer of fish from the reserve to the fishing grounds, T ,is
supposed to be proportional to the difference between the fish biomass
in the reserve and what it would be assuming uniform spread of fish
over the whole area under survey:
(4) T = σ.[X
F 1
− α.(X
F 1
+ X
F 2
)] = σ.[(1 − α).X
F 1
− α.X
F 2
]
392 BONCOEUR, ALBAN, GUYADER AND TH
´
EBAUD
with σ a coefficient describing the space mobility of fish
7
.
The catch per unit of effort is supposed to be proportional to the
density of fish in the fishing zone
(5)
Y
F
E
F
= q.D
F 2
⇐⇒ Y
F
= q.E
F
.
X
F
(1 − α).A
with:
q the catchability coefficient (instantaneous fish mortality rate per
unit of fishing effort and per unit of surface)
E
F
the fishing effort
D
F 2
the fish density inside the fishing zone
A the surface of the total area under survey.
Ecotourism is supposed to be the result of combining two partly
substitutable factors: natural resource (the seal stock) and production
effort (an index of the anthropic inputs devoted to the promotion of
ecotourism in the area under survey). For the sake of simplicity, we
will assume a Cobb-Douglas type production function:
(6) Y
S
= a.X
b
s
.E
c
S
with:
Y
S
the flow of ecotourism visits of the area
E
S
the effort devoted to the ecotourism industry
a a positive dimension parameter
b the elasticity of visits with regard to the abundance of seals
c the elasticity of visits with regard to the effort devoted to pro-
moting ecotourism
The fishing and ecotourism rents are defined respectively as follows
R
F
= P
F
.Y
F
− C
F
.E
F
(7)
R
S
= P
S
.Y
S
− C
S
.E
S
(8)
with:
P
j
the unit price of the product of activity j, j = F, S
C
j
the unit cost of effort devoted to activity j, j =F, S
FISH, FISHERS, SEALS AND TOURISTS 393
For given effort levels in both activities, the system reaches equilib-
rium when the following conditions are satisfied simultaneously:
dX
F 1
dt
=0(9)
dX
F 2
dt
=0(10)
dX
S
dt
=0.(11)
2. Simulations. Various simulation experiments with the model
were carried out using Excel and Stella softwares. For this purpose a
discrete time version of the model was built
8
. In these simulations the
equilibrium was calculated as the asymptotic result of the dynamics
of the system, assuming given initial conditions
9
. Although the path
towards equilibrium displays some interesting features, only equilibrium
results will be presented here. All the figures belong therefore to
comparative statics, i.e., they link various equilibrium situations but
give no information about the actual move from one equilibrium to
another. We shall start with a version of the model where parameter
β is set equal to zero (no mortality of fish by seals), in order to
display what can be expected from the reserve in terms of fisheries
management, when the ecosystemic interaction between the two stocks
is not taken into account (direct effect of the reserve). Then we shall
give a positive value to parameter β, which will depict how the impact of
the predator-prey relationship mitigates the direct effect of the reserve
for the fishing industry, and in the same time affects ecotourism. As
parameters of the model are not based on real-world observations, the
main features described by the simulations presented hereafter should
be considered from a qualitative, rather than quantitative, point of
view.
2.1 Reserve effects without predator-prey interaction. In this
first series of simulations, β = 0, which means no predation by seals.
Under this hypothesis, the simulations are interesting only from the
point of view of fisheries management (Figures 1 to 4).
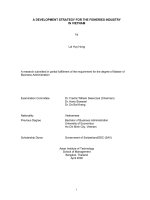
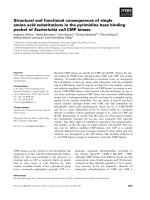
Figure 1 depicts the basic effect expected from the creation of a
reserve on fish biomass; while the fraction of the stock in the fishing
394 BONCOEUR, ALBAN, GUYADER AND TH
´
EBAUD
0
100
200
300
400
500
600
700
800
900
1000
0 50 100 150 200 250 300
Fishing effort
Fish biomasses
Reserve
Fishing zone
Total area
FIGURE 1. Relation between fishing effort and fish biomasses (intrinsic growth
rate of fish biomass is 0.3; mobility coefficient is 0.2; reserve is 30% of total
area; no predation).
zone tends to zero as effort increases, the fraction inside the reserve
is safe, which may give some protection against stock collapse due to
overfishing. This presentation is greatly simplified, as fish transfers
between zones link the dynamics of the two fractions of the stock.
The critical ratio here is between the intrinsic growth rate of the stock
(r
F
) and its space mobility coefficient (σ). As pointed out by Anderson
[2000], the safe minimum biomass level (SMBL) achieved by the reserve
will be positive only if σ ≤ r
F
or, in the opposite case, if the proportion
of the reserve in the total area, α, is larger than [1 − (r
F
/σ)]. The
simulations presented here are compatible with a positive SMBL, as
parameter values have been selected so that σ ≤ r
F
.
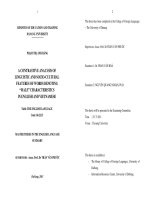
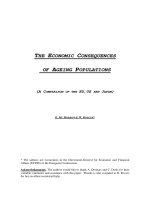
Figure 2 exhibits, in flow terms, what was presented in Figure 1 in
terms of stocks. Under equilibrium conditions, catches realized in the
fishing zone have two origins: the flow of natural increase of the fraction
of the stock in this zone, and the flow of net transfer from the reserve.
The first flow is the main source of catches when the fishery is lightly
fished, because then net transfer from the reserve is not important.
This is due to the fact that the densities of fish biomasses in both
zones are close to each other when fishing mortality occurring in zone
2 is low. The net transfer from the reserve becomes more important
FISH, FISHERS, SEALS AND TOURISTS 395
0
10
20
30
40
50
60
70
0 50 100 150 200 250 300
Fishing effort
Transfer and catches
Net transfer from the reserve
Catches
FIGURE 2. Relation between fishing effort, net transfer from the reserve to the
fishing zone and catches (intrinsic growth rate of fish biomass is 0.3; mobility
coefficient is 0.2; reserve is 30% of total area; no predation).
as the increase in fishing effort broadens the gap between the densities
inside the two zones. The density inside the fishing zone tends to zero,
and the flow of transfer tends towards a limit proportional to the SMBL
in the reserve. When the fishery is heavily fished, most of the catches
come from transfers from the reserve.
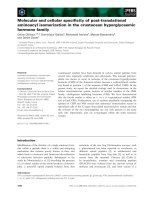
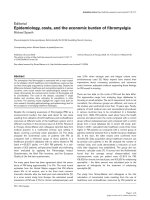
Figures 3 and 4 compare several scenarios concerning the relative
size of the reserve and fishing zone. As shown by Figure 3, the level
of the SMBL (the asymptotic value of fish biomass in the reserve and,
by extension, in the whole area when fishing effort grows indefinitely)
is an increasing function of the ratio α representing the share of the
reserve in the whole area. This protection effect of the reserve has a
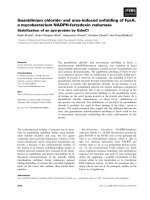
counterpart in terms of catches, which appears in Figure 4. Protecting
the stock against the risk of a collapse, the reserve also secures catches
if fishing effort becomes very important. As was shown in Figure 2,
the flow of catches becomes close to the flow of net transfer from the
reserve, which itself depends on the ratio α. However, the relation is not
monotonic, because, when the fraction of the stock inside the fishing
zone tends to zero, the net flow of transfer from the reserve comes close
to
T
∗
= σ.(1 − α).X
∗
F 1
396 BONCOEUR, ALBAN, GUYADER AND TH
´
EBAUD
0
100
200
300
400
500
600
700
800
900
1000
0 50 100 150 200 250 300
Fishing effort
Total fish biomass
Reserve = 0%
Reserve = 30%
Reserve = 50%
Reserve = 80%
FIGURE 3. Relation between fishing effort and total fish biomass according
to the relative size of the reserve (intrinsic growth rate of fish biomass is 0.3;
mobility coefficient is 0.2; no predation).
where X
∗
F 1
is the SMBL. The higher is α, the higher also is X
∗
F 1
(cf.
Figure 3), but the lower is (1 − α), the share of the fishing zone in
the whole area. These two factors act in opposite directions on T
∗
:
the flow of transfer from the SMBL, which is low when the ratio α is
close to zero, increases with α up to some point, after which it starts
decreasing as α tends to 1. In Figure 4, T
∗
increases when α goes from
30% to 50% but decreases if α goes from 50% to 80%.
For a lightly fished fishery, the volume of sustainable catches corre-
sponding to a given level of effort and the ratio α vary in opposite
directions. This is so because in this case, net transfer from the reserve
is unimportant (see Figure 2), and the main consequence of increasing
α is to diminish the biomass directly exploitable by fishermen.
The value of α maximizing catches varies according to the level of
fishing effort. Low or even zero when fishing effort is not important,
this value shows a tendency to rise (up to some limit) as fishing effort
increases. If fishing effort and its impact on fish biomass are under
perfect control, there is little to expect from the creation of a marine
reserve as regards fisheries management. The maximum maximorum
of catches (and, a fortiori, of fishing rent
10
) is achieved with a zero α.
However, as was stated by Holland and Brazee [1996], if the control
FISH, FISHERS, SEALS AND TOURISTS 397
0
10
20
30
40
50
60
70
80
0 50 100 150 200 250 300
Fishing effort
Catches
Reserve = 0%
Reserve = 30%
Reserve = 50%
Reserve = 80%
FIGURE 4. Relation between fishing effort and catches according to the
relative size of the reserve (intrinsic growth rate of fish biomass is 0.3; mobility
coefficient is 0.2; no predation).
of fishing effort is bounded by social/political constraints, the creation
of a reserve may in some cases be regarded as a second best solution,
because once a certain level of effort is attained, sustainable catches
become more important with a reserve than without it, caeteris paribus.
This feature, added to the benefits of “bet-hedging” advocated by
Lauck et al. [1998], suggests that in many real world cases, characterized
both by the existence of some control of fishing effort and by the
political inability of the regulator to bring it down to the “first best”
level, marine reserves should be regarded as a useful tool for fisheries
management. The benefits of this solution are jeopardized if the
creation of the reserve is followed by an increase in total fishing effort,
which is the type of problem addressed by Hannesson [1998] and
Anderson [2000] when they make the hypothesis of free access to the
resource outside the reserve.
2.2 Consequences of the predator-prey interaction. We now
turn to the case where β>0, i.e., we suppose that seals, along
with fishers, exert some predation on the fish stock (Figures 5 to
9). Compared to the former simulations, those performed under this
hypothesis will help to assess the indirect impact of the reserve on the
398 BONCOEUR, ALBAN, GUYADER AND TH
´
EBAUD
0
100
200
300
400
500
600
700
800
900
1000
0 50 100 150 200 250 300
Fishing effort
Biomass
Fish
Seals
Fish when there is no predation by seals
FIGURE 5. Relation between fishing effort, fish biomass and seal biomass
(intrinsic growth rate of fish biomass is 0.3; mobility coefficient is 0.2; reserve
is 0.3; predation of fish by seals).
fishing industry (i.e., the consequences due to ecosystemic interactions),
as well as the impact of the reserve on ecotourism (seal watching).
Thedottedlineoneachfigurerecallsthesituationwhenthereisno
predation by seals (β =0).
Figures 5 and 6 illustrate the impact of the predator-prey relation
on biomasses and catches in relation to fishing effort, for a given
size of the reserve. The comparison between the dotted line and the
continuous line on Figure 5 shows that taking into account the prey-
predator relation lowers the level of equilibrium fish biomass for each
level of fishing effort. In particular, the SMBL is lower when the
predator-prey interaction is taken into account, and varies inversely
to the rate of predation by seals (see Appendix II for a demonstration).
However, the negative effect of the predator-prey interaction, which is
the consequence of predation by seals, becomes less important when
fishing effort grows, because the food shortage which this growth
induces for seals results in a decrease of their equilibrium stock (see
lower line on Figure 5).
Figure 6 illustrates how, under equilibrium conditions, the flow of
natural growth of the fish biomass is shared between fishermen and
seals, for various levels of fishing effort and for a given size of the
FISH, FISHERS, SEALS AND TOURISTS 399
0
10
20
30
40
50
60
70
80
0 50 100 150 200 250 300
Fishing effort
Catches and predation
Catches
Predation by seals
Catches + predation by seals
Catches when there is no predation by seals
FIGURE 6. Relation between fishing effort, catches and predation by seals
(intrinsic growth rate of fish biomass is 0.3; mobility coefficient is 0.2; reserve
is 0.3; predation of fish by seals).
reserve. The flow of predation by seals, which is equal to the total
flow of natural growth of the fish biomass when there is no fishing
effort, decreases both in absolute and relative terms when fishing effort
grows, making the competition for food tougher for seals, and thereby
diminishing their stock (see Figure 5). Figure 6 also shows that, for
any given level of effort, taking into account the prey-predator relation
results in lowering the level of equilibrium catches by fishermen.
Figures 7, 8 and 9 display some consequences of the prey-predator
interaction in relation to the size of reserve, for a given level of fishing
effort.
Figure 7 shows that the impact of this relation on the equilibrium fish
biomass is more important when the share of the reserve in the total
area is large. This is due to the fact that any increase in food abundance
(a consequence of increasing the reserve size with a given level of effort)
results in increasing the seal stock. Under the assumptions of the prey-
predator model used here, not only do seals eat more when there is
plenty of food, but they become more numerous
11
. While the predator-
prey interaction may be regarded as an unnecessary refinement of the
analysis in the case of a small α, this parameter becomes critical if the
relative size of the planned reserve is large, a condition which is often
400 BONCOEUR, ALBAN, GUYADER AND TH
´
EBAUD
0
100
200
300
400
500
600
700
800
900
1000
0% 10% 20% 30% 40% 50% 60% 70% 80% 90% 100%
Relative size of the reserve, as a percentage of total area
Bio
ma
ss
es
Fish
Seals
Fish when there is no predation by seals
FIGURE 7. Relation between relative size of the reserve and biomass levels
for a given level of fishing effort (intrinsic growth rate of fish biomass is 0.3;
mobility coefficient is 0.2; effort is 100; predation of fish by seals).
regarded as necessary if the reserve is meant to generate significant
impacts on the situation of the fishery (Lauck et al. [1996], Sladek
Nowlis and Roberts [1999]).
Figure 8 depicts the consequences in terms of flows. It shows that,
while the total flow of increase in fish biomass is a monotonically
growing function of the relative size of the reserve, for large values
of α this phenomenon benefits seals rather than fishers. Two factors
explain this feature: 1) the switch to a larger relative size of reserve
increases the seal stock (see Figure 7), while fishing effort is assumed
to be unchanged; 2) while fishermen respect the fishing ban inside the
reserve (also by assumption), seals ignore it and pursue their prey over
the whole area, whatever the level of α adopted by the fishery regulator.
Figure 9 translates the features displayed by Figure 8 in terms of
economic rent and illustrates the trade-off between the fishing indus-
try and ecotourism according to the relative size of reserve which is
adopted. It should be stressed that, because the values of parameters
are arbitrary (and in particular the prices and unit costs of each activ-
ity), the indications given by the figure are qualitative. The economic
parameters of the model have been fixed at levels such that the fishery
rent is zero when there is no reserve, and the break-even point for the
FISH, FISHERS, SEALS AND TOURISTS 401
0
10
20
30
40
50
60
0% 10% 20% 30% 40% 50% 60% 70% 80% 90% 100%
Relative size of the reserve, as a percentage of total area
Catches and predation
Catches
Predation by seals
Catches + predation by seals
Catches when there is no predation by seals
FIGURE 8. Relation between relative size of the reserve, catches and predation
by seals for a given level of fishing effort (intrinsic growth rate of fish biomass
is 0.3; mobility coefficient is 0.2; effort is 100).
-100
-50
0
50
100
150
0% 10% 20% 30% 40% 50% 60% 70% 80% 90% 100%
Relative size of the reserve, as a percentage of total area
Rents
Fishery rent
Ecotourism rent
Total rent (fishery + ecotourism)
Fishery rent when there is no predation by seals
FIGURE 9. Relation between relative size of the reserve and economic rents
for a given level of fishing effort (intrinsic growth rate of fish biomass is 0.3;
mobility coefficient is 0.2; fishing effort is 100; predation of fish by seals).
402 BONCOEUR, ALBAN, GUYADER AND TH
´
EBAUD
ecotourism industry corresponds to a 10% relative size of the reserve.
This case is of course just an example.
According to Figure 9, the steady-state rent derived from the fishery
increases with the relative size of the reserve, for an unchanged level
of effort, up to an α, between 30% and 40% of the total area in the
case illustrated here. This is the direct consequence of the increase in
catches (see Figure 8), which is itself the result of the increase in the
fish biomass protected by the reserve. However, beyond this level of α,
catches decrease because the net transfer of fish from the reserve is not
important enough to compensate for the negative impact of the decrease
in the size of the fishing zone. So does the fishery rent, the level of effort
and unit prices being unchanged by assumption. The comparison of
the fishery rent curve with the dotted line (fishery rent when β =0)
shows that, for any value of α, the predator-prey interaction reduces
the benefits of the reserve for fishers (the importance of this effect will
depend on the actual size of the impact of predation by seals on fish
biomass). At the same time, the growth in the seal stock generated
by a higher relative size of the reserve increases the opportunity of
making money through ecotourism. Unlike the relation between fishery
rent and α, the relation between ecotourism rent and α is monotonic
because: 1) the seal stock increases monotonically with α and 2) the
number of visits by ecotourists is assumed to be an increasing function
of the seal stock. As a result, the higher α is, the larger the gap is
between the total economic surplus generated by the marine reserve
and the fishery rent.
A corollary is that the optimal reserve size, according to a global cost-
benefit analysis, is larger than the one which looks optimal if fisheries
management is the only objective (within the interval between the two
corresponding α’s, the net marginal loss for the fishing industry induced
by an increase in the relative size of the reserve being lower, in absolute
value, than the corresponding net marginal gain for the ecotourism
industry). As long as the reserve size is kept below the level maximizing
fishery rent, any marginal increase in α benefits simultaneously both
activities (Pareto-improving change). Beyond this level, any further
increase in the reserve size will still improve overall efficiency of the
reserve, provided α is kept below the level maximizing global economic
surplus. However, this improvement will be realized to the detriment of
the fishing industry, which suggests that the fishing sectors might seek
FISH, FISHERS, SEALS AND TOURISTS 403
compensation of some sort for lost revenues. As such, policy makers
seeking to put marine reserves in place may need to be sensitive to
these losses, in order to enlist necessary support.
Conclusions. The aim of the simulation model presented in this
paper is to develop further insights into the economics of marine
reserves, from a multi-species perspective and taking into account non-
extractive uses of marine ecosystems. The complexity of ecosystemic
interactions is sometimes advocated for keeping up with monospecific
modeling because little advantage is expected from the integration
of trophic competition or predator-prey relations between stocks as
far as economic assessment of marine reserves is concerned (Holland
and Brazee [1996]). In some cases, however, multi-species modeling
is necessary to deal with the economic problem which is addressed.
A case in point is the situation where a marine reserve is planned
inside an area sheltering a stock of fish targeted by fishers and a stock
of predators which is protected by law from any extractive use, but
which may provide benefits from non extractive uses. Though based
on real world considerations (both as regards biology and institutions),
the model presented here does not pretend to entirely capture the
complexity of ecosystemic interactions at stake
12
. Moreover, due to
the arbitrary parameter values used in the simulations, the significance
of the conclusions which may be drawn from these simulations is mainly
qualitative. These conclusions may be summed up as follows:
1. The model supports the idea that implementing a marine reserve
in part of a highly fished fishery may constitute a second best solution
as regards fisheries management, in the case where the entry into the
fishery is limited but the regulator’s ability to lower fishing effort is
bounded by social/political constraints. This idea, which was put
forward by Holland and Brazee [1996] in a monospecific context, still
holds when the area is inhabited by a non-harvested stock of predators
competing for fish with fishers and taking advantage of the creation of
the reserve.
2. The predator-prey interaction results in lowering the benefits of
the reserve for fishers. This affects the steady-state fishery rent for any
given level of fishing effort, but also the expected results of the reserve
in terms of conservation effects, as the safe minimum fish biomass level
provided by the implementation of the reserve is reduced by the fish
404 BONCOEUR, ALBAN, GUYADER AND TH
´
EBAUD
mortality due to the unharvested stock of predators.
3. In the case where the stock of predators may be economically
valued by means of a non-extractive use (ecotourism), the implementa-
tion of the reserve generates additional incomes through this channel.
According to local circumstances, these extra incomes will partly or
totally offset the negative impact of the predator-prey interaction on
the fishery rent.
4. In this case the model suggests that the optimal relative size of
the reserve, from a global cost-benefit analysis point of view, is larger
than when only fishery rent is considered.
Conclusions 3 and 4 raise the issue of the distributional impact
of the reserve and of the possibility for fishers to participate in the
benefits generated by ecotourism. This issue could be addressed by
incorporating some relations into the model that depict more explicitly
the costs and benefits to fishers of diversifying their activity.
13
Appendix
I. The discrete time version of the model. A discrete time
version of the model was built for the sake of simulations. The
transition from the continuous to the discrete version rests on some
simplifying assumptions. Following Hannesson [1998] and Anderson
[2000], we assume that, for each period, natural growth and migration
of fish biomass take place after catches and are independent (they
are in fact treated as discrete jumps at the end of each period)
14
.
Moreover, we assume that catches by fishers and predation by seals
are simultaneous, and that the natural growth of seal biomass also
takes place at the end of each period. Under these assumptions, the
equations of the discrete time version of the model may be written as:
(1
) X
F 1(t+1)
=(X
F 1(t)
− Z
1(t)
).
1+r
F
.
1 −
X
F 1(t)
− Z
1(t)
α.X
F
max
− T
(t)
(2
)
X
F 2(t+1)
=(X
F 2(t)
− Z
2(t)
− Y
F (t)
)
.
1+r
F
.
1 −
X
F 2(t)
− Z
2(t)
− Y
F (t)
(1 − α).X
F
max
+ T
(t)
FISH, FISHERS, SEALS AND TOURISTS 405
(3
) X
S(t+1)
= X
S(t)
.
1+r
S
1 −
γ.X
S(t)
X
F 1(t)
+ X
F 2(t)
(4
) T
(t)
= σ.[(1 − α).(X
F 1(t)
− Z
1(t)
) − α.(X
F 2(t)
− Z
2(t)
− Y
F (t)
)]
(5
) Z
1(t)
= X
F 1(t)
.(1 − e
−β.X
S(t)
)
(6
)
Z
2(t)
=
β.X
S.(t)
β.X
S.(t)
+(q.E
F
/(1 − α).A)
.X
F 2(t)
.
1 − e
−β.X
S.(t)
−(q.E
F
/(1−α).A)
(7
)
Y
F (t)
=
(q.E
F
/(1 − α).A)
β.X
S.(t)
+(q.E
F
/(1 − α).A)
.X
F 2(t)
.
1 − e
−β.X
S.(t)
−(q.E
F
/(1−α).A)
(8
) Y
s(t)
= a.X
b
s(t)
.E
c
s
(9
) R
F (t)
= P
F
.Y
F (t)
− C
F
.E
F
(10
) R
S(t)
= P
S
.Y
S(t)
− C
S
.E
S
Endogenous variables:
X
Fi(t)
Fish biomass inside zone i (i=1, 2) at the beginning of period
[t; t +1[
X
S(t)
Seal biomass at the beginning of period [t; t +1[
Z
i(t)
Predation of fish by seals inside zone i (i =1, 2) during period
[t; t +1[
Y
F (t)
Catches of fish by fishers during period [t; t +1[
T (t) Net transfer of fish from zone 1 to zone 2 at the end of period
[t; t +1[
Y
S(t)
Seal watching visits during period [t; t +1[
R
j(t)
Rent generated by activity j (j =F, S) during period [t; t +1[
406 BONCOEUR, ALBAN, GUYADER AND TH
´
EBAUD
Exogenous variables and parameters:
r
j
intrinsic growth rate of biomass j (j =F, S )
X
Fmax
fish carrying capacity of the whole area (zones 1 and 2)
α share of the reserve in the whole area
A surface of the whole area
σ fish mobility coefficient
β predation coefficient
γ equilibrium ratio between fish biomass and seal biomass
q catchability coefficient
E
j
anthropic effort in activity j (j =F, S )
a dimension parameter of the ecotourism attraction function
b elasticity of visits with regard to the abundance of seals
c elasticity of visits with regard to the ecotourism attraction
effort
P
j
unit price of the product of activity j (j =F,S )
C
j
unit cost of effort devoted to activity j (j = F, S)
The simulations presented in the paper were based on the following
initial conditions and parameter values:
Initial conditions Values of parameters
and exogenous variables
X
F 1(t=0)
=0, 5.α.X
F max
r
F
=0,3
X
F 2(t=0)
=0, 5.(1−a).X
F max
r
S
=0, 1
X
S(t=0)
=0, 5.X
F max
/γ X
F max
= 1000
a =0to1
according to simulations
A =1
σ =0,2
β = 0,001
γ =10
q = 0,0025
FISH, FISHERS, SEALS AND TOURISTS 407
E
F
= 0 to 300
according to simulations
E
S
=1
a =1
b =0,8
c =0,2
P
F
=5
P
S
=6
C
F
=0,9
C
S
=60
II. The effect of the predator-prey interaction on the safe
minimum fish biomass level provided by the reserve. Joining
equations (1) and (9), we get the equilibrium condition of the fish
biomass inside the reserve:
(12) 0 = r
F
.X
F 1
.
1 −
X
F 1
α.X
F max
− T − β.X
F 1
.X
S
.
In the same way, joining equations (3) and (11) gives us the equilibrium
condition of seal biomass:
(13) 0 = 1 −
γ.X
s
X
F 1
+ X
F 2
⇐⇒ X
s
=
X
F 1
+ X
F 2
γ
.
Joining (12), (13) and (4), we then get:
(14)
−
−
r
F
α.X
F max
+
β
γ
.X
2
F 1
+
r
F
−σ.(1−α)−
β
γ
.X
F 2
.X
F 1
+σ.α.X
F 2
=0.
Solving this quadratic polynome in X
F 1
and selecting the relevant
solution gives the equilibrium relation between the two fractions of
the fish stock:
(15)
X
F 1
=
(r
F
− σ.(1 − α) − (β/γ).X
F 2
)
2((r
F
/α.X
F max
)+(β/γ))
+
(r
F
− σ.(1.− α)− (β/γ).X
F 2
)
2
+4.((r
F
/α.X
F max
)+(β/γ)).σ.α.X
F 2
2((r
F
/α.X
F max
)+(β/γ))
.
408 BONCOEUR, ALBAN, GUYADER AND TH
´
EBAUD
The fish SMBL is the equilibrium level X
∗
F 1
of fish biomass inside
the reserve which is observed when the fish biomass in the fishing zone
(X
F 2
) falls to zero, i.e.,
(16) X
∗
F 1
=
r
F
− σ.(1 − α)
(r
F
/(α.X
F max
)) + (β/γ)
.
In the particular case where β is equal to zero (no predation by seals),
the expression of the SMBL becomes:
(16a) X
∗
F 1
= α.X
F max
.
1 −
σ.(1 − α)
r
F
which is the expression obtained by Anderson [2000]. In the general
case (b ≥ 0), expression (16) shows that the SMBL is positive provided:
α>1 −
r
F
σ
a condition which is always satisfied in the case where σ ≤ r
F
,and
which is independent of the predator-prey interaction (parameters β
and γ). However, when the above condition is satisfied, the level of the
SMBL is a decreasing function of the ratio (β/γ), which means that
the predator-prey interaction has a negative impact on the protective
effect of the reserve, as regards fisheries management.
ENDNOTES
1. The case of direct competition for fish, which will be considered here, is not
the only type of interaction between marine mammals and fisheries (Beddington et
al. [1985], Trites et al. [1997]).
2. The choice of this example was motivated by a debate on such an issue in the
context of the forthcoming creation of a marine national park in the Iroise sea, a
coastal sea west of Brittany (France). This area is characterized by a great variety
of living marine resources (Hily et al. [1999]) and shelters a small colony of seals
which, local fishermen fear, might grow as a consequence of a fishing ban within
the limits of the park. On the other hand, this possible development is regarded as
an opportunity for new income in a region visited by many tourists (Anon. [1999]).
3. As in Hannesson [1998] and Anderson [2000], a discrete time version of the
model is also built for the purpose of simulations. See Appendix I.
FISH, FISHERS, SEALS AND TOURISTS 409
4. For the seal stock, we assume ubiquity over the whole area, i.e., we admit
that seals can move instantly from any part of this area to another and exert on
each substock of fish a predation which is proportional to its biomass. Therefore
no distinction is made between seals inside the reserve and seals inside the fishing
zone.
5. This hypothesis seems realistic as regards a number of inshore fisheries. In
France for instance, there is a general tendency for fisheries within the 12 NM
to have limited entry license systems, managed by fishers organizations under the
supervision of the state (Pennanguer et al. [2001]). When a limited entry license
system is introduced into a fishery, the aim is clearly to prevent any further increase
in fishing effort, and possibly to gradually decrease it. However, in practice this
decrease may only be achieved by attrition.
6. At present this assumption also looks realistic in the context of several
countries, including France. Non-extractive use value may be associated with a
non-use value (existence value), not taken into account here.
7. This is equivalent to assuming that fish migration depends on relative density
between the two areas: let A be the total surface of the area under survey,
(D
F 1
= X
F 1
/α.A)and(D
F 2
= X
F 2
/(1 − α).A) be the densities of fish in the
reserve and fishing zone respectively, then we get, from (4), T = s.(D
F 1
− D
F 2
),
with s = σ.α.(1 − α).A.
8. See the equations of the discrete time version of the model, the values of the
parameters and the initial values of the state variables in Appendix I.
9. The simulations presented in the paper were calculated with Excel, and
equilibrium was considered as reached after 50 periods.
10. The level of effort maximizing rent being systematically lower than the one
maximizing catches, as soon as the marginal cost of fishing effort is positive.
11. Joining equations (1), (2), (3) and (11) shows that, under equilibrium
conditions, predation by seals is proportional to the square of the fish biomass.
12. For instance, the global treatment of fish does not allow the model to deal
with the fact that, in most marine systems, the largest predators of fish are other
fish, not marine mammals. However, the reasons why we give a special treatment to
the seal-fish relation in the model are not biological, but institutional and economic:
we suppose that, as opposite to various fish stocks, marine mammals are protected
by law and may derive an economic value from non-extractive uses. These seem to
be realistic assumptions in a number of temperate inshore waters cases.
13. A preliminary investigation of this question was realized, in the Iroise Sea
case, by Boncoeur et al. [2000].
14. Anderson [2000] considers that they follow semi-continuous time processes
(each period being divided into a fishing time and a growth-and-migration time,
which makes it more difficult to consider growth and migration processes as
independent).
Acknowledgment. J.R. Wilson and two anonymous referees offered
helpful comments on previous drafts.
410 BONCOEUR, ALBAN, GUYADER AND TH
´
EBAUD
REFERENCES
M.T. Agardy [1993], Accommodating Ecotourism in Multiple Use Planning of
Coastal and Marine Protected Areas, Ocean Coastal Manage. 20, 219
239.
L.G. Anderson [2000], Marine Reserves: A Closer Look at What They Can
Accomplish, 10th Biennal Conference of IIFET (10-14 July, Corvallis, Oregon, USA).
Anon. [1994], An Assessment of Whale Watching in the United States,NMFS,
NOAA, Silver Spring, Md, USA.
Anon. [1999], Etude Economique des Activit´es Li´ees `alaMerd’Iroise,ADE-
UPA/Portances/SAFI, Brest, France (3 vols.).
J.R. Beddington, R.J.H. Beverton and D.M.G. Lavigne, eds. [1985], Marine
Mammals and Fisheries, Allen and Unwin, London, UK.
J. Boncoeur, ed. [2000], Activit´es Halieutiques et Activit´es R´ecr´eatives dans
le Cadre d’un Espace `aProt´eger: Le Cas du Parc National de la Mer d’Iroise
Programme National Environnement Cˆotier, rapport interm´ediaire 1`ere ann´ee,
UBO-CEDEM/IFREMER, Brest, France.
R. Buerger and J. Hill, et al. [2000], The Impact of Recreation on Barrier Island:
A Case Study on Masonboro Island, Coastal Manage. 28, 249
259.
D. Davis and V. Harriott, et al. [1995], Conflicts in a Marine Pro tected Area:
Scuba Divers, Economics, Ecology and Management in Julian Rocks Aquatic Re-
serve, Australian Parks and Recreation 31,29
35.
J.A. Dixon, et al. [1993], Meeting Ecological and Economic Goals: Marine Park
in the Caribbean,Ambio22, 117
125.
O. Flaaten [1989], The Economics of Predator-Prey Harvesting,inRights Based
Fishing (P.A. Neher et al., eds.), Kluwer Academic Publ., Dordrecht and Norwell,
MA, 485
503.
R. Hannesson [1998], Marine Reserves: What Would They Accomplish? Marine
Resource Econom. 13, 159
170.
C. Hily, et al. [1999], Environnement Naturel de l’Iroise, Bilan des Connais-
sances et Int´erˆet Patrimonial, Universit´e de Bretagne Occidentale/Minist`ere de
l’Am´enagement du Territoire et de l’Environnement, Brest, France (2 vols.).
P. Hoagland, Y. Kaoru and J.M. Broadus [1995], A Methodological Review
of Net Benefit Evaluation for Marine Reserves, The World Bank, Environment
Department, paper no. 027.
D.S. Holland and R.J. Brazee [1996], Marine Reserves for Fisheries Management,
Marine Resource Econom. 11, 157
171.
E. Hoyt [1995], The Worldwide Value and Extent of Whale Watching,Whaleand
Dolphin Protection Society, Bath, UK.
G.T. Hvenegaard [1997], The Social and Economic Aspects of Ecotourism, A
View Relevant to Whale Watching, Workshop on the Socioeconomics of Whale
Watching (8-12 December, Kaikoura, NZ).
R. Kenchington [1991], Tourism Development in the Great Barrier Reef Marine
Park, Ocean and Shoreline Manage. 15,57
78.
FISH, FISHERS, SEALS AND TOURISTS 411
T. Lauck, C.W. Clark, M. Mangel and G.R. Munro [1998], Implementing the
Precautionary Principle in Fisheries Management through Marine Reserves,Ecol.
Appl. 8 (Suppl. 1), S72
S78.
S.N. Murray, et al. [1999], No-Take Reserve Networks: Sustaining Fishery Popu-
lations and Marine Ecosystems, Fisheries Manage. 24,11
25.
S. Pennanguer, M. Le Tixerant and J. Boncoeur [2001], Zones `aAcc`es Inter-
dit ou Restreint pour la Pˆeche Professionnelle Fran¸caise, Cadre R´eglementaire et
Repr´esentation Spatiale, CEDEM/GEOSYSTEMES, Universit´edeBretagneOcci-
dentale, Brest, France.
N.V.C. Polunin, et al. [2000], Ecological and Social I mpacts in Planning Caribbean
Marine Reserves, Final Tech. Report R6783, DFID, University of Newcastle, UK.
J.N. Sanchirico and J.E. Wilen [1999], Bioeconomics of Spatial Exploitation in a
Patchy Environment, J. Environ. Econom. Manage. 37, 129
150.
N. Shackell and M.J.H. Willison, eds. [1995], Marine Protected Areas and Sustain-
able Fisheries, Science and Management of Protected Areas Association, Wolfville,
Nova Scotia, Canada.
J. Sladek Nowlis and C.M. Roberts [1999], Fisheries Benefits and Optimal Design
of Marine Reserve, Fishery Bull. 97, 604
616.
A. Trites, V. Christensen and D. Pauly [1997], Competition between Fisheries and
Marine Mammals for Prey and Primary Production in the Pacific Ocean,J.North
Atlantic Fish Sci. 22, 173
187.