Some recommendations to develop the market share, the case of ILA Vietnam in Hanoi = Một số giải pháp nhằm nâng cao thị phần, chi nhánh công ty ILA Vietnam tại Hà Nội
Bạn đang xem bản rút gọn của tài liệu. Xem và tải ngay bản đầy đủ của tài liệu tại đây (845.19 KB, 91 trang )
VIETNAM NATIONAL UNIVERSITY, HANOI
SCHOOL OF BUSINESS
Tran Thuy Linh
SOME RECOMMENDATIONS TO DEVELOP THE
MARKET SHARE, THE CASE OF ILA VIETNAM IN
HANOI
MASTER OF BUSINESS ADMINISTRATION THESIS
Hanoi - 2011
VIETNAM NATIONAL UNIVERSITY, HANOI
SCHOOL OF BUSINESS
Tran Thuy Linh
SOME RECOMMENDATIONS TO DEVELOP THE
MARKET SHARE, THE CASE OF ILA VIETNAM IN
HANOI
Major: Business Administration
Code: 60 34 05
MASTER OF BUSINESS ADMINISTRATION THESIS
Supervisor: Dr. Nguyen Thi Phi Nga
Hanoi - 2011
vi
TABLE OF CONTENTS
ACKNOWLEDGEMENTS i
ABSTRACT ii
TÓM TẮT iv
TABLE OF CONTENTS vi
LIST OF FIGURE viii
LIST OF TABLE ix
INTRODUCTION 1
1. Research Problem 1
2. Objective and aim of thesis 1
3. Scope and scale of thesis 2
4. Methodology 2
5. Data resources 2
CHAPTER 1: LITERATURE REVIEW 4
1.1 Market share 4
1.1.1. Definition 4
1.1.2 Ways to increase market share 5
1.2 Consumer decision making process 6
1.2.1 Information search 6
1.2.2 Source of information 8
1.2.3 Information search on the Internet 9
1.3 Customer Value, Satisfaction, and Loyalty 13
1.3.1. Customer Value 14
1.3.2. Total Customer Satisfaction 17
1.3.2.1. Customer expectation 18
1.3.2.2. Measuring Satisfaction 18
1.4.Marketing mix 19
1.4.1 The product 19
1.4.2 Promotion mix 27
1.4.2.1 Advertising 28
1.4.2.2 Sales promotion 31
vii
1.4.2.3 Public relation 33
1.4.3 Place 34
1.4.4 Price 39
CHAPTER 2: THE CASE OF ILA VIETNAM IN HANOI 41
2.1 Introduction 41
2.2. Business analysis 44
2.2.1. Analysis of visitor and sources of information channel 44
2.2.3. Product analysis and comparison. 47
2.2.3. New sales analysis 55
2.2.4. Re-enrolment and customers‟ loyalty analysis 57
2.2.5 Promotion mix analysis 58
2.2.6. Place 63
CHAPTER 3: CONCLUSION AND RECOMMENDATIONS 67
3.1 Conclusion 67
3.2 Recommendations 69
3.2.1 The information search on the Internet 69
3.2.2 Building Customer Value, Satisfaction, and Loyalty 70
3.2.3. Marketing mix 73
3.1 Product 73
3.2 Promotion mix 77
3.3. Place 81
REFERENCES 83
Appendix 85
viii
LIST OF FIGURE
Figure 1-1: Decision making process 6
Figure 1-2 Information sources for Purchase Decision. 8
Figure 1-3: Customer delivered value 14
Figure 1-4: Levels of product 20
Figure 1-5: The tangible-intangible continuum of goods and services 21
Figure 1-6: Steps in new product development process 23
Figure 1-7: Vertical marketing system model 36
Figure 2-1: Sales volume of ILA Vietnam in Hanoi since 2007 56
ix
LIST OF TABLE
Table 2-1: Number of visitor from 2008 to2010 45
Table 2-2: Sources of information that customer knew ILA from 45
Table 2-3: Programme, schedule and fee of English course in ILA Hanoi 48
Table 2-4: Programme, schedule and fee of English course in Apollo Centre 50
Table 2-5: Programme, schedule and fee of English course in Language Link 51
Table 2-6: Book using analysis 54
Table 2-7: The number of new sales volume 55
Table 2-8: Re-enrolment in ILA Hanoi 57
Table 2-9: The role of advertising is more critical in Hanoi 59
Table 2-10: Types of advertising and frequency 59
Table 2-11: Student statement by district and areas 64
1
INTRODUCTION
1. Research Problem
ILA Vietnam in Hochiminh City is a very famous English Training Centre.
Everyone can recommend friends and relatives to ILA to study when they are
asked. There are six training centres in HCMC, one in Vung Tau, one in Da Nang
and one in Hanoi.
The centre in Hanoi was established in 2007. This centre has a big problem with the
market share development. Although Hanoi Training centre has more than three
years running, it now still has negative profit.
The problem is that ILA Hanoi has to compete with many big competitors such as
Apollo, Language Link, ACET and British Council. Hanoians are familiar with
these centres and know little about ILA Vietnam. Besides, ILA still uses one
marketing strategy for both northern and southern area.
With those research problems, the thesis will be conducted with the purpose to
improve the market share then to get more profit for ILA Vietnam in Hanoi for the
period of 2011-2016. The objectives will include: Study the comments of
customers in Hanoi about ILA‟s products and marketing activities; analyse business
performance of ILA in Hanoi; find out the problems occurring in the Hanoi Centre;
and give the recommendations to develop the market share based on applying the
suitable marketing mix to Hanoi market.
2. Objective and aim of thesis
Those research problems will be discovered with the purpose to improve the market
share then to get more profit for ILA Vietnam in Hanoi for the period of 2011-2016.
The objectives will conclude:
- Study about marketing performance of ILA Hanoi
- Find out the problem occur in the ILA Language training centre in Hanoi
2
- Study comments of customers in Hanoi about ILA products and marketing
activities then build up the suitable marketing program to increase market
share.
- Give the recommendations to develop the market share
3. Scope and scale of thesis
This research will be conducted based on some major objects are:
- Current customers of ILA Vietnam in Hanoi
- Visit customers, students of University, secondary and high schools, parents
of primary students.
- Staffs and manager in Hanoi
4. Methodology
The thesis used some method of research such as surveys potential customers,
existing customers, ILA‟s staffs and analyse reports of the company. One hundred
customers were asked to collect information of their need in studying English and
the source of information that they used to find and select an English Training
centre. The company‟s reports were used to analyse the business performance such
as the sales number, the number of visitors and number of students. The existing
students were asked for their satisfaction on courses, customer services, books,
teachers, teaching assistants and if they would recommend their friends and
relatives. The comments of customers were used to measure the effectiveness of
marketing activities of ILA in Hanoi. The more suitable marketing strategy could
help ILA to attract more customers and expand its market share.
5. Data resources
The primary data was gathered from direct interviews and discussions with the
customers, students, visitors, parents of students, staffs and managers of ILA. The
3
second sources of the thesis was secondary data such as books, newspapers, internal
and external reports and the Internet
4
CHAPTER 1: LITERATURE REVIEW
The literature included theory of market share, ways to increase market share,
information search and building customer loyalty, marketing mix. This section will
start off by explaining the market share concepts.
1.1 Market share
1.1.1. Definition
There were some definitions of market share as the following:
"Market share is the percentage of a market (defined in terms of either units or
revenue) accounted for by a specific entity."
By Farris, Paul W.; Neil T. Bendle; Phillip E. Pfeifer; David J. Reibstein (2010).
Marketing Metrics: The Definitive Guide to Measuring Marketing Performance.
Another author of investopedia said that market share was the percentage of an
industry or market's total sales that was earned by a particular company over a
specified time period. According to this author, market share was calculated by
taking the company's sales over the period and dividing it by the total sales of the
industry over the same period. This metric was used to give a general idea of the
size of a company to its market and its competitors.
“Market share is the percentage of a company‟s sales of a particular product or
service in a given area. It can be calculated in terms of revenue or of units sold.”
By Author(s) from Penetrating.net
“In very simple terms, market share is the number of loyal customers your business
or company has been able to retain over a long period of time” by Tito Philip, Jnr.
It was quite different from other definition when mentioning the loyal customers.
This author thought that no one else but loyal customers were the real market share
of the companies.
5
Base on this definition, the author of the current thesis find out that to study
consumer behaviour to make them become loyal customers is one of the good way
to increase the market share. And it is the main content that the current thesis focus
on.
All these definition had different calculation but all had a same idea of the “pie” of
the maket “cake” that the company owned. The more important is how to increase
this “pie”.
1.1.2 Ways to increase market share
There were some ways to increase the market share as the following:
- Try to sell more to existing customer: encourage customer to buy more
product and higher frequency.
- Get old customer back: find the reasons why customer left: they did not need
this product anymore, the price was too expensive, customers were not
satisfied, customers changed to company‟s competitors…
- Try to sell effectively to similar customer by using data to telesales, send
mail, advertising, word-of-mouth…
- Use other channels to sell: direct sales, whole sales, online sales or e-
commerce
- Find the new market: at other province, other country
- Develop the new product for same market
There was risky and costly in some ways as the expansion required more capital and
staffs. It was reasonable for trying to understand existing customers in the same
market and let them to be loyal ones then try to sell them more. For this group of
customers, the company already had contact and relationship so it easier to find out
their sastifaction and how to make them be loyal. Even developing a new product
for the old market was still easier and less cost than for the new market.
In order to developing the market share for the company in the safer way, the
marketer had to study the customer need and customer buying process.
6
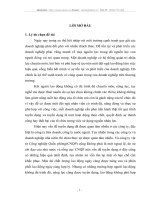
1.2 Consumer decision making process
Consumer decision making process had some states that presented in the figure 1-2
below. There were problems (need) recognition, information search, alternative
evaluation and selection, outlet selection and purchase and post-purchase processes.
The lowest level of purchase involvement was represented by nominal decisions: a
problem was recognized, long-term memory provides a single preferred brand, that
brand was purchased, and only limited post purchase evaluation occurs. As one
move from limited decision making toward extended decision making, information
search increases, alternative evaluation becomes more extensive and complex, post
purchase evaluation becomes more thorough.
Figure 1-1: Decision making process
In this thesis, the author would like using the theory of information search in
analysing the promotion mix so it was only information search stage focused.
1.2.1 Information search
After problems recognized, people often used internal and external search for
information that related to product or service. The internal search was included
long-term memory of satisfactory solutions, characteristics of potential solutions.
The external search were a price range, familiar manufactures, performance criteria,
etc…that could be limited because of one or two criteria.
Problems
(need)
recognition
Information
search
Alternative
evaluation
and selection
Outlet
selection and
purchase
Postpurchase
processes
7
For example, the fan of Ms Lan was broken down. She had to by a new fan for
summer using. Because the old fan was used for ten years so Ms Lan did not want
to change or find another brand. She went straight to Thong Nhat company to buy a
new fan with the same brand. In this case, the satisfaction of old product influenced
the decision of buying the new product without any search.
There were two example of source of information that consumer used in making
decision. The first example, one person had demand of toothpaste and she saw a
new product in the super market that had an attached tooth-brush. This person
bought the new product without searching for more new products because of the
added value. That decision was made by limited information search. The second
one was the case of a mother who wanted to by a new formula milk powder for her
child. She had to search for information of nutrition, the price, the samples of
children using the same product… the final decision was the product that had
cheaper price with the same nutrition. The mother of this example used external
information that included:
- The opinions, attitudes, behaviors, and feelings of friends, neighbours,
relatives, and increasingly strangers contacted on the internet.
- Professional information that was provided in articles, books, websites, and
personal contacts.
- Direct experiences with the product through inspection, trial, or observation.
- Marketer-generated information presented in advertisements, websites, and
displays and by sales personnel.
Deliberate external search also occurs in the absence of problem recognition.
Ongoing search is done both to acquire information for possible later use and
because the process itself is pleasurable. For example, individuals highly involved
with an activity such as tennis are apt to seek information about tennis-related
products on a going basis without a recognized problem with their existing tennis
equipment. This search could involve reading ads in tennis magazines, visiting
8
tennis equipment shop, observing professionals on television, or taking with and
observing fellow players and local professionals. These activities would provide the
individual both pleasure and information for future use.
1.2.2 Source of information
There were two main types of information sources: the internal and external. In
some example above, the source of information that the mother used was external
and the fan-buying-woman used internal information source. The source of
information could be:
- Memory of past searches, personal experiences, and low-involvement
learning.
- Personal sources, such as friends, family, and other.
- Independent sources, such as magazines, consumer groups, and government
agencies.
- Marketing sources, such as sales personnel, websites, and advertising.
- Experiential sources, such as inspection or product trial.
These sources were shown in Figure 1-4. Consumers decided how many and which
sources of information to use.
Figure 1-2 Information sources for Purchase Decision.
Information
sources
Internal
Information
Actively
acquired
Past
Searches
Personal
Experience
Passively
acquired
Low-involvement
learning
External
Information
Actively
acquired
Independent
groups
Personal
contacts
Marketer
information
Experiential
9
Consumers used internal information most of the time what was the primary source.
The internal information included past search and personal experience that actively
acquired. Beside of using internal source, customers also used information from an
external source, such as direct product experience, friends, or low-involvement
learning, marketer information or personal contacts.
Marketing messages were only one of five potential information sources, but these
activities influenced all sources because the characteristics and the distribution of
the products were available in the market. The customers received information from
non-marketing source because of the continuously marketing activities.
1.2.3 Information search on the Internet
The internet was a new consumer information search in the communication era. In
the nineteen century, one expert had a prediction that:
“The new is very good for consumers, not so good for companies and investors.
Within the near future, extraordinarily powerful price-and-quality search engines
and services are likely to have a significant impact on decision making process. For
a modest annual membership fee, Internet price-search services will be able to
identify the cheapest delivered large-dollar-ticket products or services available in
the word. In such product markets the readily informed consumer will be king, at
the click of a button.”
And bellows were some facts and figures about using the Internet and email, as well
as the social networks that Pingdom used many sources in the online world to write
the analysis. A lot of questions were made everyday such as how many sites have
been opened, how many people uses the internet or email etc…bellows are some
fact and figures that Pingdom.com had found:
107 trillion – Emails were sent in 2010.
294 billion – Emails were sent a day, on the average.
1.88 billion – the number of people using email all over the world
10
480 million – New email users counted from 2009
89.1% – Junk emails
262 billion – junk emails per day (suppose 89% emails were junk mail).
2.9 billion – Email accounts over the world
25% – Email accounts were organizational or company‟s one
Website
255 million – websites up to December 2010.
21.4 million – new website in 2010.
The Internet users
1.97 billion – over the world (up to June, 2010).
14% – higher than 2009.
825.1million – the Internet users in Asia.
475.1 million – the internet users in Europe.
266.2 million– The internet users in North American
204.7 million – the number of users in Latin America/ Caribbean
110.9 million – the number of users in Africa
63.2 million – the number of users in Mid-East
21.3 million – the number of users in Oceania countries
The social network
152 million – blogs (source: BlogPulse).
25 billion – “tweet” on Twitter in 2010.
100 million – new Twitter accounts in 2010.
175 million – new Twitter users in 9, 2010.
7.7 million – followers @ladygaga (Lady Gaga, Twitter).
600 million – Facebook‟s users in 2010.
250 million – new Facebook accounts in 2010.
30 billion – number of sharing (link, note, pictures…) on Facebook each month
70% – Facebook users out of American‟s border
20 million – Facebook‟s applicant had been set up each day
11
Video
2 billion – watched videos on Youtube each day
35 hours – duration of uploaded videos in one minute
186 –average number of online videos online watched by one person (in the USA)
84% – internet users who watched video online (in the USA)
14% – internet users uploaded videos (in the USA)
More than 2 billion –watched videos on Facebook each month
20 million – Video uploaded on Facebook each month
Image and picture
5 billion – on Flickr (up to 9, 2010).
More than 3000 – pictures that uploaded on Flickr each minute
130 million – picture uploaded on Flickr each month
30 billion – uploaded pictures on Facebook each month
36 million – pictures was uploaded on Facebook each year
Source: www.genk.vn
According to the above statistic, Asia had the highest number of the internet users
and the speed of development was more than 14%. Asia was a potential market for
doing business online. On the other hand, the social networks like Facebook or
twitter were developed quickly. Advertising on these websites was easier and more
often as company could have its own account. Vietnam had a highest growth rate,
according to a research of Cimego Company:
“With in key Asian countries, three different levels of internet penetration were
found. In developed Asian countries (South Korea, Japan, Singapore, Hong Kong,
Taiwan and Malaysia), internet usage is at 60-80%, with a slight year-to-year
increase. In Asian emerging markets (China, Vietnam, Philippines and Thailand),
internet penetration is around 20-30%, however internet growth rates per year are
much higher. In developing markets (Lao, Cambodia) or populous countries with a
large rural population (Indonesia, India), internet penetration is typically below
10% According to official sources, there are currently 27 million internet users in
12
Vietnam, which is more than in Thailand and Malaysia…Vietnam takes a unique
position in this respect. Vietnam is the fastest growing internet country in the region
and amongst the countries with the highest growth rates in the world. Since the year
2000, the number of internet users in Vietnam has multiplied by about 120. Ten
years ago, internet penetration in Vietnam lied far behind most other Asian
countries. In the meantime, Vietnam has caught up an internet usage has reached the
level of other key emerging markets”
Source: Cimigo, Vietnam NetCitizen Report, 2011.
According to the research, Vietnam had the big jump in the internet using growth
rate. Many of big corporations found Vietnam as a profitable market. Facebook and
google were the famous examples.
In general, internet search had become an important source of information in the
decision making process.
A home page or Internet presence site was a website developed and maintained by a
firm or another organization or individual that provides product and company data
or independent data from government and private sources. Based on a research of a
company on its home page there were 90% of people seeking product information,
and 88% of seeking company information, 30% of seeking for getting coupons or
discounts, and 23% of seeking for buying product.
How people knew the company website was also important. Consumers frequently
visited a company website because they saw it mentioned in traditional media:
Percentage visiting a website because they saw it mentioned in:
- Magazine/newspaper ad 71%
- TV ad 57%
- Product packaging 49%
- Radio ad 36%
- Direct mail 32%
- Billboard 22%
13
The data above showed that ads were factors that affected to rate of website visiting
times. For example, Apollo organised the English Olympic competition for Hanoi‟s
students. These advertisings of the company guided attendants to visit website for
the terms and conditions before registrations. The visiting rate of its website
increased 30 times than before the ads.
Consumers also met ads on the Internet while visiting general information, search,
and entertainment sites. These were banner ads that could take the consumer to the
company or product‟s home page or to a special advertisement i.e. in the same
Apollo‟s competition above, the company hired banner ad columns on the online
newspaper such as Hoahoctro online, Vnexpress.net, dantri.com etc … people saw
these ads could click on them to see more information.
The Internet also contains personal sources of information in chat rooms, forums or
in the brand review features associated with some shopping services. The very
famous shopping website Amazone.com had huge amount of personal source of
information.
In general, searching and using information from the Internet was going rapidly.
The consumers had a efficiency tool of searching information and they had more
chances to reach suitable product with better price. On the other hand, firms and
organizations had more channel to deliver advertisings and information to
customers.
1.3 Customer Value, Satisfaction, and Loyalty
Customer should be the top of the company and they were profit centre of every
company. It was not the manager who was most powerful but the customer.
Therefore, the company must find what customer value was, how to satisfy them,
how to make them become loyal.
14
1.3.1. Customer Value
In the era of communication and digital, consumers were more educated and
informed than ever, and they had the tools to verify some companies at the same
time and find out the best choice. Customers used to be value-maximizers, within
some criteria as product cost, using value. Customers would estimate which offer
could deliver the most value to choose it. Philip Kotler defined total customer
delivered value as the figure 1-3 bellow:
Figure 1-3: Customer delivered value
Total customer value
(Product, service, personal
and image values )
Minus
Total customer cost
(Money, time, energy and
psychic costs)
equals
Customer delivered value
(Profit to the customer)
As showed on the figure 1-3 customer delivered value was the difference between
the total customer value of all the benefits and all the costs of a product and service
that included not only money but also time, energy and psychic costs. For example,
customers who chose an education service like kindergarten or primary school had
to consider very much about choosing a good school with best service and suitable
price. However, good school was often had high school fee and low school fee
meant average service quality. The parents had to spend not only time but psychic
cost to find out the suitable one.
Total customer value was defined as the perceived monetary value of the package of
economic, functional, and psychological benefits customers expect from a product
and service.
15
Totala customer cost was defined as the total of costs customers expect to incur in
evaluating, obtaining, using, and disposing of the given market offering, including
monetary, time, energy, and psychic costs.
So, customer delivered value was based on the difference between what the
customer received and what were given for other different choices. The customer
received benefits and estimated costs. In order to have more customer received
value, the marketer could increase functional or emotional benefits and/or reduce
one or more of the various types of costs.
Value concepts could be applied on decision-making theory to gain success in
selling to customers. Companies could improve the offer in three ways. First, they
could increase total customer value by improving product, services, personnel,
and/or image benefits. Second, it could reduce the nonmonetary costs by reducing
the time, energy, and psychic costs. Third, it could reduce its product's monetary
cost to the buyer.
There was an example of buying washing machine that could explain the theory.
Vietnamese consumers used to familiar with Hitachi washing machine since the
nineteen century when the second-hand ones were used. They were also familiar
with Elextrolux washing machine due to the good quality and long term used. The
house wife wanted to buy a washing machine to replace the broken one. What brand
Hitachi or Elextrolux. Elextrolux had higher brand image benefit, long-term using
duration, less repair fee, higher evaluated quality and more sensitive of clothes
caring that Hitachi. How ever, the price of Hitachi machine was cheaper and the
functional modes were easier. Sales person of Elextrolux in the shopping mall tried
to persuade the house wife that their machine would deliver more value to her
because she could use the machine for longer time with less electricity and repair
costs. She could also call to hotline customer service for support for 24/7. The
customer recognized that Elextrolux‟s machine had more advantage than Hitachi‟s
one. However, she chose Hitachi washing machine as she compared the two prices
16
and the difference was higher than the total extra value that she could receive from
Elextrolux.
Assumed that customer evaluated Elextrolux‟s price was 15 million dong and the
cost to produce and sell was 10 million dong. It meant the difference between price
and cost could be 5 million dong, so Elextrolux needed to charge a price between 15
and 10 million dong. If the company charged less than 10 million dong, it won't
cover its costs. If the company charged more than 15 million dong, it could price
itself out of the market. In order to gain the sales, Elextrolux could price the product
that created more customer value than the competitor ones. Other wise, the sales
person of Elextrolux could explain to buyer in some potential options
- If the wanted to buy at the lowest price. The sales person tasks were to convince
the buyer's manager that buying on price alone would result in lower long-term
profits.
- The salesperson's task was to convince other people in the customer family that
Elextrolux‟s product could deliver greater customer value.
- The other product operation needed higher water level and electricity cost.
Through this example, the conclusion was that consumers made choices that gave
more weight to their personal benefit than to the company's benefit in some
occations.
Customer received value was a useful framework that applied to many situations.
There were steps for sales person to apply this framework: first, the sales person
must explore how the customer perceived value and cost, including all the
competitors proposals. Second, after receiving the result of measurement and the
product or service was at the disadvantage position, the salesman had two
alternatives: to increase total customer value or to decrease total customer cost.
They could increase total customer value by strengthening offer's product, services,
personnel, and image benefits. If increase value did not work, they could find the
17
company support in reducing the buyer's costs by lowew the price, simplifying the
ordering and delivery process, or offering a warranty.
Consumers had many level of loyalty to specific brands, stores, and companies. For
example, people in the north of Vietnam were loyal to Honda motorbike. The
reason was the high customer value. Motorbikes of Honda were popular in Vietnam
due to easy using, cheaper replacements of broken parts, long-time using duration
easy reselling etc… the company built a strong competitive advantage in
comparing with later competitors by their high customer value.
1.3.2. Total Customer Satisfaction
Philip Kotler and his colledges built a theory of customer satisfaction. In this
theory, these authors defined that the buyer‟s satisfaction after purchase depended
on the offer's performance in relation to the buyer's expectations. They said that:
“In general, satisfaction was a person's feelings of pleasure or disappointment
resulting from comparing a product's perceived performance (or outcome) in
relation to his or her expectations. If the performance falls short of expectations, the
customer is dissatisfied. If the performance matches the expectations, the customer
is satisfied. If the performance exceeds expectations, the customer is highly satisfied
or delighted.”
The companies had to face trade-off when trying to create higher customer
satisfaction because if the company increased customer satisfaction by lowering its
price or increasing its services, the result might be lower profits. Most of companies
chose increasing profit by earnings than satisfaction. Because companies has many
stakeholders, including employees, dealers, suppliers, and stockholders, they might
prefer increasing their value than customers‟s satisfaction. Thus, most of the cases,
the company chose a suitable level than high level of customer satisfaction.
18
1.3.2.1. Customer expectation
Customers‟ expectations were the most important factor in customer‟s satisfaction.
Customers often used their experience buying in the past, the advices from their
friend and relatives and promises from marketers and competitors to build their
expectations. In case the marketers raised expectations too high, the buyer could be
disappointed. In the contrast, if the company set low expectations than the
competitors, it won't attract enough buyers. The company had to raise expectations
and then deliver good performances to match and gain success.
1.3.2.2. Measuring Satisfaction
Measuring customer satisfaction were important to business and needed to maintain
regularly. Customer satisfaction servey had to be done regularly once a month or
once per year, depend on the product and service that supplied. It was the way to
keep customer to be loyal with the company. The higher level of satisfaction, the
longer customer staying with the brand or company. Since the customer satisfied
with brand, they could buy more, upgrade products, spread out the good comments
about brand, careless about price etc… However, it happened differently on each
level of satisfaction. The lowest level of satisfaction, the least level of loyalty
customer. This group of customer might change to use other brand. The middle
level of satisfaction customer was loyal than the first one but still changed if they
could receive higher value. The highest satisfied customers were most loyal and
said good word of mounth about company and brand.
By doing servey of customer satisfaction, companies could investigate the
competitor‟s sittuation by calling stop customers who had bought others products.
For customer satisfaction surveys, it was important that companies asked the right
questions. One important question was: "Would you recommend this product or
service to a friend?". The servey questions could focus on brand image, pricing, and
product features that could be controlled and measured.
19
In order to have good word of mouth, the company had to put customer in the
centre of every goal and customer satisfaction had to the goal and the marketing
tool. There was no other way than had good product and service quality to get
customer satisfaction. Quality was the totality of features and characteristics of a
product or service that bear on its ability to satisfy stated or implied needs.
The comsumer analysis of satisfaction and expectation was aimed to build a strong
marketing mix for companies. The author would discuss about three important
factors of marketing mix to the company in the next part.
1.4.Marketing mix
1.4.1 The product
Product was the first and the important element of marketing mix. It defined what
company was doing or selling. In the book “Principles of Marketing” Kortler and
his colleagues pointed out the concept of “product” and the relevant theory about it.
In this thesis, the author chose some criteria that needed for the company to apply in
analysis. In the book, Kortler said that:
“Product is anything that can be offered to a market for attention, acquisition, use or
consumption that might satisfy a want or need. It includes physical objects,
services, persons, places, organisations and ideas.”
In this definition, he mentioned not only tangible goods but also the services or
intangible things like ideas.
Services were considered as a special product. They were activities, benefits or
satisfactions that were offered for sale. Services were essentially intangible and do
not result in the ownership of any thing, he wrote.
In order to understand why customers were buying products, the companies had to
know well about three level of product. They were:
Core product: The problem-solving services or core benefits that consumers
were really buying when they obtain a product.