Strategy for exporting Vietnamese natural rubber to Chinese market in the period of 2010 - 2020
Bạn đang xem bản rút gọn của tài liệu. Xem và tải ngay bản đầy đủ của tài liệu tại đây (1.48 MB, 122 trang )
STRATEGY FOR EXPORTING VIETNAMESE
NATURAL RUBBER TO CHINESE MARKET
IN THE PERIOD OF 2010 - 2020
IN THE PERIOD OF 2010 - 2020
CAPSTONE PROJECT REPORT
Ho Chi Minh City
Group No.: 3
Dang Thi Bich Lan
Nguyen Hai Minh
Nguyen Vo Thanh Huy
Do Viet Nam
Trinh Minh Thanh
Class: GaMBA01.C03
Class: GaMBA01.C03 CAPSTONE PROJECT
Group N
0
_ 03
a
TABLE OF CONTENTS
FOREWORD
PREAMBLE
GENERAL INTRODUCTION
CHAPTER 1: THEORETICAL BASIS
1.1. Benefits of strategic management
1.1.1.1. Some definitions of strategic management
1.1.1.2. Tasks of strategic management
1.1.1.3. Benefits of strategic management
1.2. Theoretical models highly applied in new market analysis and
market penetration.
1.1.2.1. Five forces model of M. Porter.
1.1.2.2. SWOT matrix
1.1.2.3 Competitive Profile matrix
1.3. Theoretical models about marketing management in rubber
industry and technical barriers to trade in rubber market, business
culture issues, logistics issues and supplying chain
1.1.3.1. 4P marketing model
1.1.3.2. Technical barriers to trade
1.1.3.3. Business culture issues
1.1.3.4. Logistics issues and supplying chain
CHAPTER 2 : REAL SITUATION ANALYSIS
2.1. Vietnamese natural rubber production and export situation in recent
years :
2.1.1. Natural rubber production situation of Vietnam
2.1.1.1. Area
2.1.1.2. Cultivation technology - Engineering
1
3
3
6
6
6
6
6
7
7
7
11
12
12
12
14
15
15
19
19
19
Class: GaMBA01.C03 CAPSTONE PROJECT
Group N
0
_ 03
b
2.1.1.3. Productivity and production yield
2.1.1.4. Production cost
2.1.1.5. Financial scale and capacity of enterprises in the sector
2.1.1.6. Preliminary treated natural rubber production structure. .
2.1.1.7. The management of natural rubber quality
2.1.2. Natural rubber export situation of our country in recent years
2.1.2.1. Yield and export turnover
2.1.2.2. Structure of export markets
2.1.2.3. The structure of export products
2.1.2.4. Export prices
2.1.2.5. Trade conditions
2.1.2.6. Competitive capacity
2.1.2.7. Contribution of natural rubber export to social economy
2.1.3 Evaluate factors affecting on the production and export of
Vietnamese natural rubber products in recent years - combined
application of impacts in block diamond model of M. Porter.
2.1.3.1. Export market
2.1.3.2. Competitors
2.1.3.3. Substitutes
2.1.3.4. Peripheral factors
2.1.3.5. Government’s support
2.2. Analysis of export situation of Vietnamese natural rubber into
Chinese market from 2005 to the beginning of 2010
2.2.1. China is a key export market of Vietnamese natural rubber
2.2.1.1. General overview of Chinese natural rubber market
2.2.1.2. Demand for natural rubber of Chinese market
2.2.1.3. Supply for natural rubber of Chinese market
2.2.1.4. China - a key export market of Vietnam natural rubber
2.2.1.5. Vietnamese natural market can increase market share in
19
22
22
25
25
25
26
26
26
29
30
31
33
33
35
35
35
37
37
39
40
41
41
41
42
43
Class: GaMBA01.C03 CAPSTONE PROJECT
Group N
0
_ 03
c
China
2.2.2. Export situation of Vietnam’s natural rubber to Chinese market
from 2005 to the beginning of 2010
2.2.2.1. Yield and export turnover
2.2.2.2. Structure and type of export products
2.2.2.3. Export price
2.2.2.4. Quality of export product
2.2.2.5. Payment method
2.2.2.6. Export methods
2.2.2.7. Strategy of promotion and building trademark
2.2.2.8. Competiveness capacity
2.2.3. General judgment on export situation of Vietnamese natural
rubber to Chinese market in the period of 2005 – the beginning of 2010
2.2.3.1. Result
2.2.3.2. Existing drawbacks
2.3. Analysis of marketing model, logistics, supply chain and other issues
relating to geography and politics between Vietnam and China
2.3.1. 4P model
2.3.1.1. PRODUCT
2.3.1.2. PRICE
2.3.1.3. PLACE
2.3.1.4. PROMOTION
2.3.2. Logistic issues for Vietnamese natural rubber export into Chinese
market
2.3.3. Problems in rubber export supply chain into Chinese market
2.3.4. Issues related to technique barriers
2.3.4.1. Technical barriers to Vietnamese natural rubber export
into Chinese market
2.3.4.2. Export tariff barriers to natural rubber into Chinese
46
47
48
48
50
50
51
52
54
55
55
57
57
58
59
59
59
61
61
62
63
64
66
Class: GaMBA01.C03 CAPSTONE PROJECT
Group N
0
_ 03
d
market
2.3.4.3. Advantages, disadvantages of main line and small line
rubber export into Chinese market
2.4. Chinese natural rubber market situation forecast
2.4.1. Consumption demand and domestic supply capacity
2.4.1.1. Consumption demand
2.4.1.2. Domestic supply capacity
2.4.2. Import demand and supplying capacity from natural rubber
exporting countries into Chinese market
2.5. Prospect for enhancing Vietnamese natural rubber export in to
Chinese market in the period 2010 – 2020
2.5.1. Demand of Chinese market for Vietnamese natural rubber
2.5.2. Development potential of domestic natural rubber production
meets the demand of Chinese market
2.5.2.1. Supply source potential
2.5.2.2. Prospect for stabilizing export price
2.5.3. SWOT analysis when exporting Vietnamese natural rubber into
Chinese market in the period 2010 – 2020
CHAPTER 3 : SOME SOLUTIONS AND RECOMMENDATIONS
FOR ELABORATING STRATEGY OF EXPORTING
VIETNAMESE NATURAL RUBBER TO CHINESE MARKET IN
THE PERIOD OF 2010-2020
3.1. Several proposed solutions for raising export turnover of Vietnam
natural rubber to Chinese market in the period of 2010-2020
3.1.1. Solution group for improving export
3.1.1.1. Increase cultivated area
3.1.1.2. Raise production capacity
3.1.1.3. Gathering stable goods source serving for exporting to
66
67
69
70
71
71
71
72
74
74
74
74
76
78
81
81
81
81
Class: GaMBA01.C03 CAPSTONE PROJECT
Group N
0
_ 03
e
China
3.1.1.4. Strengthen trade promotion, actively approach and build
up partner relationship with Chinese customers
3.1.1.5. Change product structure according to Chinese market
demand
3.1.1.6. Complete payment process
3.1.1.7. Participate in payment risk insurance
3.1.2. Solution group of improving and increasing export price
3.1.2.1. Improve export product quality
3.1.2.2. Build, register and broadcast brand
3.1.2.3. Adjust export type
3.1.2.4. Establish bonded warehouse to store export goods near
border gate region
3.1.2.5. Industry integration.
3.1.2.6. Participate in export exchange rate insurance
3.1.3. Solution group of support
3.1.3.1. Develop human resources
3.1.3.2. Enhance monitoring and forecasting Chinese market
situation
3.2. Some proposed petitions
3.2.1. For the State
3.2.2. For industry management agencies
3.2.3. For Vietnamese Rubber Association
CONCLUSION
REFERENCES
81
82
82
83
84
84
85
85
86
87
87
87
88
89
89
90
91
91
92
92
94
97
Class: GaMBA01.C03 CAPSTONE PROJECT
Group N
0
_ 03
f
ABBREVIATED TERMINOLOGIES
Terms
English explanation
ANRPC
Association of Natural Rubber Producing Countries
ARBC
ASEAN Rubber Business Council
ASEAN
Association of Southeast Asia Nations
CAIA
China Automotive Industry Association
CNY
Chinese Yuan
CRIA
China Rubber Industry Association
FAO
Food and Agriculture Organization
GAPKINDO
Rubber Association of Indonesia
GDP
Gross Domestic Product
IMF
International Monetary Fund
IRCo
International Rubber Consortium Limited
IRSG
International Rubber Study Group
KNXK
Export turnover
L/C
Letter of Credit
MREPC
Malaysian Rubber Export Promotion Council
NN&PTNT
Rural and Agriculture Development
OPEC
The Organization of the petroleum Exporting Countries
RRIV
Rubber Research Institute of Vietnam
SFE
Shanghai Futures Exchange
SICOM
Singapore Commodities Exchange
SWOT
Strengths, Weaknesses, Opportunities, Threats
TOCOM
Tokyo Commodities Exchange
TSNR/SR
Technically Specified Natural Rubber/ Standard Rubber
TTR
Telegraphic Transfer Reimbursement
USD
United State Dollar
Class: GaMBA01.C03 CAPSTONE PROJECT
Group N
0
_ 03
g
VILAS
Vietnam Laboratory Accreditation Scheme
VRA
Vietnam Rubber Association
VRG
Vietnam Rubber Group
WTO
World Trade Organization
Class: GaMBA01.C03 CAPSTONE PROJECT
Group N
0
_ 03
h
LIST OF TABLES, FIGURES AND CHARTS
LIST OF TABLES:
Table 2.1: Vietnamese natural rubber growing area, 2001 - 2009
Table 2.2: Proportion area of small and large rubber plantation of Vietnam
Table 2.3: The average annual productivity of natural rubber industry in
several major rubbers growing countries in the world period 2003 - 2009
and estimated in 2010
Table 2.4: Vietnamese natural rubber yield in the period 2001 – 2009
Table 2.5: Volume and Vietnamese natural rubber export turnover, 2002 –
2009
Table 2.6: Comparison of five leading markets of Vietnamese natural
rubber export turnover in 2008 – 2009.
Table 2.7: Statistic data for natural rubber yield in major producing
countries in the period 2005 – 2009.
Table 2.8: International rubber consumption in the period 2005 – 2009
Table 2.9: Natural rubber consumption of China and the World
Table 2.10: Types of natural rubber classified according to use purpose in
China
Table 2.11: Production of natural rubber in China, 2004 -2009
Table 2.12: Yield and export turnover of Vietnam natural rubber to
Chinese market in period of 2005 – the first quarter of 2010
Table 2.13: Some main types of Vietnam natural rubber exporting to
Chinese in period of 2007-2009
Table 2.14: Forecasting natural rubber consumption and domestic supply
in China until 2020
Table 2.15: Natural rubber yield forecast of major producing countries
until 2020
Table 2.16: Rubber development planning until 2020
20
21
23
24
27
29
37
38
42
43
44
49
50
71
73
76
Class: GaMBA01.C03 CAPSTONE PROJECT
Group N
0
_ 03
i
LIST OF FIGURES:
Figure 1.1: Michael Porter’s five forces model
Figure 1.2: SWOT model
Figure 1.3: Theoretical model of marketing 4Ps
Figure 1.4: Logistics description in a company
Figure 1.5: Integrated supplying chain
Figure 2.1: Logistic procedures to export rubber into China
Figure 2.2: Rubber export supply chain procedure
LIST OF CHARTS:
Chart 2.1: Total rubber area in Vietnam in the period 2001 – 2009
Chart 2.2: Proportion area of small and large rubber plantation of
Vietnam, 2001 – 2009
Chart 2.3: Vietnamese natural rubber yield in the period 2001 – 2009
Chart 2.4: Scale and growing rate of yield and export turnover of
Vietnamese natural rubber in the period 2002 - 2009
Chart 2.5: Structure of Vietnamese exporting market in 2009 according to
export turnover
Chart 2.6: Structure of Vietnamese natural rubber products exported in
2009
Chart 2.7: Price of natural rubber in the world market and export price of
Vietnam in the period 2004-2009
Chart 2.8: Natural rubber and synthetic rubber consumption rate from
2005 – 9/2009
Chart 2.9: Consumption – import of natural rubber in China from 2004 to
2009
Chart 2.10: Market share of Chinese market in export of Vietnamese
natural rubber from 2000 to the first quarter of 2010
8
11
14
16
17
63
64
20
21
24
28
30
31
32
38
45
46
Class: GaMBA01.C03 CAPSTONE PROJECT
Group N
0
_ 03
j
Chart 2.11: Yield and export turnover of Vietnam natural rubber to
Chinese market in period of 2005 – the first quarter of 2010.
Chart 2.12: Average export price of Vietnamese natural rubber to China
in the period of 2005 to the first quarter 2010
Chart 2.13: Type structure of rubber product
49
51
60
Class: GaMBA01.C03 CAPSTONE PROJECT
Group N
0
_ 03
1
FOREWORD
Globalization and regionalization, integration with world economy has
become inevitable trend today. In the context of open and global economy
integration, Vietnam has actively shifted and asserted their integration into the
world economy, particularly in the field of trade. Prominent point is the event on 7
th
November 2006, Vietnam was officially admitted as 150th member of the World
Trade Organization (WTO) and on 11
th
February 2007, Vietnam became an official
member of this organization.
In order to create ways to develop our country’s economy under market
mechanism, development of export-oriented agriculture, foreign trade development
and expansion of economic cooperation, scientific and technical cooperation with
other countries, strongly increasing export turnovers to the country is one of the
main objective factors. Identify agricultural products export strength of Vietnam is
natural rubber, one of the agricultural products which brought the largest turnover to
Vietnam Vietnam today is one of the five leading major rubber exporting countries
in the world, in which natural rubber yield exported to China accounted for about
65%. Aware that China is a potential market for exports of natural rubber, with
geographical conditions advantages with shared borders, populated market, large
demand, easygoing and diversified market. However, besides there are still
difficulties for natural rubber in Vietnam such as export turnover does not match the
potentials, not take full advantage of our strength and mainly raw materials export
structure, low added value , weaknesses in management, administration, quality
control, active in business activities is low, small quota export accounting for large
proportion
To enhance the value and position for natural rubber export in Vietnam, Group
03 of Gamba01.C03 class has forcibly researched, analyzed and constructed the
project " Strategy for exporting Vietnamese natural rubber to Chinese market in the
period 2010-2020 " with the desire to contribute to promoting Vietnamese natural
Class: GaMBA01.C03 CAPSTONE PROJECT
Group N
0
_ 03
2
rubber export into China, a potential market, limiting risks, and bringing the highest
efficiency for Vietnamese rubber industry.
Due to limited knowledge and time for study, research, market survey, there
are certain difficulties so our capstone project is inevitable to have shortcoming. In
the spirit of good will, we do expect to have the contributions from teachers and
fellows.
Group number 3, class Gamba01.C03 would like to sincerely thank teachers in
the Capstone Committee and teachers who have dedicated teaching and helping us
during MBA course and in the process of completing this project.
Class: Gamba01.C03
Group: N
0
03
Nguyen Vo Thanh Huy
Dang Thi Bich Lan
Nguyen Hai Minh
Do Viet Nam
Trinh Minh Thanh
Class: GaMBA01.C03 CAPSTONE PROJECT
Group N
0
_ 03
3
PREAMBLE
GENERAL INTRODUCTION
1. The necessity to implement project research:
In the learning process, MBA students have been training a lot of knowledge
about business administration field. With gained knowledge, combining with
learning, studying relevant documents in business administration field has provided
each student in MBA course a new perspective and a scientific approach in solving
problems arising from actual production and business.
The field that Group 3 chose in the graduation capstone is building strategies
for natural rubber exports from Vietnam to Chinese market. China is now the
largest natural rubber import market all over the world and the leading natural
rubber export market of Vietnam (accounting for 65% of total turnover and meet
about 13% - 14% of Chinese market). The natural rubber consumption growth rate
of this huge market is predicted to continue increasing next time, especially, when
automobile industry of this country becomes a bright spot in the world market. On
the other hand, China has occupied “controlling” rate in market structure and export
turnover of Vietnamese natural rubber which is also a potential factor with risks for
this sector.
Since then, an urgent requirement has been set in researching solutions to
exploit potentials as well as reducing necessary risks to maintain and improve
Vietnamese natural rubber export to this primary and promising market.
2. Research purpose:
By this research our group would like to contribute ideas to help Vietnamese
natural rubber have a look at different angles on strategic issues, to develop
strategies to enhance the export of natural rubber in Vietnam into Chinese market in
the period 2010 - 2020
Class: GaMBA01.C03 CAPSTONE PROJECT
Group N
0
_ 03
4
3. Research methodology:
To implement the project “Strategy for Exporting Vietnamese natural rubber
to Chinese market in the period 2010 – 2020”, our group has agreed to use data
survey method, then basing on theoretical argument which we have been learned to
analyze and give comments, reviews and recommendations.
3.1. Ideal basis of the method
Comprehensive views, specific historical opinions and development opinions
of philosophy dialectical materialism of Marxist - Leninist are applied to the line of
thought of Vietnam.
3.2. Detailed research method
Collect secondary data from reference books, academic journals, report analysis and
articles, combined with analysis, statistics, comparison, interpretation methods to
increase persuasion and practical application values of the project.
3.3. Theoretical basis for choosing research method:
Purpose of gathering documents and research materials is an important work
which is required for any scientific research activity. Researchers and scientists
always read before searching for documents as the basis for scientific research. This
is a valuable source of knowledge accumulated through historical research process
for long time. Therefore, the purpose of data collection and research materials are
to:
- Help people to understand the research methodology of the studies
conducted previously.
- Make clear for their research.
- Help researcher to have more closely research methodology or
arguments.
- Have more extensive knowledge in the field under study.
- Avoid duplication with previous studies; therefore, take less time,
effort and finances.
- Help to build research arguments (evidence) to prove theory of
Class: GaMBA01.C03 CAPSTONE PROJECT
Group N
0
_ 03
5
scientific research.
4. Structure of the Capstone:
Structure of the Capstone is designed as following:
Preamble: General Introduction
Chapter 1: Theory
Chapter 2: Actual situation analysis
Chapter 3: Some recommendations and solutions to build Vietnamese
natural rubber export strategy in the period 2010 – 2020
Class: GaMBA01.C03 CAPSTONE PROJECT
Group N
0
_ 03
6
CHAPTER 1
THEORETICAL BASIS
1.1. Benefits of strategic management
1.1.1.1 . Some definitions of strategic management
- According to Michael Porter (1996):
Strategy is harmony creation among activities of a company. The success of a
strategy is mainly based on well implementing of many things and combining
them together the core of strategy is choosing what not to do". With this
approach, the strategy is to create differentiation in competition, find and implement
what not to do. The essence of strategy is to build competitive advantages;
strategies exist only in unique activities. Strategy is to build unique position and
have value to impact on a different activities group.
- According to Fredr. David:
Strategic management can be defined as an art and establishing science,
implementing and evaluating decisions related to a lot of functions which allow an
organization to achieve its goals.
1.1.1.2. Tasks of strategic management
Strategic management helps businesses to clearly orient strategic vision,
mission (tasks) and their goals. Indeed, if organizations want strategic management
to be effective, they must manage information systems in business
environment, basing on that, administrators can predict changing trends of the
business environment and identify where the business should go in the future, what
needs to be done to achieve long term results. The perception of desired results and
goals in the future helps managers and employees to understand what needs to be
done to achieve success and create mutual understanding between managers and
employees then they will effort to achieve their desire. This will encourage both of
them to gain short term achievements in order to improve long-term interests of
businesses.
Class: GaMBA01.C03 CAPSTONE PROJECT
Group N
0
_ 03
7
1.1.1.3. Benefits of strategic management
Strategic management helps businesses to have good strategies all the time,
adapt to the environment.
Strategic management helps businesses to be active in making decisions to
exploit opportunities in time and prevent or limit risks in external environment,
promote strengths and reduce weaknesses in internal business.
Strategic management helps businesses achieve higher efficiency in
comparison with no management.
1.2 Theoretical models highly applied in new market analysis and market
penetration
1.1.2.1. Five forces model of M. Porter
Porter's Five Forces model was first published in Harvard Business Review
magazine in 1979 with the content of studying elements to create profit in business.
This model is commonly known as "Porter's Five Forces" which is considered as
useful and effective tool to find out the origins of profit. More importantly, this
model offers competitive strategies to help business to maintain or increase profits.
Businesses often use this model to analyze whether they should join a certain
market, operate in a market or not. However, because of today’s business
environment has the sense of “dynamic”, then this model is applied to search in a
certain industry to find out sectors need to be improved to generate more profit.
According to Michael Porter, intensity of competition in the market in any
industry affected by five competitive forces as following:
Class: GaMBA01.C03 CAPSTONE PROJECT
Group N
0
_ 03
8
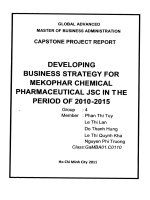
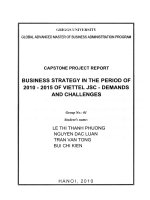
Source: www.smartkpis.com
Figure 1.1: Michael Porter’s five forces model
Five competitive forces analysis
1. Degree of Rivalry
In the traditional economic model, competition between rival businesses
push profit to approach number 0, but in the competition today, businesses are
not so naive to accept passively prices. In fact, firms are trying to get competitive
advantage over their competitors. Competition intensity varies depending on
each sector, and strategic analysts are interested in such differences.
Economists assess competitive capacity according to the indicators of the
level of that sector concentration, and concentration ration (Concentration ration -
CR) is one of the indicators which must be mentioned first. This indicator shows
percentage of market share hold by the four largest firms in that sector. There is also
a CR index of market rates controlled by 8, 25 and 50 leading companies in that
sector.
If the level of competition between firms in an industry is low, then that
sector is considered to be “disciplined”. This discipline may result from
competition in history, role of the leading firms, or compliance with common
Class: GaMBA01.C03 CAPSTONE PROJECT
Group N
0
_ 03
9
ethical standards. Collusion among companies is generally illegal. In sectors
with low levels of competition, competitive behaviors are certainly limited
unofficially. However, a company does not agree to comply with rules that seeks
competitive advantage can lose that "disciplined" market
When a rival acts in a way that makes others be forced to retaliate, then
competition in that market will increase. Intensity of competition is often described
as brutal, strong, moderate, or weak, depending on how firms’ efforts to win the
competitive advantages market will increase.
2. Threat of Substitutes
In Porter's model, the term "substitute products" is referring to products of
other manufacturing industries. According to economists, threat of
substitutes occurs when a product demands are affected by changes in
price of substitute product. Demand elasticity in the price of a product is
affected by changes in substitute commodity prices. More and more substitute
goods, graph reflects demands of the product has higher elasticity (that
is only a small change in product prices also lead to major changes in product
demand) because buyers now have more choices. Thus, the existence of substitute
products limits the ability to increase price of business in a certain manufacturing
industry.
Competition caused by this substitute risk usually comes from outside
products of the industry.
3. Buyer Power
Buyer power is influence of buyers on a certain manufacturing industry.
Generally, when buyer power is greater, relationship between clients and the
manufacturing industry will be close to what economists
call purchasing monopoly – the market has many suppliers but there is only
one purchaser. In such market conditions, buyers have ability to impose price.
If buyer is powerful, they can force prices to be reduced, making industry’s profit
rate decrease. There are few purchasing monopoly phenomena in fact, but the
Class: GaMBA01.C03 CAPSTONE PROJECT
Group N
0
_ 03
10
unbalance relationships often exist between an industry and buyers.
4. Supplier Power
A manufacturing industry requires raw materials – including labors, input
and other components. This requirement leads to the relationships
between buyer and supplier, between manufacture and raw materials suppliers to
manufacture products. The power of suppliers shows the ability to decide their
trading conditions for their businesses.
The weaker suppliers may have to accept terms that business has given,
thereby business reduces costs and increase profit in manufacturing, by contrast, big
suppliers may put pressure on the manufacturing industry in many ways, like
setting higher raw material prices to share the profits of that industry.
5. Barriers to Entry
Not only present competitors create threats to businesses in an industry, but
the ability of new firms join the industry also affects on competition. In terms of
theory, any company can join or withdraw from the market if there is one “exit
gateway” and one “entry gateway” freely. Meanwhile, industry profits would be
negligible. But in reality, each industry has its own measures to protect
high profits of the existed units in the market, and prevent potential
competitors entering the market. These measures are called barriers to entry.
The barriers to entry are typical provisions of an industry. These barriers
decrease participation of new companies, thereby maintaining a stable profit for
existed firms operating in the industry. Reviewing from strategic perspective,
firms can create, or exploit these barriers to increase their competitive
advantage. The barriers to entry can be initiated from several main factors as
following:
Government creates barriers.
Patents and intellectual property is a barrier to entry.
The characteristics of asset restrict the entry to that sector.
Economy scale.
Class: GaMBA01.C03 CAPSTONE PROJECT
Group N
0
_ 03
11
Barriers to escape from the industry are similar to barriers to entry.
1.2.1.1 SWOT matrix
SWOT is abbreviated collection of the first letter of English words
Or it is also called as matrix of strengths, weaknesses, opportunities and
threats.
S: Strengths
W: weaknesses
O: opportunities
T: threats
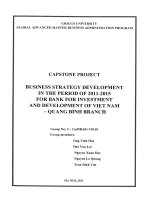
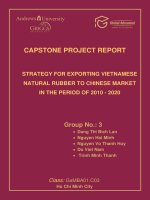
Source: www.northwoods.org.uk
Figure 1.2: SWOT model
SWOT analysis is to give opportunities and threats, strengths and
weaknesses on current status and future of the business in relationship interactions,
then determining strategic position of each relationship.
Class: GaMBA01.C03 CAPSTONE PROJECT
Group N
0
_ 03
12
In which:
SO strategy-“development” strategy: Combining strengths and opportunities
of the company to make large expansion and diversify development.
WO strategy: the weaknesses are more than strengths, but many outside
opportunities are dominant, correspondent to the name "competition".
ST strategy: this is the situation that company use internal strong conditions
to against external obstacle. This strategy is called “resistance” strategy.
WT strategy-“Defense”: The company can not deal with external threats, it
is deprived the ability to develop. In such situations, they have only two
directions: the first bankrupt or affiliate with another company.
1.2.1.2 Competitive image matrix:
Setting this matrix to identify comparative evaluation of the company with
major competitors in the industry, the comparison is based on factors affecting on
the competitiveness of the company in the industry. Thereby it helps the
administrator recognize strengths and weaknesses of competitors, identify
competitive advantages for the company the weaknesses that need to be overcome.
1.3 . Theoretical models about marketing management in rubber industry and
technical barriers to trade in rubber market, business culture issues, logistics
issues and supplying chain.
1.1.3.1. 4P marketing model:
Marketing Mix with traditional 4P including: Product, Price, Place and
Promotion. General meaning of combining 4P into 1 Marketing Mix is that when
you have a good product but you sell that product with unacceptable price (with
targeted customers), then customers will have difficulty in buying your product or it
is not easy to buy your product (role of distribution channel), so there is few people
know about your product (role of Marketing communication) then you are still able
Strengths
Weaknesses
Opportunities
Combining strategy SO
Combining strategy WO
Threats
Combining strategy ST
Combining strategy WT
Class: GaMBA01.C03 CAPSTONE PROJECT
Group N
0
_ 03
13
to be lose in doing your business. A good marketer should know how to combine
cleverly the four factors mentioned above.
It is important to understand that principles of mixed marketing is variables
that can be controlled. Mix marketing model can be adjusted periodically to meet
constantly changing demands of targeted customers or meet the dynamics of
market.
4Ps combination model:
Nearly a half century elapsed, there have been numerous articles offer
arguments and critcs that said 4Ps was outdated and insufficient to create a solid
foundation for a marketing strategy in the new century. And also a variety of
marketing models (eg. 7Ps, 4As ) is introduced to replace the position of 4Ps in
the marketing world. However, 4Ps still exist because it covers all elements of a
marketing strategy in the simple way that is relatively completion. Of course, 4Ps
are now defined broader than at the beginning to better suit with the times.
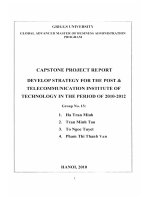
- Product: Managing elements of the product / service (brand, function,
quality, form, packaging, plus service, warranty system ) and plan to
develop product / service into market.
- Price: Decision on product price excluding cost of production and
administration. Also considering other factors (current price of competing products,
promotion prices, prices for dealers, price applies for other forms of payment ) to
determine listed price for the product.
- Place: Select and manage commerce channels to occupy target market at
the right time and develop logistics systems and transportation of products.
- Promotion: Introduce and convince potential markets to use products of
the business through advertising types (advertising, personal selling, public
relations, journalism or Internet ).
Class: GaMBA01.C03 CAPSTONE PROJECT
Group N
0
_ 03
14
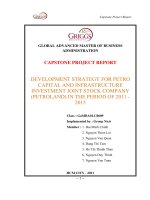
Source: www.apex.vn
Figure 1.3: Theoretical model of marketing 4Ps
In theory, if the enterprise can perform any P factor in 4Ps better than its
rival, the enterprise will have competitive advantage - sign of a successful
marketing strategy - customer favorite and become more popular and more
successful.
1.1.3.2. Technical barriers to trade:
In international trade, the "technical barriers to trade” are standards in fact,
technical regulations that a country applies to imported goods or conformity
assessment process of imported goods for that technical regulations, standards
(hereinafter referred to technical measures – TBT measures).
These technical measures in principle is necessary and reasonable to protect
the important interests such as human health, environment, security Thus, each
WTO member country sets up and maintains a system of technical measures
separately for their goods and imported goods.
However, in reality, the technical measures may be potential barriers to
international trade because they can be used for the purpose of protecting domestic
production, making it difficult for importing goods of foreign countries into
importing country market. Therefore it is also called "technical barriers to trade".