INTEGRATED ENVIRONMENTAL HEALTH IMPACT ASSESSMENT
Bạn đang xem bản rút gọn của tài liệu. Xem và tải ngay bản đầy đủ của tài liệu tại đây (891.75 KB, 43 trang )
INTEGRATED ENVIRONMENTAL
HEALTH IMPACT ASSESSMENT
Monday December 12 2011
Herman Autrup
2
SYSTEMIC RISKS
Complex risks to human health and the environment, embedded within
wider context of social, economic and financial risks and opportunities
(OECD 2002, Klinke and Renn 2006)
Science
Public
Policy
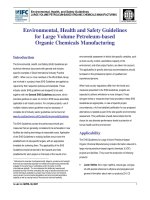
HEALTH IMPACT ASSESSMENT
PARADIGME
POLICIES
and mechanisms
SOURCES
Burdens &
Emissions
Pollution in µ-
environments
People & Context:
social, economic,
behavioural,
perceptions of risk
EXPOSURES
Dose
Toxicity:
%change
per unit
exposure
or dose
Background
rates of
mortality &
morbidity
HEALTH (DISEASE) IMPACTS
INTEGRATED HIA PATHWAY
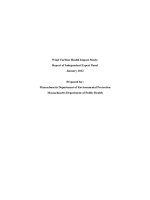
FACTORS THAT MAY EFFECT HEALTH
Complex Exposures – multifactorial etiology
Endogenous factors
Biological factors
Accident factors
Physical factors
Noise, climate
Chemical factors
Air pollution
IMPACT
SOURCE TO IMPACT
7
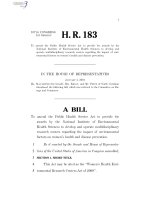
IMPACT PATHWAY
Dose
Emission/
Release
hazardous
agents
Exposures Health effectsConcentration
Monetary
value of
impacts
Disease
Burden
Policy deficits
Perception &
acceptability
e.g. emission limit
e.g. quality standard
e.g. exposure guideline
e.g. bioiogical quality guideline
concentration effect relation
exposure-effect relation
8
KEY CHARACTERISTICS
Policy oriented
Starts from policies and assesses how these translate into health effects
Full-chain approach
Links remote/distal sources to health effects
Multi-factorial
Considers multiple sources, agents, pathways, effects
Health as well-being
Includes beneficial as well as adverse health effects
Environment writ-large
Living/working (indoor) and social as well as ambient environment
Aggregative
Provides overall metrics of impact (including monetary/social value)
TYPES OF ASSESSMENTS
Integrated risk assessment – human, biota and
natural resources
Comparative risk assessment – changes in
population health – modifying the population
distribution of exposure to a risk factor
Health Impact assesments – focus on policies
and interventions – environment is not just a
hazard
Environmental impact assessment
WHY NEW ASSESSMENT PARADIGME ?
Powerful technologies
Increased globalisation
Correctness of societies
Economic and social effects as well as
health
People far removed from the origin of the
hazard
Future generations
CONCEPTIONAL FRAMEWORK
TYPES OF ASSESSMENT
1. Diagnostic - problems exist
Is there a risk ?
What is the cause ?
Where might we act
2. Summative
What are the effect of current policies ?
Are They meeting their targets ?
Does the policy need to change
3. Prognostic
What will happen if we intervene ?
What is the relative costs and benefits of
different interventions?
Which option is best ?
13
Research perspective
Ambient PM has an independent effect on health
Sources
Consequences
Exposures
Electricity
Traffic
Industry
Households
Diesel
Bio-aerosol
PM2.5
PM10
BS
PAH
Carbonaceous
pH
Ultrafines
Transient
metals
Symptoms
Pulmonary
function
Mortality
Cough
Wheeze
FVC
FEV1
PEF
CVD
Resp. dis.
Policy perspective
A strong ,effective, efficient and coherent policy
reduces the public health impact if ambient PM
Sources
Consequences
Exposures
Traffic
Industry
Households
PM2.5 PM10
BS
Symptoms
Mortality
PAH
Ultrafines
Pulmonary
function
Cough
Wheeze
Electricity
Diesel
Carbonaceous
pH
Transient
metals
FVC
FEV1
PEF
CVD
Resp. dis.
Bio-aerosol
CASE OUTDOOR AIR - WHY ?
• Associated with significant public health
effects
• Influenced by policies in many sectors
• Fuel combustion
• Generation of electricity
• Waste incineration
• agriculture
BIOFUELS
2003 Biofuels directive 5.75 % market share of
transport fuels in 2010
2006 Impact assessment of biofuels policy options
2006 Strategy reduce greenhouse gas emissions,
long term replacement of fossil fuels
2007 Biofuels target set at 10% of transport fuel
supply
2008 Feedstock prices 60% - grain required to fill
the tank of a SUV with ethanol could feed one
person for a year
EMISSION INVENTORIES
PM2.5 VOC
Combustion of energy industry 8% 1%
Non-industrial combustion 31% 10%
Industrial combustion 9% 2%
Production processes 14% 9%
Extraction of fossil fuel 2% 9%
Solvent use 3% 39%
Road transport 16% 18%
Other mobile resources 9% 5%
Waste management 3% 1%
Agriculture 5% 6%
CLE Current Legislation
MFTR = Maximum feasible Technical Reduction
SOURCES OF EMISSIONS
HOW GOOD ARE THE DATA ?
UNCERTAINTY IN POLLUTANT ASSESSMENT
PM undifferentiated by source or composition
Primary combustion particles, other particles and
secondary particles
AIR QUALITY
EMISSION SCENARIOS
Base emission inventories
Projected future emission inventories
economy
population growth
energy mix
climate conditions
Spatial and temporal distributions
Point sources - coordinates
Line sources - transport network
Area sources - land use
population density
animal numbers
type of agricultural activity
EXPOSURE PATHWAYS
• Air quality models
• Chemical transport models
• Dispersion models
/>Personal
Exposure
Construct the full annual pattern of daily
concentrations of ambient air
Apply the relevant concentration – response
function to estimate daily intake
Aggregate the impacts over days in the year –
annual impacts
Problems:
C-R linear with no threshold
different metrics use 1,8, 24 h
attributable deaths – among people
with severe diseases – earlier death