tóm tắt luận án study on the biological characteristics and induced spawning of spotted scat
Bạn đang xem bản rút gọn của tài liệu. Xem và tải ngay bản đầy đủ của tài liệu tại đây (1.01 MB, 37 trang )
MINISTRY OF EDUCATION AND TRAINING
CAN THO UNIVERSITY
LY VAN KHANH
STUDY ON
THE BIOLOGICAL CHARACTERISTICS AND
INDUCED SPAWNING OF SPOTTED SCAT
(Scatophagus argus Linnaeus, 1766)
Specialization: Marine/Brackishwater Aquaculture
Field of Study Code: 62 62 70 05
Dissertation of Doctor Degree in Aquaculture
Can Tho, 2012
1
The study carried-out at:
- Ngoc Hien and Nam Can district, Ca Mau province.
- College of Aquaculture and Fisheries, Can Tho
University.
Supervisors:
A/Prof. Dr. Nguyen Thanh Phuong
A/Prof. Dr. Tran Thi Thanh Hien
Examiner 1: A/Prof. Dr. Nguyen Tuong Anh
Examiner 2: Dr. Bui Minh Tam
The dissertation will be defensed at the university committee in
meeting room of College of Aquaculture and Fisheries, Can
Tho University at time of: ….… hr ….… date ……. month
……. year 2012.
The disseratation is available in Libraries:
Library Center of Can Tho University.
College of Aquaculture, Can Tho University.
2
Introduction
1. Background and problem statement
Viet Nam has a great potential for marine/brackish-water
aquaculture development. Recently, marine/brackish-water
aquaculture of Viet Nam is likely based on single species and its
negative impacts on water environment and disease outbreak have
occurred. The diversification of farming species in the coastal areas is
very important for sustainable development; and few brackish-water
fish species has been introduced to farm at pilot scale. However, the
development of marine/brackish-water species has faced various
difficulties, especially hatchery-reared seed supply, which is
considered a basis requirement.
Spotted cat (
Scatophagus argus) distributing along the coastal
areas is the potential species for aquaculture especially in the Mekong
delta. However, there are short of seeds in both of wild and hatchery
seeds for culture systems. Therefore, the biological characteristics and
induced spawning of spotted scat fish (
Scatophagus argus Linnaeus,
1766) is needed to be studied for developing aquaculture production
of this species.
2. The Objective of Study
- General objective:
to find out the biology characteristics to
contribute the scientific information or development of artificial
propagation of spotted cat; to diversify the aquaculture species and
farming systems in the coastal areas; to archive the sustaining
development of aquaculture in the Mekong Dleta and Vietnam.
- Specific objective: to determine the main biology including
physiological characteristics, kinds of ganodotropic hormones/and
chemicals corresponding with artificial propagation in Spotted cat
hatchery; to develop the techniques in nursing Spotted scat from fry to
fingerling stage.
3. The Contents of Study
- The study on the main biology and physical characteristics
relating to the reproduction of Spotted cat.
3
- The study on the investigation/and use of ganodotropic hormones
and chemicals in the artificial propagation reproduction and hatching
techniques of Spotted cat.
- The study on the development of digestive system (intestine) and
feeding habits of fry of Spotted cat.
- The study on nursing Spotted cat from fry stage to small
fingerling with different feeds; and nursing small fingerling to
fingerling at different salinities.
4. The useful outcomes
The findings of the research provide basic scientific information of
reproductive and physiological biology of spotted cat; and induced
spawning and larvae to fry and fry to fingerling rearing. The above
information will be utilized for the complete development of seed
production techniques of the spotted cat, which is important for
spotted cat grow-out activities, contribution to diversification of
farming species and sustainable development of marine/brackish-
water aquaculture in Viet Nam especially in the Mekong Delta.
5. New findings of the thesis
- Spawning seasons, relative fecundity, egg diameter and embryo
development of spotted cat were determined.
- Relationship between hematological parameters (red blood cell,
white blood cell, hematocrit, ), phosphate protein (vitellogenin)
concentration and maturation stages of spotted cat were established.
- Yolk sac size (length and width), larval month size, larval length,
yolk sac absorption duration, and larval initial food selection and
digestive tract development were found.
- More especially, technique for induced spawning was
successfully found; initial food for newly hatched larvae up to 30 days
was identified; and the suitable salinity for nursery of fish from 30 to
60 days was also chosen.
The above results indicated that the technique of artificial
propagation and larval rearing of spotted cat were established and is
able to produce mass seeds for grow-out activities, diversification of
farming species, and farming models as well. The thesis also indicates
4
possibility to close the life cycle of the spotted cat in captive
conditions.
6. The lay-out of dissertation
The dissertation has 163 pages. It consists of 5 pages of
introduction, literature review 30 pages, methodology 20 pages,
results 57 pages, conclusion and recommendation 3 pages, list
publication 2 pages, cited references 15 pages and 31 pages of indices.
5
Chapter 1: Literature review
The literature review focused to investigation of main points
following as:
- The biology characyeristics of Spotted cat
- The physiological characteristics of Spotted cat
- The ganadotropic hormones and chemicals corresponding with
spotted cat
- The imformation relating to the techniques in hatchery of
marine/brackish water fishes.
- Development of intestine system and feeding habits of spotted cat.
- Natural food and compound feeds used for rearing fry of fish.
- The issues studied on natural food/ compound feeds and salinity
in the nursing marine fishes.
In the results of the previous studies, the biological characteristics
of spotted cat are not studied completely; the hatchery seed production
is not successful. However, based on the information reviewed the
new studies are established to determine the biology characteristics of
Spotted cat and find the techniques of hatchery seed reproduction.
6
Chapter 2: METHODOLOGY
2.1. Location and time of the study
The study was carried-out at Nam Can and Ngoc Hien districts, Ca
Mau province; and the hatchery of College of Aquaculture and
Fisheries, Can Tho University, from September 2006 to November
2010.
2.2. Experiment setting
2.2.1 The sudy on reproductive biology characteristics
Thirty spotted cats was collected monthly during 12 months to
record the individual weight, sex ratio, the weight of gonad,
maturation indexes, female and male ratios, phases of development of
gonad and diameter of eggs.
The relationship among the development of gonads, maturation
rate of fish and fat indexes of Fulton and Clark were investigated
based on the fish samples collected. The weight of fish, standard
length, weight of fish without viscera, fat indexes of Fulton and Clark,
sex ratios, weight of gonad and the development phases of gonad are
monitored.
Mature broodstocks catched from wild were stimulated for
spawning by using gonadotropic hormones and chemicals for
recording the spawning capacity, diameter of eggs, development of
embryos, size of egg yolk, size of mouths, length of fries.
2.2.2 The study on physiological characteristics of spotted cat
The collected samples of spotted cat were recorded as six phases
of gonad development, weight of fishes, sex ratios, weight of gonads
and maturation ratios.
The blood samples of fishes were collected from the dorsalis by
using syringe. The blood characteristics analalysed following as
number of red blood cells, leukocyte, haemoglobin, ratio of
haematocrit, volumm of red blood cell µm
3
(MCV), the mean weight
of haemoglobin in red blood cell (MHC), concentration of
haemoglobin in red blood cell (MHCH), concentration of protein,
phosphate in the plasma (Vitellogenin), concentration of protein in
muscle and liver.
7
2.2.3 The experiments of spawning stimulation and hatching
eggs of spotted cat
2.2.3.1 Study on the maturation culture of spotted cat
One-year-old broostocks from hatchery reared fish were grew-out
in 3 composite tanks (2 m
3
tank) at 15‰ salinity during 4 months.
The fish was fed 2 twice a day by using 35% protein commercial
feeds (Grobest Company). In the experiment, the parameters of water
quality were determined such as total amonia nitrogen (TAN), nitrite
(N-NO
2
-
), weight of fish, weight of fish gonads, and development of
gonad, indexes and matuarion of ratios.
2.2.3.2 Study on the kinds and doses uses of gonadotropic hormones
and chemicals corresponding with artificial reproduction
The mature broodstocks collected from the wild were stimulated
for artificial reproduction (Table 2.1). The female broodstocks were
injected by 2 times (preparatory and decisive injections), meanwhile
the male is injected 1 time at the same time as the decisive injection of
female.
After decisive injection, the activities of the broodstocks were
monitored; when the females were ovulating, testises of males were
dissected and ground to get the sperms for fertilizing the eggs latter.
The eggs and sperms were mixed well and hatched in 30‰ salinity
water.
Table 2.1: Kinds and doses of gonadotropic hormones and chemicals use
Kind Dose
Ovaprim (ml/kg) 0.5 1.0 1.5
LHRH-a (µg/kg)+Dom (5 mg/kg) 50 100 150
HCG (UI/kg) 1,000 1,500 2,000
The parameters were recorded such as the time of hormone
responding, the time of oocyte development, ratios of fish ovulating,
fertilizered egg, off-pring and heterophyte.
8
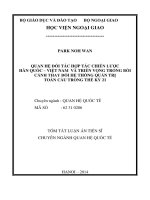
Gonadotropic hormone injection Spotted cat post-injected Testises
female ovulating Sperms and eggs mixing Mature broodstock tank Hatching and larvae nur
sing tank
Fig. 2.2: The procedure deneating the artificial reproduction of Spotted cat
2.2.3.3 The effects of salinities on hatching rates
The wild mature spotted cat injected ovaprime with dose of 1
mL/kg (see types and doses used in section 2.2.3.2). The eggs and
sperms were mixed well and incubated in 7 treatments with 0, 5, 10,
15, 20, 25 and 30‰ of salinities using 15-liter tanks aerated. The
incubating density was 100 eggs per liter. The temperature, pH and
hatching rates were recorded.
2.2.4.Study on the development of digestion system and feeding
habit of fry
The newly hatched fries were nursed in the 4 m
3
cement tanks
with salinity of 25‰; density of 50 fries per liter and aerated
condition. The fries were fed natural foods with twice a day. The
natural foods were collected from water of extensive shrimp ponds
using phytophankton scope net.
2.2.4.1 Study on the development of digestion system of spotted cat
From the tanks mentioned above, the fry samples were collected at
2, 3, 4, 5, 6, 7, 8, 9, 10, 15, 20, 25 and 30-day-old to analyse histology
for determining devlopment of enteron system.
2.2.4.2 Study on the food selection and consumption of spotted cat
The water sample of the tanks metioned above, were taken at 2, 3,
4, 5, 6, 7, 8, 9, 10, 15, 20, 25 and 30-day-old of fry to determine the
quantity and quality of phytoplankton and zooplankton. Based on the
frequency of occurrence of each species of planktons in the samples to
clarify the food section and the consumption of spotted cat.
9
2.2.5. Nursing fry to small fingerling (1-month-old)
2.2.5.1 The nursing fry to 15-day-old fingerling using different feeds
The 2-day-old fries were reared in 15-liter tanks at the salinity of
25‰; 50 fries per liter density with 6 treatments of different types of
feeds including
(i) Chlorella sp.+Rotifer; (ii) Chlorella sp.+Rotifer+
Compound feed (TACB);
(iii) Chlorella sp+TACB; (iv) Rotifer; (v)
Rotifer+TACB; and (vi) TACB.
During 15 days of rearing, the fries were fed 4 times daily. The
water temperature and pH, length, the growth/and specific growth of
fish length, and the survival rates of fries were determined.
2.2.5.2 The nursing 15 to 30-day-old fingerling using different feeds
The 15-day-old fingerlings were grew-out in the 10-liter tanks with
25‰ salinity. The experiment has 5 treatments with feeding by
different feed stuffs including
(i) Rotifer; (ii) Artemia; (iii) Compound
feed (TACB);
(iv) Rotifer+TACB and (v) Artemia+TACB.
The fingerlings were fed 4 times per day during 15 days (15-30
day-old).
The water quality and the growth of fish were verified by
temperature, length, the growth /and specific growth of fish length,
and the survival rates.
2.2.6. Nursing the fingerling 30 to 60-day-old at different
salinities
The experiment has seven treatments including 0, 5, 10, 15, 20, 25
and 30‰ salinity. Twenty-five fingerlings were nursed in the 50-liter
tanks and fed by commercial feeds at the frequency of 3 times per day
During 30 days nursing, the water temperature and pH, weight, the
growth /and specific growth of fish, survival rates and size distribution
of fish were recorded.
2.3. Data analysis
The collected data were analysed in the differences of means
among the treatments using the one-way ANOVA with DUNCAN test
(using Excel 2003 and SPSS version 13.00).
10
Chapter 3: RESULTS AND DISCUSSION
3.1. The reproductive biology characteristics of spotted cat
3.1.1. The stages of gonad development
The developmental stages of reproduction system were identified based on
the histology specimens and the maturity scale of Nikolsky (1963).
3.1.1.1. The development stages of testicle
Fig. 3.1: The histology of testicle
Fig. 3.2: The morphology of testicle
3.1.1.2. The development stages of ovary
Giai đoạn I (40x) Giai đoạn II (40x)
Giai đoạn III (20x) Giai đoạn IV (10x)
Stage I (40X) Stage II (40X)
Stage III (20X) Stage IV (10X)
Fig. 3.3: The histology of ovary
Giai đoạn I Giai đoạn II
Giai đoạn
III
Giai đoạn
IV
Stage I
Stage II
Stage IV
Stage III
Fig. 3.4: The morphology of ovary
3.1.2. The spawning season and sex ratio of Spotted cat population
in the nature
The maturation ratio of female spotted cat was high in May and
August (Fig. 3.5). The ratio of female is higher that of male (Fig. 3.7)
in the natural population.
0
2
4
6
8
10
12
1 2 3 4 5 6 7 8 9 10 11 12
Tháng
GSI (%)
month
Fig. 3.5: GSI of female
Spotted cat
0,0
0,2
0,4
0,6
0,8
1,0
1 2 3 4 5 6 7 8 9 10 11 12
Tháng
GSI (%)
month
Fig. 3.6: GSI of male
Spotted cat
0
20
40
60
80
100
1 2 3 4 5 6 7 8 9 10 11 12
Tháng
Đực
Cái
month
male
fema
le
Fig. 3.7: The ratio of female
and male
3.1.3. The relation of development stage of gonad with
maturation and fat index of female spotted cat
The gonadosomatic index of spotted cat with stage IV was 9.87%,
the highest compared to other stages. The spotted cat with stage III
11
ovary had highest fat index (Table 3.1); the ratio of maturation
increased from stage III to stage IV ovary, meanwhile the fat index
decreased from stage III to stage IV ovary.
Tbale 3.1: Maturation ratio and fat indexes of gonad development stages of female
spotted cat
Development
stage of gonad
Gonadosomatic
index (GSI) (%)
Fat index of
Fulton (%)
Fat index of Clark
(%)
I 0.42
a
±0.13 6.52
bc
±0.55 5.88
b
±0.49
II 0.54
a
±0.15 6.40
abc
±0.41 5.73
b
±0.28
III 3.65
b
±1.87 6.71
c
±0.93 5.95
b
±0.85
IV 9.87
c
±3.42 6.15
ab
±0.61 5.18
a
±0.50
The means with different superscripts within the same column indicate significant
differences among stages of gonad development (P<0.05).
3.1.4. The relation of development stage of gonad with maturation
and fat index of male spotted cat
Within 4 developmental stages of gonads, the maturation ratios of
male spotted cat of were not different significantly (p<0.05). The fat
indexes of stage II ovary was the highest (6.89% and 6.22%) (Table
3.2).
Table 3.2: Maturation ratio and fat indexes of gonad development stages of male
spotted cat
Development
stage of gonad
Gonadosomatic
index (GSI) (%)
Fat index of Fulton
(%)
Fat index of Clark
(%)
I 0.26
a
±0.16 6.06
a
±0.89 5.47
a
±0.77
II 0.34
a
±0.16 6.89
b
±0.68 6.22
b
±0.58
III 0.41
a
±0.36 6.27
a
±0.43 5.61
a
±0.38
IV 0.48
a
±0.20 6.04
a
±0.37 5.48
a
±0.28
The means with different superscripts within the same column indicate significant
differences among stages of gonad development (P<0.05).
3.1.5. Spawning capacity of spotted cat
The spawning fecundity of spotted cat was 2.469.209 eggs/kg
(Table 3.3).
Table 3.3: The spawning capacity of spotted cat
Weigh of fish (g/fish) Spawning capacity (eggs/kg of fish)
Mean 135±59.8 2,469,209±590,901
Maximum 300 3,115,541
Minimum 50 1,150,345
12
3.1.6.Diameter of eggs, development of embryo and length of fry
3.1.6.1 Diameter of egg
Table 3.4 indicated that the diameter of eggs was maximum in the
stage V. The eggs absorbed water has the 0.8mm diameter. The egg of
Spotted cat has the yolk sac leading to the fertilized eggs float on the
water surface.
Table 3.4: Diameter of Spotted cat egg
Diameter (mm)
Stage III Stage IV Stage V
Before absorbed
water
After absorbed
water
Mean 0.37±0.02 0.58±0.03 0.68±0.02 0.71±0.02 0.80±0.02
Maximum 0.39 0.63 0.70 0.75 0.82
Minimum 0.33 0.50 0.63 0.68 0.74
3.1.6.2 The developmet of embryo
The time of embryo developing ranges from 18 to 22 hours (mean
about 19 hours), at the water temperature of 26.2-27.7
o
C, pH: 8.4-8.6
(Table 3.5).
Table 3.5: Development of embryo of Spotted cat
Development stage After egg fertilized Temperature (
o
C) pH
Embryonic dics 0 hour 15 minutes 26.2 8.4
2 cells 0 hour 30 minutes 26.2 8.4
4 cells 1 hour 00 minutes 26.2 8.4
8 cells 1 hrs and 30 min. 26.2 8.4
16 cells 2 hrs and 15 min. 26.2 8.4
32 cells 2 hrs and 45 min. 26.2 8.4
64 cells 3 hrs and 45 min. 26.2 8.4
Gastula 6 hrs and 30 min. 26.4 8.4
Neutron embryo 13 hrs and 15 min. 27.7 8.6
Complete embryo 16 hrs and 30 min. 27.4 8.6
Offspring 19 hrs and 30 min. 27.1 8.6
The newly hatched fries use yolk egg for developing in 2 days,
after that the fry colects the food from waterbodies (Fig. 3.8).
13
Embryonic dics 2 cells 4 cells 8 cells 16 cells 32 cells
64 cells Gastula Neutron embryo Complete embryo
Complete embryo Offspring
Fig. 3.8: Development stage of embryo of Spotted cat (10X)
3.1.6.3 The size of egg yolk, the size of mouth and the length of
spotted cat fry
The fry of spotted cat has the egg yolk with 0.76 mm (length) and
0.29 mm (width); the size of mouth 0.07 mm and total length 1.88
mm. The egg yolk was consumed until day 3-4, at that time the fry
had to feeding the food by the mouth with size 0.23±0.04 mm width
(Table 3.6 and Fig. 3.9).
Table 3.6: The sizes of egg yolk and mouth of spotted cat
Size of egg yolk (mm)Age
(day)
Length Width
Size of mouth
(mm)
Total length
(mm)
0 0.760±0.07 0.290±0.03 0.07±0.02 1.88±0.10
1 0.440±0.05 0.190±0.02 0.16±0.04 1.99±0.14
2 0.400±0.06 0.180±0.03 0.19±0.05 2.02±0.11
3 0.010±0.00 0.004±0.00 0.23±0.04 2.03±0.11
4 - - 0.28±0.03 2.04±0.11
5 - - 0.30±0.05 2.08±0.17
6 - - 0.35±0.06 2.28±0.15
7 - - 0.39±0.08 2.45±0.15
8 - - 0.47±0.07 2.80±0.27
9 - - 0.54±0.05 2.91±0.27
10 - - 0.58±0.05 3.21±0.31
15 - - 0.65±0.06 3.87±0.31
20 - - 0.69±0.10 4.39±0.69
25 - - 0.75±0.14 5.32±0.92
30 - - 0.79±0.12 5.69±0.72
14
0
5
10
15
20
25
1 2 3 4 5
Development stage of gonad
Weight (g )
Gonad
Liver
Figure 3.11: Relation between weight of
gonad and weight of liver based on
different stages of gonad development
W = 0,1947H
2,996 4
R
2
= 0,9511
W = 0,1107Lc
2,776 6
R
2
= 0,9723
W = 0,0732Lt
2,749 4
R
2
= 0,9694
0
100
200
300
400
5 10 15 20 25
Length or height (cm)
Weigth (g)
Tolal length (Lt)
Standard length (Lc)
Height
Figure 3.10: The relation beween
weight and the total length/height of
female Spotted cat
1-day-old 2-day-old 3-day-old 4-day-old 5-day-old
10-day-old 15-day-old 20-day-old 25-day-old 30-day-old
Fig. 3.9: Spotted cat fry 1 to 30-day-old (4X)
3.2. The reproductive physiology cheracteristics of Spotted cat
3.2.1. The reproductive physiology cheracteristics of female
Spotted cat
3.2.1.1 Relation between weight and length/height of female Spotted
cat
Fig. 3.10 indicated that the
exponiential coefficient of total
length (2.75), standard length
(2.78) and height (2.99) is
smaller than 3
The weight of fish had
strongly relation with total
length, standard length and height of fish.
3.2.1.2 The relations between GSI and ratio of liver weight per fish
weight (HIS); and ratio
of gonad weight per liver
weight of female Spotted
cat
The weight of livers of female
having ovaries in stage III and IV
were heavier than that of fish
with ovaries in stage I and II
15
(p<0.05).
The ratio of liver weight per fish weight of the fishes having
ovaries in stage III was the highest (2.75%).
The ratio of gonad weight per liver weight in the fishes having
ovaries in stage IV was the greatest significantly (p<0.05) compared
to that of other group of fishes (Table 3.7).
The weight of liver of fish increased by the increasing of vorary
from stage I to II and decreased at stage IV of ovary (Table 3.7 and
Fig. 3.11)
Table 3.7: Ratio of liver weight per fish weight, ratio of gonad weight per liver
weight of fishes having different stages of gonads
Gonad stage GSI (%)
Weight of
liver (g)
Weight of
liver/weight of fish
(HSI) (%)
Weight of gonad
/weight of liver (%)
I 0.42
a
±0.13 1.79
a
±0.88 2.11
a
±0.50 20.8
a
±7.66
II 0.54
a
±0.15 2.20
a
±1.20 2.22
ab
±0.67 25.5
a
±8.75
III 3.65
b
±1.87 4.59
b
±2.17 2.75
b
±0.84 156
a
±108
IV 9.87
c
±3.42 4.25
b
±1.81 2.24
ab
±0.60 477
b
±215
The means with different superscripts within the same column indicate significant
differences among stages of gonad development (p<0.05).
3.2.1.3 The relationship between stages of gonad development to
phisical blood characteristics of female spotted cat
Hemoglobin, hematocrit, MHC and MHCH with different
development stages of gonad were not different significantly (p>0.05)
(Table 3.8).
Table 3.8: Phisical blood characteristic of female Spotted cat based on different
stages of gonad development
Gonad
stage
Hemoglobin
(g/100 ml)
Hematocrit (%) MHC (pg/tb) MHCH (%)
I 6.87
a
±1.62 34.5
a
±5.27 17.6
a
±6.23 20.5
a
±3.46
II 7.05
a
±2.33 32.5
a
±6.65 21.3
a
±6.43 22.0
a
±9.04
III 6.05
a
±1.41 30.9
a
±7.65 19.8
a
±4.28 21.6
a
± 2.85
IV 6.83
a
±1.20 31.0
a
±7.54 21.3
a
±10.0 22.0
a
±3.50
The means with different superscripts within the same column indicate significant
differences among stages of gonad development (P<0.05).
16
3.2.1.4 The relationship between development stages of gonad to
quantity of red blood cell, leukocyte and ratio of
leukocyte/red blood cell of female Spotted cat
The quantity of red blood cell, volume of red blood cell belonging
to different developments stage of gonad in the fishes expressed no
significant differemces (p>0.05) (Table 3.9).
Table 3.9: Quantity of red blood cell and leukocyte, volume of red blood cell and
ratio of leukocyte/red blood cellin different stages of gonad development
Stage of
gonad
Quantity of red
blood cell (million
cell/mm
3
)
Volume of
red blood
cell (µ
3
)
Quantity of
leukocyte (million
cell /mm
3
)
Ratio of
leukocyte/red
blood cell (%)
I 4.19
a
±1.32 84.9
a
±37.4 0.0 5
b
±0.02 1.12
b
±0.51
II 3.45
a
±1.28 104
a
±49.5 0.03
ab
±0.01 0.93
ab
±0.54
III 3.13
a
±0.91 93.8
a
±12.9 0.02
a
±0.01 0.67
a
±0.10
IV 3.65
a
±1.22 94.1
a
±46.0 0.04
b
±0.01 1.14
b
±0.35
The means with different superscripts within the same column indicate significant
differences among stages of gonad development (P<0.05).
The quantity of red blood cell and ratio of leukocyte/red blood cell
was high at the gonad stage I and IV; they are significant differences
statistically (p<0.05) to that of the gonad stage III, and no significant
difference to the gonad stage II (p>0.05). At the gonad stage IV,
female broodstocks are preparing to spawn; therefore quantity of
leukocyte has been increasing and reached a peak. After spawning
period this trend had tended to reduce gradually, and at the gonad
stage III the quantity of leukocyte was the lowest.
3.2.1.5
The relationship between development stages of gonad to
phosphate protein content of blood plasma and protein of
female broodstocks
The phosphate protein content in fish blood and muscle between
differrent stages of gonad development is not significant difference
statistically (p>0.05) (Table 3.10). Protein content in the liver of
female broodstocs at the gonad stage I was the biggest (12.3mg
protein/mL blood plasma), and there is no significant difference to
that of the gonad stage II and III (p<0.05).
17
Table 3.10: The relationship between development stages of gonad to phosphate
protein content of blood plasma and protein of female broodstocks
Stage
of
gonad
Phosphate protein
of blood plasma (µg
ALP/mL protein)
Protein máu
(mg protein/mL
blood plasma)
Protein muscle
(mg protein/mL
blood plasma)
Protein liver
(mg protein/mL
blood plasma)
I 1.26
a
±1.04 41.5
a
±13.1 6.42
a
±4.01 12.3
b
± 3.44
II 1.87
ab
1.85 43.0
a
±11.7 8.41
a
± 7.34 10.1
a
±1.34
III 2.68
bc
±1.43 43.5
a
±8.78 7.54
a
±2.77 9.74
a
± 2.49
IV 3.12
c
±1.49 44.1
a
±18.2 5.48
a
±1.97 9.66
a
± 1.26
The means with different superscripts within the same column indicate significant
differences among stages of gonad development (P<0.05).
The phosphate protein content of female broodstocks at the gonad
stage IV was the highest (3.12 µg ALP/mL protein), however, it
shows no significant difference statistically (p<0.05) to the gonad
stage III (Table 3.10).
3.2.2. The reproductive physiology cheracteristics of male Spotted
cat
3.2.2.1 Correlation between
weight and length, heigth
Correlation between weight
and length, heigth of male
broodstocks was the same as
female broodstocks’s trend (Fig.
3.12).
3.2.2.2 The relationship between stage of gonad development to
weight of liver/weight of fish and weight of gonad/weight of
liver of male spotted cat
Based on the different stages of gonad development of the male
spotted cat, the significant differences of the ratio of weight of
liver/weight of fish, and ratio of weight of gonad/weight of liver were
not found (p>0.05).
W = 0,2905H
2,8563
R
2
= 0,849
W = 0,1063Lc
2,7822
R
2
= 0,8978
W = 0,0687Lt
2,7485
R
2
= 0,9057
30
60
90
120
150
3 6 9 12 15 18
Length or height (cm)
Weigth (g)
Tolal length (Lt)
Standard length (Lc)
Height
Figure 3.12: Relation between weight
of fish and length/height of fish
18
Table 3.11: Ratio of weight of liver per weight of fish and ratio of weigh of gonad
per weight of liver of male spotted cat
Stage of gonad
Weight of liver/weight of fish
(%)
Weight of gonad/weight of
liver (%)
I 2.22
a
±0.74 14.9
a
±14.8
II 2.93
a
±0.65 12.6
a
±8.20
III 2.53
a
±0.61 18.3
a
±19.6
IV 2.29
a
±0.66 22.3
a
±10.8
The means with different superscripts within the same column indicate significant
differences among stages of gonad development (P<0.05).
3.2.2.3 The relationship between stages of gonad development to
phisical blood characteristics of male spotted cat
Table 3.12 indicated that with the different stage of maturation, the
quantity of haemoglobin, mean weight of haemoglobin in red blood
cell were not different significantly (p>0.05). The concentration of
haemoglobin in red blood cell at the stage I of gonad contributing
32,4% was the highest (Table 3.12).
Table 3.12: Phisical blood characteristic of male spotted cat based on different
stages of gonad development
Stage of
gonad
Hemoglobin
(g/100 ml)
Hematocrit
(%)
MHC (pg/tb) MHCH (%)
I 9.96
a
±2.55 28.8
a
±2.59 20.7
a
±4.08 32.4
b
±8.86
II 9.12
a
±3.26 36.7
a
±6.84 21.4
a
±7.47 24.4
ab
±5.67
III 8.56
a
±2.32 39.0
a
±7.04 22.9
a
±9.95 21.2
a
±4.35
IV 8.18
a
±2.04 35.5
a
±7.18 19.6
a
±7.58 24.9
ab
±7.80
The means with different superscripts within the same column indicate significant
differences among stages of gonad development (P<0.05).
3.2.2.4. The relationship between development stages of gonad to
quantity of red blood cell, leukocyte and ratio of
leukocyte/red blood cell of male Spotted cat
Table 3.13 shows that the relation between gonad development
stages, quantity of red blood cell, volume of red blood cell, quantity of
leukocyte and the ratio of leukocyte/red blood cell of male
bloodstocks were not significant diffirences statistically (p>0.05).
19
Table 3.13: Quantity of red blood cell and leukocyte, volume of red blood cell and
ratio of leukocyte/red blood cellin different stages of gonad
development
Stage of
gonad
Quantity of red
blood cell (million
cell/mm
3
)
Volume of
red blood
cell (µ
3
)
Quantity of
leukocyte (million
cell /mm
3
)
Ratio of
leukocyte/ red
blood cell (%)
I 5.04
a
±2.12 63.3
a
±30.5 0.07
a
±0.05 1.25
a
±0.51
II 4.76
a
±2.34 94.7
a
±51.0 0.05
a
±0.03 1.00
a
±0.34
III 4.34
a
±2.09 119
a
±52.4 0.05
a
±0.02 1.09
a
±0.57
IV 4.51
a
±1.61 86.6
a
±28.7 0.06
a
±0.04 1.23
a
±0.36
The means with different superscripts within the same column indicate significant
differences among stages of gonad development (P<0.05).
3.3. Spawning stimulation and eggs incubation
3.3.1. Broodstocks rearing for maturation in the tanks
3.3.1.1 Environmental parameters monitoring
Water temperature during the maturation rearing of broodstocks
is 28.3±0.63
o
C; and pH is relatively stable with 7.92±0.14. Total of
nitrogen (TAN) at this period is 0.37±0.07 mg/l. N-NO
2
-
parameter
had been varied 0.19±0.02 mg/l.
3.3.1.2 Broodstocks maturation degree
After four months of
broodstock maturation
rearing, the ratio of female
broodstocks at the gonad
stage III accounted for
30.3% and that of 4
th
gonad
stage was 39.4%; while
these ratio of male
broodstocks were 29.6%
and 51.9%, respectively (Fig. 3.13).
3.3.2. Impacts of hormone type and dose used, stimulation
chemicals used for spawning
3.3.2.1 Effect time of hormone used for spawning, time for embryo
development and eggs ovulation rate
Results on spawning stimulation shows that all three types of
hormones used could made eggs maturation and ovulation at
0
10
20
30
40
50
60
Stage II Stage III Stage IV
(%)
male
female
Figure 3.13: Maturation ratio of broodstocks
after 4 rearing months in the tanks
20
temperature degree from 25.5 to 28.0
o
C, and effect time of hormone
used for spawning had been ranged from 12 to 32 hours (Table. 3.14).
Table 3.14: Effect time of hormone used for spawning, time for embryo
development, female broodstock ovulation rate
Hormone
types
Dose rate
Effect time
(hours)
Time for embryo
development (hours)
fish ovulation
rate (%)
0.5 17.2
a
±4.81 18.9
a
± 0.93 80.0
1.0 19.0
ab
±5.15 19.1
a
±1.04 93.3
Ovaprim
(mL/kg)
1.5 19.5
abc
±4.55 19.0
a
±1.16 86.7
50 22.8
bcd
±5.19 19.1
a
±0.96 86.7
100 22.1
abcd
±5.49 19.2
a
±0.95 66.7
LHRH-a
(µg/kg) +
DOM 150 19.8
abc
±4.71 19.1
a
±0.97 73.3
1,000 22.7
bcd
±6.08 19.7
a
±1.48 33.3
1,500 24.4
cd
±4.20 19.5
a
±0.89 40.0
HCG
(UI/kg)
2,000 25.4
d
±2.53 19.5
a
±0.96 53.3
The means with different superscripts within the same column indicate significant
differences among stages of gonad development (P<0.05).
Time for eggs hatching among three types of hormones used is not
significant diffirence statistically (p>0.05), and it ranged from 18 to 22
hours. The ovaprim 1 mL/kg used for spawning stimualation got the
highest rate of female broodstocks ovulation with 93.3%, and the
lowest rate is come from HCG 1.500 UI/kg type with 4.0%.
3.3.2.2. Eggs fertilization, hatching and heteromorphic rates
- Ovaprim:
the fertilization and hatching rates of eggs was the
highest at the dose of ovaprim 1 mL/kg, with 76.5% and 69.5%
respectively, and this dose used is significant difference statistically to
doses of ovaprim 0.5 and 1.5 mL/kg used (p<0.05), while the
heteromorphic rate is not significant difference statistically among
three doses of ovaprim used (p>0.05) (Table 3.15).
- LH-RH-a: LHRH-a 50 μg/kg used reached at the highest rate of
eggs fertilization, and it is significant difference statistically to doses
of LHRH-
a 100 and 50 μg/kg used (p<0.05). The hatching rate of eggs
is higher at injection doses of LHRH-a 50 μg/kg and 100 μg/kg, with
53.7% and 50.9% respectively, however, they are not significant
differences statistically (p>0.05). The heteromorphic rate of eggs was
the lowest for dose used of LHRH-
a 50 μg/kg (2.9%), it is not
significant difference statistically with LHRH-a 100 μg/kg used
21
(5.5%) and significant difference statistically with LHRH-a 150 μg/kg
(8.8%) (Table 3.15)
- HCG:
the eggs fertilization and heteromorphic rates are not
significant differences statistically among three doses used of HCG
injection (p>0.05). The hatching rate of eggs for HCG 2,000 UI/kg
was 38.5% and it did not show significant difference statistically
(p>0.05) to the injection dose used of HCG 1,500 UI/kg (31.8%),
however, it presents a significant difference statistically (p<0.05) to
dose used of HCG 1,000 UI/kg (30.9%) (Table 3.15).
Table 3.15: Eggs fertilization, hatching and heteromorphic rates
Hormone
types
Doses
Eggs fertilization
(%)
Eggs hatching
rate (%)
Eggs heteromorphic
rate (%)
0.5 61.7
b
±8.02 54.9
d
±7.01 2.76
a
±1.87
1 76.5
c
±5.27 69.5
e
±5.77 2.16
a
±1.43
Ovaprim
(mL/kg)
1.5 55.0
b
±7.30 49.9
d
±10.2 3.18
a
±2.47
50 63.4
b
±11.0 53.7
d
±5.90 2.93
a
±2.78
100 54.1
b
±11.6 50.9
d
±8.27 5.44
ab
±5.26
LHRH-a
(µg/kg) +
Dom
150 43.7
a
±15.9 41.7
c
±6.95 8.79
bc
±6.86
1,000 35.2
a
±5.17 30.9
a
±3.79 10.6
c
±6.57
1,500 36.3
a
±4.55 31.8
ab
±7.52 8.53
bc
± 4.34
HCG
(UI/kg)
2,000 43.6
a
±4.93 38.5
bc
±7.82 8.31
bc
±4.89
The means with different superscripts within the same column indicate significant
differences among stages of gonad development (P<0.05).
3.3.3. Impacts of water salinity into hatching rate of eggs
3.3.3.1 Temperature and pH variation during eggs incubation
process
Temperature of eggs incubation tanks varied from 25.5 to 27.7
o
C.
The pH parameter was ranged from 8.0 to 8.6 in the incubation tanks;
however, it shows fairly small variation level in each incubation tank
separately (0.0-0.2).
22
Table 3.16: Temperature variation in the tanks during eggs incubation process by
different salinity levels testing
Experiment
plots (‰)
At the
beginning
point
4 hours 8 hours 12 hours 16 hours 20 hours
0 25.5±0.06 25.6±0.00 25.6±0.12 26.7±0.06 26.5±0.06 26.5±0.10
5 26.1±0.00 26.0±0.06 26.2±0.00 27.4±0.00 27.2±0.00 27.0±0.00
10 25.7±0.00 25.7±0.23 25.7±0.00 26.5±0.06 26.4±0.06 26.4±0.00
15 26.2±0.00 26.1±0.06 26.4±0.06 27.6±0.10 27.3±0.06 27.0±0.06
20 25.7±0.00 25.7±0.06 25.8±0.06 26.6±0.06 26.4±0.00 26.5±0.00
25 26.0±0.06 26.1±0.06 26.4±0.00 27.3±0.36 27.3±0.06 27.1±0.00
30 26.1±0.06 25.8±0.10 25.9±0.00 26.8±0.06 27.2±0.06 26.4±0.12
Table 3.17: pH variation in the tanks during eggs incubation process by different
salinity levels testing
Experiment
plots (‰)
At the
beginning
point
4 hours 8 hours 12 hours 16 hours 20 hours
0 8.43±0.12 8.27±0.15 8.33±0.25 8.30±0.17 8.30±0.10 8.43±0.21
5 8.43±0.06 8.30±0.00 8.33±0.06 8.40±0.00 8.23±0.06 8.30±0.00
10 8.20±0.00 8.13±0.15 8.07±0.06 8.07±0.06 8.10±0.00 8.07±0.06
15 8.33±0.06 8.30±0.00 8.30±0.00 8.30±0.00 8.23±0.12 8.30±0.00
20 8.10±0.00 8.13±0.06 8.13±0.06 8.17±0.06 8.23±0.06 8.17±0.06
25 8.30±0.00 8.30±0.00 8.27±0.06 8.30±0.00 8.27±0.06 8.30±0.00
30 8.23±0.06 8.30±0.00 8.23±0.06 8.27±0.06 8.30±0.00 8.23±0.06
3.3.3.2 Results on eggs incubation at the different salinity levels
testing
The peak of eggs hatching
rate reached at 43.3% in the
experiment plot with 30‰ of
water salinity used, and the
hatching rate of this salinity level
is significant difference
statistically (p<0.05) to that of
other salinity levels testing (Fig.
3.14).
0
10
20
30
40
50
0‰ 5‰ 10‰ 15‰ 20‰ 25‰ 30‰
Experiment plots
Eggs hatching rate (%)
b
aa
c
d
e
d
Figure 3.14:
Results on eggs incubation
23
3.4. The enteron growth and feed selection capacity of fry spotted
scat fish
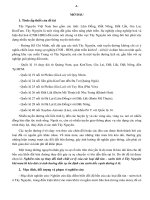
3.4.1. The enteron growth of fry spotted scat fish
3.4.1.1 The enteron form of fry spotted scat fish
After eggs hatched stage, the enteron of fry spotted scat fish have
just had a straight duct form, and not developed yet to the specific
parts separately of a completed digestive system. Three days later, the
enteron form has been distinguished more clearly as mounth part,
gullet, stomach, and intestines (Fig. 3.16); and after 20 experimental
days, the digestive system of fry spotted scat fish was developed
completely as mature fish with appearance of the stomach’s glands
(Fig. 3.17 and Fig. 3.18).
Dạ dày
Ruột
Fig. 3.15: The enteron form
of mature spotted scat fish
Cá nâu 1 ngày tuổi (20x) Cá nâu 3 ngày tuổi (20x)
Noãn hoàng
Ruột
Thực quản
Dạ dày
1
-
day
-
old
(20X
)
3
-
day
-
old
(20X
)
Fig. 3.16: The enteron form of fry spotted scat fish
Cá nâu 3 ngày tuổi (20x) Cá nâu 20 ngày tuổi (10x)
Dạ dày
Thực quản
Ruột
Màng nhày
3
-
day
-
old
(20X
)
20
-
day
-
old
(
1
0X
)
Fig. 3.17: The forms of fish gullet,
stomach, and intestines
Cá nâu trưởng thành (10x) Cá nâu 20 ngày tuổi (10x)
Dạ dày cơ
Dạ dày tuyến
Tuyến dạ dày
Tế bào tiết
20
-
day
-
old
(
1
0X
)
Mature spotted scat fish (10X)
Fig. 3.18: The stomach’s glands of spotted
scat fish
3.4.1.2 Gullet
The gullet of spotted scat fish has been distinguished separately to
other parts of the digestive system; appearance of greasy compound
that had been produced and discharged from epithelium cells at the
three days old is an indicator of the difference (Fig. 3.19).
24
3.4.1.3 Stomach
The stomach of spotted scat fish could be distinguished completely
at the three days old, this is a large distended part that was connected
directly to the end part of fish gullet, and its role is a feed storage bag
(Fig. 3.16). However, fish
stomach is only developed
completely at the twenty days
old with appearance of the
stomach’s glands (Fig. 3.18).
3.4.1.4 Intestine
There are not different in
term of morphologic features
among intestine’s parts of
spotted scat fish (i.e. small, middle, and large intestines).
At the fifteen days old, there were appearances of lipid vacuoles and
protein inclusion bodies. Besides, caecum has been beginning to take
shape in the digestive system of spotted scat fish at this time (Fig.
3.21).
Fig. 3.20: Intestines of spotted
scat fish at
15 days old
Cá nâu 15 ngày tuổi Cá nâu trưởng thành
Manh tràng
M
ature
spotted scat fish
(
1
0X
)
15
-
day
-
old
Fig. 3.21: Caecum of spotted scat fish
(10x)
Không bào lipid
Thể vùi protein
Cá nâu 20 ngày tu?i (10x) Cá nâu tru? ng thành (10x)
N?p g?p th?c qu?n
Th?c qu?n
M
ature
spotted scat fish
(
1
0X
)
20
-
day
-
old
(
1
0X
)
Figure 3.19: The vertical view of spotted
scat fish’s gullet