Sludge concentration dynamic distribution and its impact on the performance of UNITANK
Bạn đang xem bản rút gọn của tài liệu. Xem và tải ngay bản đầy đủ của tài liệu tại đây (649.3 KB, 7 trang )
Available online
at
www.sciencedirect.com
ScienceDi rect
Journal
of
Environmental
Sciences
19(2007) 141-147
JOURNAL
OF
ENVIRONMENTAL
SCIENCES
ISSN
1001-0742
CN-l1-2629/X
www.jesc.ac.cn
Sludge concentration dynamic distribution and its impact
on
the
performance
of
UNITANK
ZHANG
Fa-gen’,
LIU
Jun-xin’>*,
SUI
Jun2
1.
Reseorch
Center
for
Eco-Environmenral Sciences, Chinese Academy
of
Sciences, Beijing 100085, China. E-mail:
2.
Guangzhou
Municipal Engineering Debign and Research Institute, Guangzhou 510060, China
Received
3
March
2006;
revised
I
I
May
2006;
accepted
29
May
2006
~ ~~~~ ~ ~~~~~~~
~ ~~~
Abstract
UNITANK
i\
a
biological wastewater treatment process that combines the advantages
of
traditional activated sludge process and
sequencing batch reactor, which is divided into Tank
A,
B
and
C.
In this study, the sludge distribution and its impact on performance
of
UNITANK were carried
out
in
Liede Wastewater Plant (WWTP)
of
Guangzhou, China. Results showed that there was
a
strong
affiliation
between
Tank
A
and
B
of
the system
in
sludge concentration distribution. The initial sludge concentration in Tank
A
could
present
the
sliidge distribution
of
the whole system. The sludge distribution was mainly influenced by hydraulic condition. Unsteady
sludge distribiition had an impact on variations of substrates in reactors, especially in decisive reactor, and
this
could lead
to
failure
of system. Sertler could partially remove substrates such
as
COD
and N03-N, but there was adventure
of
sludge deterioration. The
rational
initial
sludge concentration
in
Tank
A
should
be
4000-6000
mg/L
MLSS.
Key
words:
I
SITANK; dudge concentration; dynamic distribution; in-process study
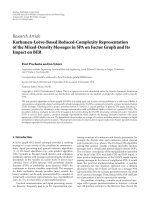
Introduction
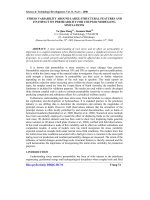
UNITANI; is
a
biological wastewater treatment pro-
cess that cor ibines the advantages of traditional activated
sludge proct’ss and sequencing batch reactor (SBR).
It
is one rectangular reactor which is divided into three
tanks, nametl as Tank A,
B
and
C
(Fig.1). The volumes
of the three tanks are same and each tank is equipped
with aeratioii and agitation systems. The process works
according to
;1
cyclic operation,
of
which Tank
B
works
as reactor
01-
ly,
Tank A and
C
as either reactor or settler.
The three tanks are connected with each other by pipe from
bottom
or
via
perforated
wall.
The wastewater is fed to
Tank
A.
B
2nd
C
alternatively and the cleaned water is
discharged
from
Tank
C
or
A.
There are no primary settler
and sludge
re
turn facilities.
UNITANF.
is commonly considered as modified SBR.
However, it
IS
quite different from
SBR
in
configuration
and hydrauli’r condition because both influent and effluent
are continuods.
In
a sense,
it
is more similar to a nor-
mal
multi-reictor process, such
as
A/O
or
UCT, but
no
sludge
or
mived
liquor
returns. UNITANK is not special
in
configura ion and its biological processes seem no
difference
fr
)m
usual biological treatment mechanisms,
such as
deg
-adation
of
organic carbon, transformation
of nitrogen md removal of phosphorus (Barker
et
al.,
1997; Brdjar ovic
et
al.,
2000: IIenze
et al.,
1987,
1995,
199Y).
The particular advantages of UNITANK include
Project
supported
hy
the National Natural Science Foundation of China
(No.
502380.50)
‘Corresponding author.
E-mall:
construction-compact, space-saving, cost-effective, flexi-
ble operation and easy to maintenance. Alternate control
can perform a cycle of the anaerobic, anoxic, aerobic and
settling conditions in one tank
to
remove organic substrate
and enhance biological nutrient removal.
Since the running scheme is flexible, it is difficult to
analyze its performance. UNITANK, strictly saying,
is
not
a steadily running system because sludge concentrations
in all tanks, hydraulic condition and effluent quality are
unsteady. How to estimate its characteristics is still unsure.
The conclusions from lab-scale or pilot-scale experiments
do not always work well in full-scale plant since they
are quite different. Additionally, little attention has been
given to UNITANK performance
so
the in-process study is
necessary and useful
to
mend
UNITANK.
Since no sludge
returns into the UNITANK reactors, the sludge distribution
will be different in Tank A,
B
and
C,
and changes with
operation time. This sludge distribution will influence the
performance of UNITANK. Therefore, the sludge distribu-
tion in the tanks and its impact on UNITANK performance
were investigated in this paper.
UNITANK process is used in Liede Wastewater Treat-
ment Plant
(WWTP)
of Guangzhou City and the study was
carried out in this plant in one year
of
2004. The study was
first focused on the sludge distribution in the tanks and then
on the in-process performance of UNITANK.
1
Materials and method
1.1
Full-scale
UNITANK
process
About 260000 m3/d of wastewater
was
treated by the
I42
ZHANG Fa-gen
et
d.
Vol.
19
A
B
C
A
B
C
Feed wastewater
X-b
A
H
C
A
H
C
Lf
Surplus sludge discharge
f
.Effluent
A
J.
Flush
water
B
C
Fig.
I
Configuration
of
conventional UNITANK.
Unitank
process
-+
UNITANK process in Liede WWTP. The layout
o€
UNI-
TANK process is shown in Fig.2.
In this UNITANK process, there are eight independent
UNITANK units, which form four groups (group
14), and
each group includes two parallel UNITANK units (Fig.3).
The inclined-tube systems are equipped in Tank A and
C of each unit (Fig.1) to increase the efficiency of solid-
liquor separation. Each unit has a total effective volume
of
about
14000
m3. The raw wastewater is lifted by pump
with a mean flow rate
of
1365
m3/h
into each unit and the
corresponding hydraulic retention time (HRT) is about
10
h.
1.2 Analytical methods
MLSS, MLVSS,
SS,
COD,
BOD5,
NH3-N, NO3-N
and PO4-P were determined according to the standard
methods (APHA,
1995). Fractions of
COD,
name-
ly readily degradable-soluble COD(&), inert-soluble
COD(Sl), slowly degradable-particulate COD(Xs) and
inert-particulate COD(X1) were determined in other ways
(Henze
et
al.,
1995,
1999; Roelveld and van Loosdrecht,
2002).
MLSS was used as sludge concentration index.
COD,
NH3-N, N03-N and PO4-P were chosen as substrate in-
dices.
1.3
Operation
conditions
1.3.1 Raw wastewater
The raw wastewater came from the municipal sewer and
entered the UNITANK process via
a
grit chamber (Fig.2).
Its characters are shown in Fig.4.
Chlorination Effluent
+
toPearl
tank
River
Grit
bP
''Ieens
bl
chamber
Raw wastewater
L
Group
4
A
lBIC
Group
2
Fig.
3
Layout
of
UNITANK process in Liede WWTP.
With low substrate concentrations, the raw wastewater
was typical in Southern China.
BOD5
wa5 between
50
and
120 mg/L with average
of
84
mg/L.
COD
was between
90
and 200 mg/L with average
of
150
mg/L, of which
SS,
SI,
XS
and
XI
accounted for about 14%, 16%, 43% and
27%, respectively.
SS
was between 80 and 160 mg/L with
average
of
104
mg/L. NH3-N was between
10
and 40
mg/L
with average of 22 mg/L. TP was between 1.7 and
3.5
mg/L with average
of
2.6
ma,
of
which PO1-P accounted
for about
70%-90%.
1.3.2
Running
and
sampling scheme
An operation cycle is composed
of
two half-cycles with
same running schemes, in which the raw wastewater flows
from Tank A to Tank C during the first half-cycle, and from
Tank
C
to
Tank A during the second. Therefore, only one
half-cycle was researched in this study. This half-cycle
scheme
is
shown in Table
1
and divided into
four
periods
named as Period 1,2,3 and 4, respectively.
In
this scheme,
Tank
A
and
B
worked as reactor, and Tank
C
as settler.
Eight sampling points were chosen in each tank and
samples from these eight points were mixed as an instan-
taneous sample.
The sampling scheme
of
Tank A and
B
for MLSS is
shown in Table 2.
No
sample in Tank A was taken from
&BOD5
*CODcr*NH3-N-TP
+SS
180
I
I
ii
;:[T>Gj
0
12
3
4
5
6
7
8
9101112
Month
Fig.
4
Characters
of
raw wastewater in
year
2004.
Table
1 First
half-cycle scheme
of
UNITANK
in
Liede
WWTP
~
Period
Start
point Pcriod
1
(60
min) Period
2
(120
min)
Period
3
(30
min) Period
4
(30
min)
Tank
A
Feed
Feed/Aerohic
Feed/Anoxic/Anaei.obic
Aerobic Settling
Tank
B
Aerobic Aerobic
Feed/Anoxic Feed/Anaerobic
Tank
c
Settling Settling
Settling Settling
No.
2
Sludge concentratinn dynamic dimbution and
Its
impact on
[he
performance
of
UNITANK
Table
2
Sampling
scheme
for
MIASS
in
Tank
A
and B
~
~~ ~
143
~
Senea number
1
2
3
4
5
6
7
8
9
Tank
A
(min)
I
5
20
35
50
180
195 210
Tank
B (min)
I
30 60 90 I20
I
50
180
210 240
the 60th
to
18
0th min since inclined-tube system made the
sample unrepresentative during anoxic or anaerobic period
(Table
1).
Continuou Jy changing sludge concentration would lead
to variations
in
organic loads, oxygen concentration and
efficiency
of
iubstrate removal. The effect
of
this change
could be reflected by in-process study
on
variations of
substrate. Tink
B
is decisive in whole UNITANK unit,
so
the variations of substrate in Tank
B
were studied.
The substrates in effluent were also studied
to
analyze the
efficiencies
o
,'
biological treatment and settling.
The sampling scheme
for
in-process study
is
shown
in Table
3.
During this half-cycle, the raw wastewater
quality was considered unchangeable. The samples from
Tank
A
(not shown
in
Table
3).
B
and
C
represented
the raw wastewater, variations of substrate and effluent,
respectively.
Table
3
Sampling scheme
for
water
quality
in Tank
C
and Tank B
Seriesnumher
1
2
3
4
5
6
7
TankC(min)
1
30 60 120
180
211)
TankB(min)
I
30
60 120
180
210
240
1.3.3
Other
conditions
During tht whole study, the running scheme was
un-
changed. Tc mperature was between
13-27°C.
The raw
wastewater
u
as weak alkali with pH value of
7.2-7.5.
The
controllable t'actors included qoluble oxygen and initial
sludge concentration
in
Tank
A.
During this experiment,
the ratio of
MLVSS
and
MLSS
was almost stable.
2
Results and
discussion
2.1 Sludge distribution
FigsSa an1 5b show the
MLSS
distribution in Tank
A
and B, respexively.
Sl-S7
were the test results in seven
half-cycle$.
Since the law wastewater cntered Tank
A
and its mixed
liquor flowed into Tank
B,
the
MLSS
in Tank A decreased
continuously (Fig Sa). The higher the initial sludge con-
centration was, the more it reduced. The
MLSS
was
4000-1
3000
mg/L at the $tart and
3000-5000
mg/L
in
the
end (FigSa). The reduction rate
of
MLSS
was
4.8-38.1
mg/(
L-min).
The change
of
MLSS in Tank
B
was quite different from
that in Tank A (FigSb). At the start, the
MLSS
was higher
in
Tank
A
than in Tank B
so
that the MLSS accumulation
was greater than the
MLSS
loss
in Tank
B.
As
a
result,
the MLSS in Tank
B
ascended quickly in the former
90
min. Between
90-150
min, the
MLSS
in Tank
B
began
to descend because the MLSS in Tank A became lower
and
less
MLSS entered Tank
B.
Between
150-180
min,
the MLSS in Tank
B
descended more quickly since the
MLSS
became lower in Tank
A
than in Tank
B.
After
180
min, the
MLSS
in
Tank
B
decreased much more quickly
because no MLSS entered Tank B from Tank A, and the
raw wastewater was fed into Tank B.
The test results from other UNITANK units showed that
MLSS variations were similar to that in FigsSa and
5b.
Theoretically, the mass balance equation
of
MLSS
in
Tank
A
or B is given by Leslie
et
al.
(1999):
V-
dC
=
FCo
-
FC+
rV
at
Where,
C
is the MLSS in reactor
(mg/L);
C0
is the
MLSS
of
influent, equal
to
SS
in raw wastewater into Tank
A
or
MLSS
from Tank
A
into Tank
B
(mg/L);
V
is the
effective volume
of
reactor
(m');
F
is the flow rate (m3/h);
r
is the reaction rate (mg/(L.h)).
The change
of
MLSS can be simulated according
to
Equation
(1).
Considering the raw wastewater quality
stable and choosing
S2
(FigsSa and
5b)
as target, the
changes of the measured and simulated MLSS in Tank A
and
B
are shown in Fig.6.
Evidently, the simulated results do
not
accord with the
measured perfectly. From measured results and Equation
(1
),
it can be concluded that the sludge distribution is
influenced by not only HRT, initial sludge concentration,
4000
In
0000
2000
h
_ _
0
30
60
90
120 150
180
210
5500
r.
I
4500
-
='
3500
v
v:
2500
1500
E
500
2
0
30
60
90
120
150
180
210 240
Time
(min)
Time
(min)
Fig.
5
MLSS
change
in
Tank
A
(a)
and Tank
B
(h)
of
UNITANK.
%HANG
Fa-gen
et
al.
~ ~~~~
Vol.
19
~~
10000
9000
a
8000
3
7000
6000
5
5000
4000
m m
2000
(lIUI
I
0
30
60
90
120
150
180 210
Time
(min)
5500
I
I
3500
3000
1000
0
30
60
90
120
150
180 210 240
Time
(min)
Fig.
6
Changes
of
measured and simulated
MLSS
in Tank
A
(a) and
B
(b).
sludge growth and discharge but the structure of reactor.
For UNITANK, HRT plays the most remarkable role
influencing the sludge distribution. It could be estimated
that the sludge concentration in Tank
A
would be too low
if
the raw wastewater was fed to Tank A for a very long
time,
so
did Tank
B.
Therefore, HRT and the half-cycle
and feeding period should be well controlled.
2.2
Evaluation
of
SRT
in
UNITANK
Sludge retention time (SRT) plays an important role in
BNR system (Yoshitaka. 1994; Peter, 1998; Ligero
et
al.,
2001; Henze
et
al.,
2002; Liss et
al.,
2002; Adeline
et
al.,
2003; Clara
et
al., 2005). In general, it can be defined as
Equation
(2)
(Leslie
et
al.,
1999):
MT
SRT(d)
=
-
Md
where,
MT
is the total mass
of
sludge in system, and
Md
is
discharged mass
of
sludge everyday.
In most cases, intermittent sludge discharge
is
applied
in UNITANK process.
So
specific calculating method of
SRT for intermittent sludge discharge is introduced as:
MTXt
SRT(d)
=
~
Md
x
24
(3)
Where,
t
is the time length of one half-cycle (h);
24
is
24 h of a day.
Md
is an easily-controlled parameter via batch pumping
of sludge from settling area.
MT
is
a
troublesome param-
eter because MLSS varies in both reactor and settler
so
that total mass can not be determined easily. To calculate
MT,
the relativity of MLSS between Tank
A
and
B
was
investigated (Fig.7).
It is obvious that the MLSS in Tank
B
is corresponding
to that in Tank A. In other words, the higher the initial
MLSS in Tank A is, the higher the MLSS in Tank
B
is
during the half-cycle. The initial MLSS
of
S1
in Tank
A
was about 13000 mg/L, the MLSS of
S1
in Tank
B
increased from about 3000 mg/L of the initial to
5000
mg/L of peak value. The initial MLSS
of
S2 in Tank A
was about
7000
ma, the MLSS of
S2
in Tank
B
increased
from about 2000 mg/L of the initial to
4000
mg/L of
peak value. Furthermore, in Tank
B, the final MLSS were
basically same with the initial one. Results indicated that
this phenomenon was similar before or after this half-cycle
for a considerably long time if excess sludge discharge
was rational.
MT
could then be evaluated according to the
nearest half-cycles.
MT
can be divided into three parts:
(1)
sludge mass in Tank A (SMST);
(2)
sludge mass in Tank
B
(SMMT) and (3) sludge mass in Tank
C
(SMSA).
MT
can
be calculated by:
MT
=
SMST
+
SMMT
+
SMSA
(4)
According
to
the running scheme (Table 1) and results
in FigSa, MLSS in Tank
A
was stable after
180
min until
the end.
So
the SMST and SMMT can be calculated by the
effective volume of Tank
A
or
B
and corresponding MLSS
concentration at the end
of
this half-cycle. SMSA can be
made certain as the initial MLSS in Tank
C
at next half-
cycle.
For UNITANK, the evaluation of SRT could be based
on Equations (3) and (4).
In
this study, the real SRT was
mean value of ten nearest half-cycles’ SRTs of same unit.
As
discussed above, a steadily running UNITANK
process keeps strong affiliation between Tank A and Tank
B
in sludge concentration. Given the initial MLSS in
Tank A, the MLSS distributions in Tank A and
B
could
be
described. SRT could be easily-controlled
if
the on-
line sensor and
fuzzy
monitor are used for manual control
(Wong
et
al.,
2005; Chang
et
al.,
2003).
2.3
In-process study on variations
of
substrate
Only the initial sludge concentration in Tank A was test-
ed since
it
could present the MLSS distribution basically.
t
S1-TankA
+St-TankB
+-
S2-Tank
A
+-
S2-Tank B
+
S3-Tank
A
+
S3-Tmk
B
13000
11000
0
30
60
90
120 150 180 210
240
Time
(min)
Fig.
7
MLSS
relativity
in
LJNITANK
units.
No.
2
Sludge concentration dynamic distribution and its impact on
the
performance
of
UNITANK
145
Influent quality was considered stable during the tested
half-cycle.
2.3.1
Variations
of
substrate
in
Tank
B
Part precondition data are shown in Table
4.
Variations
of
COD, NH3-N, NO3-N and PO4-P are shown in FigsAa,
8b, 8c, and 8d, respectively.
Generally speaking, except PO4-P, the change trend of
the rest was basically similar.
This trend was accordant
with that of
MLSS
in Tank B (FigSb). It could be
explained by equation (Henze
et
al., 1987, 1995, 1999;
Leslie
et
al.,
1999):
Where,
r
is the reaction rate (g/(L.d));
pmax
is the
maximum specific growth rate (d-');
Ks
is the half satu-
ration coefficient
(ma);
S
is the substrate's concentration
(ma) and
X
is the sludge concentration
(g/L).
It should be mentioned that most NH3-N had been
transformed into N03-N and the change trend of N03-N
Table
4
Partial
precondition data
for
in-process
study
on
Tank
B
Scries code
c1
c2 c3
Initial sludge concentration
in
Tank
A
(ma) 6959 6501 5801
SRT
(d)
=I1
=8 >20
COD of influent (m&)
28.5 223 118
NH3-N
of influent (mg/L)
21.4 28.3 22.8
NO3-N
of
influent
(m&)
0
0.2
0
PO4-P
of influent
(mgiL)
2.9 2.2
1.8
C1,
C2 and C3 are
the
test results
in
several
half-cycles.
~~~
~~~~ ~
was opposite to that of NH3-N.
So
only the change trend
of NH3-N needs be analyzed.
In the first 90 min,
S
was very high and
S/(Ks+S)
changed little
so
that
r
increased with
X
ascended. As a
result, the transformation of substrate speeded up and the
S
went down. Between 90-150 min,
S
was tended to be
low
and
S/(Ks+S)
began to decrease obviously. Although
X
continued to ascend,
r
decreased.
So
the transformation
of
substrate slowed down. Between 150-180 min,
X
began to
descend but
r
and
S
were still low, leading to little change
of
S.
After 180 min, the raw wastewater was fed to Tank
B
and
X
began to descend faster. On the other hand, the Tank
B
tended to be anoxic, which influenced
r
greatly. As a
result, in Tank B, the entered
S
surpassed the transformed
S,
leading to the accumulation of
S.
For example, for NH3-
N
of
C2 (FigAb),
Ks
is about
1
ma, changes of other
parameters are shown in Table
5.
However, the transformation of substrate
is
so
complex
that Equation
(5)
could not describe it accurately. Ac-
cording to the observation, Equation
(5)
could explain the
transformation of substrate rationally.
For
PO4, its removal is accomplished mainly by two
sequencing biological processes of anaerobic release and
aerobic (anoxic) excess uptake and by process of chemical
precipitation (Henze
et
al.,
1995, 1999; Rieger
et
al.,
2001). The efficiency
of
PO4-P removal is influenced by
SRT, influent quality, COD/PO4-P, oxygen, alkalinity and
N07-N. The PO4 varied between
0.2-0.5
mg/L
(C2
and
C3
in Fig.Sd), which shows UNITANK process's potential to
remove PO4 efliciently. Further study should be conducted
Table
5
Changes
of
parameters in Equation
(5)
for
NH3-N
of
C2
Time (min)
1
30 60 90
120
150
180 210 240
S
6.6 4.6 2.2 =lS* 0.4 =0.2*
0.1
1.8 4.8
X
3.3 3.8 4.2 4.3
4.5
4.4 3.8 3
.S
3.3
SWs
+s)
0.87 0.82
0.69
0.60
0.29
0.17
0.09 0.64 0.83
r
(wmd
2.86
3.12 2.88 2.58 1.29 0.73 0.35 1.35"* 1.64**
*Fitted data according
to
plotted curve (Fig.%); **the anaerobic (anoxic)
pmax
is
about
60%
of
the aerobic
hax
75
65
5
55
3
45
8
35
P
25
15
-
c1
-x-c2
I
16
0
0
30
60
90
120
150 180 210
240
& C3
t
t
Time
(min)
Time
(min)
1.4
1.2
3
1.0
2
0.8
v
?,
0.6
0
a.
0.4
0.2
0
0
30
60
90
120 150 180
210
240
0
30 60
90
120 150 180 210
240
Time (min)
Time
(min)
Fig.
8 Variation of COD
(a),
NH3-N
(b),
NO3-N
(c)
and
PO?-P
(d)
in
Tank
B
146
ZHANG
Fa-gen
er
al. Vol.
19
on
PO4
remcnal.
Period
3
and 4 (Table
1)
are two transitional stages
during which. the raw wastewater must be fed into Tank B.
As
discussed above, the anoxic and anaerobic conditions
are not good
for
substrate removal. Therefore, the decisive
tank should riot be anoxic or anaerobic. The impact of
sludge conceiitration
on
substrates removal is not obvious
but
long
SRT
ielps to remove NH3-N (Table 4 and Fig.8b).
2.3.2
Variations
of
substrate in effluent
Table
6
shows part precondition data that were similar
to that
in
Table 4.
So
the change trend
of
substrate in Tank
B of this study should be accordant with that in Fig.5b.
Between 210-240 min, both Tank
A
and
C
worked
as
settler
so
no
$ample was taken. Variations of COD,
NH3-
N,
N03-N
an11
POJ-P
are shown
in
Figs.9a, 9b, 9c and 9d,
respectively.
Table
6
Partial
precondition data
for
in-process study
on
effluent
Series code
CI
c2
C3
Initial concentral
on
in
Tank
A
(m@)
62
I8
4708
505
I
SRT
(d)
=I2
>
20
=7
COD
of
influent
ma)
198
164
180
NH3-N
of
influer
L
(ma)
26.7
17
23.6
NO3-N
of influrr
I
(mg/L)
0
0
0
P04-P
of
influen'
(ma)
2.
I
I
.7
2.9
CI,
C2,
and
C3
3%
the
tat
results
in
several half-cycles.
Usually.
the
settler is considered simple solid-liquor sep-
arator where
IIO
bio-chemical reaction happened (Henze
et
ul.,
1987, 1995. 1999). Since intermittent sludgc discharge
is applied, thzre must be too much sludge accumulated
in
settler before
it
is discharged.
As
a result, the sludge
possibly oveiflows into the effluent (Hasselblad
et
al.,
1998). Furthl:rnmore, the bio-chemical reactions. such as
denitrificatior
.
could happen during settling (Kazmi
et
al.,
2000: Siegrist
eta/
1994).
Fig.
10
\holvs
the performance characteristic
of
settler.
45
42
a
39
1
73
-
E
30
-
~
___
-
The parameter
of
solid removal efficiency is introduced
to describe the settler's characteristic. The maximum,
minimum and mean values of removal efficiency were
99.8996, 99.27% and 99.68%, respectively. The results
suggested that
no
obvious sludge overflowed and very few
particulate substrates appeared in effluent. The sludge
stayed
in
the settler for about
4
h before it
was
discharged.
With addition and compaction of sludge, the sludge layer
tended to be anoxic. The
in
situ
measurements by sensor
proved that the oxygen concentration in the sludge layer
was approximately
0.1-0.8
mg/L
and the denitrification
would happened in this situation.
If
the settler is considered simple solid-liquor separator,
the change trend
of
substrate in effluent should be accor-
dant with that in Tank
B.
Evidently, the change of substrate
in effluent was
not
as
sharp as that in Tank B. COD reached
the lowest at about 120 rnin in Tank B (Fig.8a) but at
about
30
min in the settler (Fig.9a). It indicated that
thc denitrifier consumed the biodegradable COD which
was not degraded completely in Tank B, leading to COD
reduction. At the same time,
N03-N
was transformed
so
it
did not increase until
30
min (Fig.9~). Insufficient
biodegradable
COD
made no further
NO?-N
reduction
since about 7.7 g COD is needed for transforming 1 g
N03-N
(Siegrist
et
al.,
1994). For example COD of
C2 (Fig.9a),
SI
in influent was about
26
mg/L and the
initial COD in settler
was
36
mg/L.
So
about
10
mg/L
COD
was available for denitrification and about
I
.3
mg/L
NO3-N
would be transformed. Unfortunately, the
NO?-N
would not be transformed completely lacking of sufficient
COD
supply. After
30
min, the COD supply from Tank
B reduced,
so
transformed
N03-N
reduced, leading to
increasing
NO?-N
in effluent.
Since the bio-chemical activity was going
on
in settler,
the sludge would undertake endogenous respiration be-
cause of insufficient COD supply.
As
a
result, the
NH3-N
could be released (Henze
et al.,
1987, 1995, 1999), which
might make
NH3-N
increasing in effluent. Fig.9b shows
I
1
1
I
I
b
0
30
60
90
120
150
180
210
Time
(min)
10
8
6-
4
,r
2-
-
*
1
1
1
0
30
60
90
120
150
180
210
'lime
(min)
18
16
b
14
2
12
v
2
10
78
z4
26
2
n
0
30
60
90
120
150
180
210
Time
(min)
2.0
,
I
1.8
1.6
1.4
1.2
1
.0
0.8
0.6
0.4
0.2
c
I
01
I
I
1
I
I
I
I
0 30
60
90
120 150
180
210
Time
(min)
Fig.
9
Vanation
of
COD
(a).
NH3-N
(h),
NO3-N
(c) and
Po4-P
(d)
in
effluent.
No.
2
Sludge
concentration dynamic distribution and
its
impact
on
the
performance
of
UNITANK
147
~
h
100.0
,
.cI
I
e
c
99.8
E
."
3
99.6
0
-
g
99.4
8
'
99.2
s
v1
99.0
I
II
-
0
4
8 12
16
20
24
28 32
Datum
code
Fig.
10
Settler's characteristic
of
UNITANK.
that the NH3-N changed unsteadily, which
is
different
from that in Fig.8b. It indicated that the
too
high
sludge
concentration is bad for NH3-N removal but long
SRT
and
comparatively lower sludge concentration help to remove
NH3-N (Table
6
and
Fig.9b).
It
is
still difficult
to
describe
what
happened
on
PO4-P.
In
C3,
the
PO4-P
decreased
from
1.8
to
0.6
mg/L
and
in
C2,
PO4-P
was
between
0.4
and
0.6
mg/L
(Fig.9d). But the
high sludge concentration might
release
more
PO4-P
into
effluent (C1
and
C2
in
Fig.9d).
Some
explanations
refer
to
2.4.1.
3
Conclusions
The
sludge
distributions
in
Tank
A
and
B
are
corre-
spondent.
Given
the
initial
sludge
concentration
in
Tank
A,
the
sludge
distributions in reactors
could
be
described.
The sludge distribution in reactors is mainly influenced
by
hydraulic condition.
The
HRT
and
lengths
of half-cycle
and feeding period should be
well
controlled.
The
performance of
UNITANK
is
influenced strongly
by sludge distribution.
Unsteady
sludge concentration
leads to the variations
of'
substrates. Especially
in
decisive
reactor, the conditions
of
sludge concentration
and
oxygen
should be strictly controlled. Steady
sludge
concentration
and
aerobic
situation
are very
important.
In settler, part
COD
and NO3-N could be removed by
denitrification, but
there
is adventure
of
sludge floating.
Furthermore, the accumulated sludge in settler may release
some substrate such
as
NH3-N,
so
the sludge concentration
should
be
rational.
The
initial sludge concentration in Tank
A
should
be
4000-6000 mg/L
MLSS.
Long
SRT
helps
to
remove
NH3-N. UNITANK is poten-
tial to
remove
PO4-P
but the mechanism should be studied
further.
References
Adeline
S
M
C, Hiroo T, Hiroyasu
S
et
al.,
2003.
Production of
polyhydroxyalkanoates (PHA) by activated sludge treating
municipal wastewater: effect
of
pH,
sludge retention time
(SRT), and acetate concentration in influent[J]. Water Res,
Barker
P
S,
Dold P L, 1997. General model for biological nutrient
removal activated sludge system: model presentation1 J].
Water Environ Res,
69:
969-984.
Brdjanovic
D,
van Loosdrecht
M
C
M,
Versteeg P
et
al.,
2000.
37: 3602-3611.
~~ ~~ ~ ~~ ~ ~ ~
Modelling COD,
N
and P removal
in
a full-scale WWTP
Haarlem Waarderpolder[J]. Water Res, 34: 846-858.
Carstensen J, Nielsen M K, Strandbak H, 1998. Prediction
of
hydraulic load for urban storm control
of
a municipal
WWT
plant[J]. Water Sci Technol, 37(12): 363-370.
Chang K
Y,
Peter A V, Lee
I
B,
2003. Nonlinear modeling and
adaptive monitoring with fuzzy and multivariate statisti-
cal methods in biological wastewater treatment plants[J].
Biotechnology, 10.5(1/2): 135-163.
Clara
M,
Kreuzinger N, Strenn B
et
al.,
2005.The solids retention
time-a suitable design parameter to evaluate the capacity of
wastewater treatment plants to remove micropollutants[J].
Water Res,
39(1):
97-106.
Hasselblad
S,
Bjorlenius
B,
Carlsson B, 1998. Use of dynamic
models to study secondary clarifier performance[J]. Water
Sci Technol, 37(12): 207-212.
Henze M, Grady C
P
L,
Gujer Jr
et
al.,
1987.
Activated sludge
model
No.
1 [R]. IAWPRC Scientific and Technical Report
No.
I,
London, UK.
Henze
M,
Gujer W, Mino T
et
al.,
199.5.
Activated sludge
model No.2[R].
IWAQ
Scientific and Technical Report
No.3,
London,
UK.
Henze
M,
Gujer W, Mino T
et
al.,
199.5.
Wastewater and biomass
characterization for the activated sludge model
No.2:
Bi-
ological phosphorus removal[J]. Water
Sci
Technol, 31(2):
Henze M, Gujer
W,
Mino T
et
al.,
1999. Activated sludge model
No.2D, ASM2D[J]. Water Sci Technol,
3%
1):
165-182.
Henzc M, Aspegren H, Cour J
et
al.,
2002. Effect of solids
retention time and wastewater characteristic on biological
phosphorus removal[J]. Water Sci Technol.
45(6):
137-144.
Kazmi A A,
Furumai
H,
2000. A simple model for batch activated
sludge process[J]. Water Sci Technol, 42(3/4): 9-16.
Leslie
G
C P, Glen Jr, Daigger T
et
ul.,
1999. Biological wastew-
ater treatment[M]. 2nd ed. New York: Marcel Dekker, Inc.
Ligero P, de Vega A, Soto M, 2001. Influence
of
HRT (hydraulic
retention time) and SRT (solid retention time)
on
the
hydrolytic pre-treatment of urban wastewater[J]. Water Sci
Technol, 44(4): 7-14.
Liss N
S,
Liao
B
Q,
Droppo
I
G
et
al.,
2002. Effect of solids
retention time
on
Aoc structure[J]. Water Sci Technol,
46(1/2):
431438.
Wong
M
T, blino T, Seviour R J
et
al.,
2005.
In
situ
identification
and characterization of the microbial community structure
of full-scale enhanced biological phosphorous removal
plants
in
Japan(J1. Water Research,
39(13):
2901-2914.
Peter
K,
1998.
Short SRT (solids retention time) nitrification
process/flowshcet[J]. Water Sci Technol,
38(
1): 23-29.
Rieger
L,
Koch
G,
Kuhni M
et
al.,
2001. The EAWAG bio-
P module for activated sludge model No ?[J]. Water Res,
35(16): 3887-3903.
Roelveld
P
J, van Loosdrecht M C M, 2002. Experience with
guidelines for wastewater characterization in the Nether-
lands[J]. Water SciTechnol, 45(6): 77-87.
Siegrist H, Gujer W, 1994. Nitrogen removal in activated sludge
system including denitrification in secondary clarifiers[J].
Water Sci Technol,
30(6):
101-1 11.
Standard methods for the examination
of
water and wastewa-
ter[S], 1995.
19th
ed. Washington
DC,
1JSA.
American
Public Health Association/American Water Works Associ-
ationwater Environment Federation.
Yoshitaka Matsuo, 1994. Effect of the anaerobic solids retention
time on enhanced biological phosphorus removal[J]. Water
Sci Technol, 30(6): 193-202.
13-23.