Uric acid production of man fed graded
Bạn đang xem bản rút gọn của tài liệu. Xem và tải ngay bản đầy đủ của tài liệu tại đây (612.44 KB, 6 trang )
892
TUE AMERICAN JOURNAL OF CLINICAL NUTRITION
Vol. 21, No. 9, September, 1968, pp. 892-897
Printed in (.S 4.
Original Communications
Uric Acid Production of Men Fed Graded
Amounts of Egg Protein and
Yeast Nucleic Acid”2’3
CAROL I. WASLIEN, DORIS HOWES CALLOWAY AND SHELDON MARGEN
A I(; AND BACTERIA form the basis of
candidate bioregenerative systems for
atmosphere control and food supply in
space missions. These and other micro-
organisms could also serve as economical
sources of protein to meet existing re-
gional needs and predicted world deficits.
However, consumption of such foods may
be restricte(l by their high nucleic acid
content. ln man the punine portion of
these compounds is diegraded to uric acid,
which has low solubility at the pH of body
fluids and is relatively poorly excreted by
the kidney. If the blood uric acid content
is elevated, crystals may form in the joints,
as in gout, an(l with excessive renal clear-
ance loads, stones may be deposited in the
urinary tract.
Studies have shown that plasma and
urinary uric acid levels are influenced both
by the amounts of nucleic acids (1-6) and
(7-14) in the diet. In most of these
reports, few subjects were studied; often,
dietary protein and nucleic acid varied
simultaneously or the duets were incom-
From the Department of Nutritional Sciences,
Unisersity of California, Berkeley, California 94720.
2 Supported in part by National Aeronautics and
Space Administration Grants NGR-05-003-068 and
N(;R-03-003-089 and National Institutes of Health
Grant AM 10202.
Presented at the 52nd Annual Meeting of the
Federation of American Societies for Experimental
Biology, Atlantic City, April 1968.
pletely described. Nugent and Tyler (5, 6)
used yeast nucleic acid as a supplement
to the normal diet thus eliminating the
increase in protein that occurs when less
refined sources of nucleic acid are fed,
but the basal diet of their subjects was not
stipulated beyond the specification of
“low-purine” foods. We have now evalu-
ated these two factors separately, using
carefully controlled diets, and the data
have been used to derive predictive equa-
tions describing the response to foods high
in nucleic acid.
METHOD OF STUDY
The subjects were healthy male volunteers
ranging in age from 21 to 38 years, in height
from 168 to 199 cm, and in weight from 56 to
106 kg. They were housed in a closed metabolic
unit and given a basic formula diet adequate and
constant in all known essential nutrients, ex-
cept when protein was deliberately reduced
(Table I). Caloric needs to maintain constant
body weight were met by additions of pure fats
and carbohydrates. When protein was reduced,
an isocalonic equivalent of carbohydrate was sub-
stituted. Egg albumin was the only source of pro-
tein and thus the diet was free of nucleic acid
unless it was added in the form of pure yeast
ribonucleic acid.’ Minimum fluid intake was
stipulated but subjects were allowed free access
to deionized water beyond the minimum. Total
Purchased from Calbiochem, Los Angeles, Calif.
Protein, RNA, and Uric Acid
893
fluid intake was recorded and there was no food
rejection.
The effect of variation in protein intake, at
several levels from 0 to 75 g/day, was evaluated
in a total of 20 different subjects, some of whom
were studied on more than one occasion. Each
dietary level of protein was administered for a
minimum of 9 days (usually 12-15), and the
first 6 days were allowed for adjustment to the
changed intake. Data on urinary uric acid are
the averages of individually pooled 24-hr out-
puts for the last 3-6 days of study, and plasma
uric acid concentrations are in fasting bloods
drawn the final morning of each period. Two of
the men were fed the control (75-g protein) diet
for 66 consecutive days, as an additional method-
ologic check. Their blood was sampled inter-
mittently and 72-hr urine collections were made
during the entire period.
In a separate study, five men were fed the con-
trol diet supplemented with 0, 2, 4, and 8 g of
RNA. Each dosage of RNA was given for 5 con-
secutive days, distributed equally among four
equal meals per day. The sequence in which
the dosages were administered was varied among
the subjects.
Urine was quantitatively collected and stored
in the cold without preservative. Its weight was
recorded daily and the total diluted to volume
with distilled water. Urinary and plasma uric
acid was determined by the enzymatic method of
Kalckar (15).’
RESULTS
Average daily urinary uric acid excre-
tions of the two long-term control sub-
jects were 327 ± 28 and 382 ± 50 mg,
based on fourteen 72-hr specimens. There
was no significant difference between ex-
cretion levels at the beginning of the
period of measurement and at the end,
indicating that no unintentional feature
of the experimental diet or regimen sys-
tematically affected synthesis or excretion
of uric acid. The daily output of these
men fell within the range of the total
population of 20 men studied. Average out-
put of the larger group was 392 ± 66
‘The enzyme, uricase, was purchased from
Worthington Biochemical Corp., Freeland, N. J., or
from Sigma Chemical Co., St. Louis, Mo.
TABLE I
Typical composition of a diet providing 75 g
of protein and 2,800 kcala
Component g/day
Egg albuminb
103
Sucrose
99
Dextri-Maltose (Mead Johnson)
177
Cornstarch
150
Corn oil
44
Crisco (Procter & Gamble) 49
Citric acid 5
NaCI 5
K,HPO43H20
4.378
CaHP042H,0
3.000
MgO
0.670
Synthetic flavoringc
0.400
#{176}Subjects also received daily: 10 g of decaffei-
nated coffee powder (Sanka, courtesy of the Gen-
eral Foods Corp.); a vitamin preparation (courtesy
of Hoffmann-LaRoche, Inc.) containing 2 nig
thiamine mononitrate, 3 mg riboflavin, 20 mg
niacinamide, 5 mg vitamin B,, 10 mg calcium
pantothenate, 50 i.tg d-biotin, 2 g vitamin B12,
4,000 IU vitamin A palmitate, 400 IU vitamin D,
35 mg dl-a-tocopheryl acetate, I mg menadione,
50 mg ascorbic acid, and 0.5 mg folic acid; and
a mineral supplement containing, in milligrams,
16.7 FeSO4’7 H,0, 1.79 CuCl22 H,O, 14.6 ZnSO4’7
H,O, 5.12 MnSo,H,0, 0.21 Na,Mo04-2 1-1,0,
1.07 Cr(S04)3. 15 H,0, 0.008 Na,SeO,, 28.3
AIK(S0,),. 12 H,, 2.0 NaF, and 0.2 K!. The total
diet provided 600 mg of nitrogen in addition to
the nitrogen from egg albumin.
Additional biotin, 200 Mg/day, was added to
formulas containing this amount of dried egg white.
This amount of flavoring (courtesy of Fir-
menich) was nearly devoid of nitrogen so indi-
vidual selection was permitted.
mg/day (Table ii). Mean control plasma
uric acid concentration was 4.7 ± 0.6 mg/
100 ml.
Urinary uric acid output fell and plasma
levels rose when dietary protein was re-
duced (Table ii). In the 10 subjects who
received both protein-free and control
diets, urinary uric acid excretion at 0-pro-
tein intake differed significantly (P < 0.01)
from paired values at the 75-g daily in-
take level of protein. Plasma uric acid
concentration was significantly (P <
Urinary Uric Acid
2,000
1,800
Plasma Uric AcidAvg
Protein
intake,
g/Man
per Day
0
22
28
37
75
1,600
Numbet
Df subjects
14
6
6
5
20
mg/24 hr
354 ± 67
337 ± 48
352 ± 72
331 ± 28
392 ± 66
Number of
subjects
8
10
6
5
13
mg/lOO ml
6.0 ± .7
5.2 ± .7
5.6 ± .7
5.8 ± .5
4.7 ± .6
800
600
400
TABLE III
Plasma and urinary uric acid of healthy men fed various amounts of yeast nucleic
acid with a constant, 75-g egg-protein diet
Plasmic Uric Acid, mg/100 ml
Nucleic
Acid,
g/Man
per I)ay
Subjects
1001
1002
1003
1004
1005
Urinary Uric Acid, mg/Man per 24 hr
0 2 4 8 0 2
5.0 6.0 8.8 10.2 405 663
4.7 6.0 7.7 9.5 430 765
5.2 6.1 6.8 7.2 338 668
5.5 6.6 8.0 10.2 316 542
3.9 5.3 7.1 9.7 378 698
4.9 6.0 7.7 9.4 373 667
4
1,123
867
963
713
1 ,028
939
1,522
1,317
1,676
755
1,697
1 ,393Average
894
Waslien et at.
TABLE II
Urinary and plasma uric acid of healthy
men fed graded levels of egg albumin
0.05) higher with the protein-free diet
than matched control values for five sub-
jects. A few of the men were fed inter
mediate levels of dietary protein, ranging
from about one-half (22 g) to the full
minimum need for dietary protein (37 g).
Average urinary excretion and plasma con-
centrations did not differ significantly
from the protein-free diet condition.
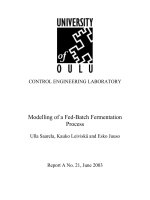
Typical response to addedl dietary RNA
is portrayed in Fig. 1. Urinary uric acid
excretion rose promptly and reached a
steady level of output at a higher level
than with the control diet, by the 2nd or
3rd day of 2-g dosage. Excretion rose
sharply on the 1st test day and more slowly
for the remainder of the time when the
4- and 8-g doses were given; the rate of
rise was greater with 8 than with 4 g.
5 10 5 20 25 30
Days of Study
FIG. I. Daily urinary uric acid excretion of sub-
ject 1005.
After RNA administration ceased, urinary
output fell, sharply on the 1st day and more
slowly thereafter, until control levels were
again attained, by the 3rd day. One man
did not behave in this typical fashion in
that his urinary uric acid output was es-
sentially the same at 4- and 8-g dosages of
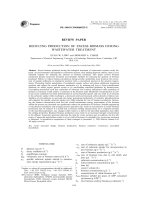
RNA. Excretion values, shown in Table
iii and used to compute the regression
equation diagrammed in Fig. 2, are aver-
ages of the last 3 days of each treatment
a
10
9
E8
8
r
E
‘I,
a
a-
-
1,800
1,600
1,400
1,200
11000
, 800
600
0
200
0
2 4 6
Yeast Nucleic Acid (g/man/day)
S
TABLE IV
Protein, RNA, and Uric Acid
895
period. Plotted in this way, the relation-
ship between dietary RNA and urinary uric
acid is linear, which suggests that excre-
tion must have been at least near the max-
imum at the end of the 5-day treatmer
periods. In four of 2the men, urinary uric
acid increased linearly (r = 1.000), by 147
mg/g of yeast RNA (Fig. 2); in the aber-
rant subject, this value was markedly de-
creased at the two higher RNA levels.
Plasma uric acid concentrations in-
creased with each increase of dietary RNA
(r = 0.996). Again, four men responded
similarly and a fifth was different, but
not the same subject as differed in uri-
nary. output. The regression of plasma
uric acid with RNA was 0.65 mg/ 100 ml
Fmc. 2. Change in urinary uric acid with supple-
mental yeast nucleic acid. 0 = Subject 1001; o =
Subject 1002; #{149}= Subject 1003; x = Subject
1001; = Subject 1005.
3
2 4 6 8
Yeast Nucleic Acid (g/man/day)
Fz;. 3. Change in plasma uric acid with supple-
mental yeast nucleic acid. o = Subject 1001; 0 =
Subject 1002; #{149}= Subject 1003; x = Subject
1001; = Subject 1005.
per gram in the uniform set (Table III
and Fig. 3). In the fifth man the slope
was much lower.
DISCUSSION
If one groups data from other studies
invoving low ptmrine (but not absolutely
purine-free) diets (Table iv) containing
0-7.5 g of protein, a trend toward increased
urinary uric acid excretion is clear in
spite of the broad range and overlapping
of values. -
The lower plasma uric acid and higher
urinary uric acid with a normal protein
allowance (75 g), compared with a pro-
tein-free diet, have been ascribed by earlier
workers to increased renal clearance (14).
The elevation of urinary uric acid might
also reflect increased endogenous syn-
Published uric acid excretion of men fed low purine diets
Protein ingested, g 0-24 25-43
44-62 63-75
Average urinary
uric acid, mg 218
364 428
436
Range 120-430 282-475 291-680 277-750
Number of observations
7
11
5
8
References 9, 10, 14 8, 10, 12, 13 8, 11, 12 9-11, 14
896
Waslien et a!.
thesis, which others have shown to occur
at higher levels of dietary protein (7).
The plasma uric acid concentration of
all subjects fed the control diet alone or
with 2 g of yeast RNA fell within the
accepted! range of normal values. However,
after the 4-g dosage of RNA, three, and
possibly four, of the men attained ab-
normally high levels. The rise in plasma
uric acid reported here (2.8 mg/ 100 ml)
is almost identical to the elevation due to
4 g of yeast RNA reported by Nugent and
Tyler (5). Four of our men had greatly
elevated! plasma values after the 8-g dosage.
The plasma level of the fifth man was only
approaching the abnormal range, even
at this highest dosage of RNA; this sub-
ject did not differ in any obvious way
from the other subjects.
Urinary uric acid excretion of our sub-
jects fed the control diet is within the
range of values for men receiving low
purine diets (16). Excretion with 2 g of
RNA in the diet is similar to that re-
ported for subjects given diets with mod-
erate amounts of meat and vegetables. Most
studies indicate production of 0.5-0.75 mg
of urinary uric acid per milligram of purine
added to the diet in the form of foods
(1, 3). Based on published compositional
data of yeast nucleic acid (17), our four uni-
form subjects appear to have excreted
0.62, 0.61, and 0.59 mg uric acid per milli-
gram yeast purine with the 2-, 4-, and 8-g
dosages of RNA, respectively. The subjects
of Nugent and Tyler (5) excreted 0.45 and
0.14 mg uric acid per milligram yeast
purine at the 4- and 7-g dosages, respec-
tively. Their value for the 7-g dosage is
based only on one urine collection from
one subject and is similar to the 0.22 mg
uric acid/mg ingested! purine shown by
the one deviant subject in our study. We
did note one difference between this sub-
ject and our other men and that was the
regular presence of a substantial amount
of methane in his breath. This could indi-
cate different bacterial activity in his in-
testinal tract (18), offering an alternate
means of uric acid removal.
For practical purposes of supplementa-
tion to diets containing inadequate amounts
of protein, the nucleic acid contribution
of microorganisms should not constitute
a serious bar to their use. Yeast and bac-
teria vary in composition depending upon
conditions of growth, but both contain
about 1 g of nucleic acid per 10 g of pro-
tein. It is not likely that the remainder of
a low protein diet would be rich in purines,
since most foods high in one are high in
the other. Therefore, with low protein
diets, a daily supplement of 10-20 g of
microbial protein could be used to ad-
vantage and without undue hazard. How-
ever, addition of crude microorganisms to
typical American diets, containing larger
amounts of muscle and organ meats, should
be approached with caution.
SUMMARY
Healthy male subjects were fed purine-
free basal diets containing 0-75 g of pro-
tein and, at the highest protein level, 0-8 g
of added yeast ribonucleic acid in order to
differentiate effects of these dietary com-
ponents on plasma and urinary uric acid
production. Urinary uric acid levels were
significantly higher and plasma levels lower
with 75 g of protein than with a protein-
free diet. When nucleic acid was fed, plasma
and urinary uric acid increased linearly
in four of five subjects. Predictive equa-
tions were derived describing this response
to dietary nucleic acid.
We wish to thank Mrs. Melinda Buchanan for
performing urinary uric acid determinations and
Dr. Amy Odell for her cooperation in the conduct
of the experiment.
REFERENCES
1. DENIS, W. The effect of ingested purines on the
uric acid content of the blood. J. Biol. Chem.
23: 147, 1915.
2. MENDEL, L. B., AND E. W. BROWN. The rate of
elimination of uric acid in man. I. Am. Med.
Assoc. 49: 896, 1907.
Protein, RNA, and Uric Acid
897
3. BROCHNER-MORTEN5EN, K. Variations in uric acid
clearance after administration of purine, with
special reference to the threshold problem. Acta
Med. Scand. 99: 525, 1939.
4. ANDERSON, A. K. Blood analyses. Penn. State
Univ. Agr. Expt. Sta. Bull. 367: 7, 1938.
5. NUGENT, C. A., AND F. H. TYLER. The renal ex-
cretion of uric acid in patients with gout and
nongouty subjects. J. Clin. Invest. 39: 1890, 1959.
6. NUGENT, C. A. Renal urate excretion in gout
studied by feeding ribonucleic acid. A rthritis
R/teurnat. 8: 671, 1965.
7. BIEN, E. J., T. F. Yu, J. D. BENEDICT, A. B. GUT-
MAN AND D. STETTEN. The relation of dietary
nitrogen consumption to the rate of uric acid
synthesis in normal and gouty man. J. Clin.
Invest. 32: 778, 1953.
8. LEWIs, H. B., AND E. A. Domsy. Studies in uric
acid metabolism. I. The influence of high pro-
tein diets on the endogenous uric acid elimina-
tion. I. Biol. C/tern. 36: 1, 1918.
9. POKA, L., M. N. CSOKA, G. CZIRBUSZ, E. FOLD!
AND A. TOROK. The effect of parenteral feeding on
postoperative protein metabolism. Nutr. Dieta
9: 161, 1967.
10. RosE, \V. C., J. S. DIMMITF AND H. L. BARTLETF.
The influence of food ingestion upon endoge-
nous purine metabolism. II. J. Biol. C/tern. 48:
575, 1921.
11. Hosr, H. F. A study of the physiology of en-
dogenous uric acid. J. Biol. C/tern. 38: 17. 1918.
12. RAiziss, G. \V., H. DUBIN AND A. I. RINGER.
Studies in endogenous uric acid metabolism. 1.
Biol. C/tern. 19: 473, 1914.
13. TAYLOR, A. E., AND W. C. ROSE. Influence of
protein intake upon the formation of uric acid.
J. Biol. C/tern. 18: 519, 1914.
14. LEOPOLD, J. S., A. BERNHARD AND H. G. JACOBI.
Uric acid metabolism of children. Am. J. Dis-
eases C/!ildren 29: 191, 1925.
15. KALCKAR, H. M. Differential spectrophotometry
of purine compounds by means of specific en-
zymes. I. Biol. C/tern. 167: 429, 1947.
16. CRONE, C., AND U. V. LASSEN. Uric acid values
in normal human subjects. Scand. I. Clin. Lab.
Invest. 8: 51, 1956.
17. DIRR, K., AND P. DECKER. Value of cultivated
yeast in human diet. 5. True protein content of
yeast. Bioc/zern. Z. 316: 245, 1944.
18. CALLOWAY, D. H., D. J. COLASITO AND R. D.
MATHEWS. Gases produced by human intestinal
mnicroflora. Nature 212: 1238, 1966.