Tài liệu hồi quy đa biến
Bạn đang xem bản rút gọn của tài liệu. Xem và tải ngay bản đầy đủ của tài liệu tại đây (484.85 KB, 42 trang )
1
1
Slide
Slide
©
©
2005 Thomson/South
2005 Thomson/South
-
-
Western
Western
Multiple Regression
Multiple Regression
n
n
Multiple regression introduction
Multiple regression introduction
n
n
Multiple Regression Model
Multiple Regression Model
n
n
Least Squares Method
Least Squares Method
n
n
Multiple Coefficient of Determination
Multiple Coefficient of Determination
n
n
Model Assumptions
Model Assumptions
n
n
Testing for Significance
Testing for Significance
n
n
Using the Estimated Regression Equation
Using the Estimated Regression Equation
for Estimation and Prediction
for Estimation and Prediction
2
2
Slide
Slide
©
©
2005 Thomson/South
2005 Thomson/South
-
-
Western
Western
H
H
ô
ô
̀
̀
i
i
quy
quy
đa
đa
bi
bi
ê
ê
́
́
n
n
T
T
í
í
nh
nh
th
th
í
í
ch
ch
h
h
ợ
ợ
p
p
c
c
ủ
ủ
a
a
h
h
ồ
ồ
i
i
quy
quy
đa
đa
bi
bi
ế
ế
n
n
đ
đ
ố
ố
i
i
v
v
ớ
ớ
i
i
c
c
á
á
c
c
nghiên
nghiên
c
c
ứ
ứ
u
u
:
:
H
H
ồ
ồ
i
i
quy
quy
đa
đa
bi
bi
ế
ế
n
n
l
l
à
à
m
m
ộ
ộ
t
t
k
k
ỹ
ỹ
thu
thu
ậ
ậ
t
t
th
th
ố
ố
ng
ng
kê
kê
đư
đư
ợ
ợ
c
c
d
d
ù
ù
ng
ng
đ
đ
ể
ể
phân
phân
t
t
í
í
ch
ch
quan
quan
h
h
ệ
ệ
gi
gi
ữ
ữ
a
a
m
m
ộ
ộ
t
t
bi
bi
ế
ế
n
n
đ
đ
ộ
ộ
c
c
l
l
ậ
ậ
p
p
v
v
à
à
nhi
nhi
ề
ề
u
u
bi
bi
ế
ế
n
n
ph
ph
ụ
ụ
thu
thu
ộ
ộ
c
c
(
(
bi
bi
ế
ế
n
n
d
d
ự
ự
b
b
á
á
o
o
)
)
M
M
ụ
ụ
c
c
tiêu
tiêu
c
c
ủ
ủ
a
a
h
h
ồ
ồ
i
i
quy
quy
đa
đa
bi
bi
ế
ế
n
n
l
l
à
à
s
s
ử
ử
d
d
ụ
ụ
ng
ng
c
c
á
á
c
c
bi
bi
ế
ế
n
n
đ
đ
ộ
ộ
c
c
l
l
ậ
ậ
p
p
v
v
ớ
ớ
i
i
gi
gi
á
á
tr
tr
ị
ị
đã
đã
bi
bi
ế
ế
t
t
đ
đ
ể
ể
tiên
tiên
đo
đo
á
á
n
n
gi
gi
á
á
tr
tr
ị
ị
c
c
ủ
ủ
a
a
bi
bi
ế
ế
n
n
ph
ph
ụ
ụ
thu
thu
ộ
ộ
c
c
3
3
Slide
Slide
©
©
2005 Thomson/South
2005 Thomson/South
-
-
Western
Western
H
H
ô
ô
̀
̀
i
i
quy
quy
đa
đa
bi
bi
ê
ê
́
́
n
n
H
H
ồ
ồ
i
i
quy
quy
tuy
tuy
ế
ế
n
n
t
t
í
í
nh
nh
th
th
í
í
ch
ch
h
h
ợ
ợ
p
p
v
v
ớ
ớ
i
i
:
:
•
•
2
2
lo
lo
ạ
ạ
i
i
v
v
ấ
ấ
n
n
đ
đ
ề
ề
nghiên
nghiên
c
c
ứ
ứ
u
u
:
:
•
•
D
D
ự
ự
đo
đo
á
á
n
n
(Prediction)
(Prediction)
–Dựđoánsựbiếnthiêncủabiếnphụ thuộcvàocácbiến
độclập
–So sánhcácmôhìnhcạnhtranhvớinhau
•
•
Gi
Gi
ả
ả
i
i
th
th
í
í
ch
ch
(Explanation)
(Explanation)
–Khảosáthệsốhồiquycủatừngbiến độclập(dấu, độ lớn
–Trị trungbình, mứcý nghĩavềmặtthốngkê) vàobiến
phụ thuộc
–Giảithíchvề mặtlýthuyếtsựphụ thuộctuyếntínhvà độ
lớncủacáchệsốhồiquynày
•
•
X
X
á
á
c
c
đ
đ
ị
ị
nh
nh
quan
quan
h
h
ệ
ệ
th
th
ố
ố
ng
ng
kê
kê
gi
gi
ữ
ữ
a
a
c
c
á
á
c
c
bi
bi
ế
ế
n
n
đ
đ
ộ
ộ
c
c
l
l
ậ
ậ
p
p
&
&
bi
bi
ế
ế
n
n
ph
ph
ụ
ụ
thu
thu
ộ
ộ
c
c
4
4
Slide
Slide
©
©
2005 Thomson/South
2005 Thomson/South
-
-
Western
Western
H
H
ô
ô
̀
̀
i
i
quy
quy
đa
đa
bi
bi
ê
ê
́
́
n
n
L
L
ự
ự
a
a
ch
ch
ọ
ọ
n
n
bi
bi
ế
ế
n
n
đ
đ
ộ
ộ
c
c
l
l
ậ
ậ
p
p
v
v
à
à
bi
bi
ế
ế
n
n
ph
ph
ụ
ụ
thu
thu
ộ
ộ
c
c
:
:
•
•
D
D
ự
ự
a
a
v
v
à
à
o
o
lý
lý
thuy
thuy
ế
ế
t
t
hay
hay
c
c
á
á
c
c
khung
khung
nguyên
nguyên
t
t
ắ
ắ
c
c
(conceptual framework)
(conceptual framework)
đã
đã
c
c
ó
ó
•
•
Không
Không
nên
nên
ch
ch
ọ
ọ
n
n
c
c
á
á
c
c
bi
bi
ế
ế
n
n
m
m
ộ
ộ
t
t
c
c
á
á
ch
ch
ng
ng
ẫ
ẫ
u
u
nhiên
nhiên
hay
hay
d
d
ự
ự
a
a
trên
trên
d
d
ữ
ữ
li
li
ệ
ệ
u
u
th
th
ự
ự
c
c
t
t
ế
ế
đang
đang
c
c
ó
ó
.
.
•
•
Bi
Bi
ế
ế
n
n
ph
ph
ụ
ụ
thu
thu
ộ
ộ
c
c
ph
ph
ả
ả
i
i
c
c
ó
ó
th
th
ể
ể
đư
đư
ợ
ợ
c
c
đo
đo
v
v
ớ
ớ
i
i
sai
sai
s
s
ố
ố
nh
nh
ỏ
ỏ
v
v
à
à
ki
ki
ể
ể
m
m
so
so
á
á
t
t
đư
đư
ợ
ợ
c
c
•
•
Tr
Tr
á
á
nh
nh
b
b
ỏ
ỏ
s
s
ó
ó
t
t
bi
bi
ế
ế
n
n
quan
quan
tr
tr
ọ
ọ
ng
ng
hay
hay
bao
bao
g
g
ồ
ồ
m
m
bi
bi
ế
ế
n
n
không
không
quan
quan
tr
tr
ọ
ọ
ng
ng
5
5
Slide
Slide
©
©
2005 Thomson/South
2005 Thomson/South
-
-
Western
Western
H
H
ô
ô
̀
̀
i
i
quy
quy
đa
đa
bi
bi
ê
ê
́
́
n
n
6
6
Slide
Slide
©
©
2005 Thomson/South
2005 Thomson/South
-
-
Western
Western
H
H
ô
ô
̀
̀
i
i
quy
quy
đa
đa
bi
bi
ê
ê
́
́
n
n
K
K
í
í
ch
ch
thư
thư
ớ
ớ
c
c
m
m
ẫ
ẫ
u:
u:
H
H
ồ
ồ
i
i
quy
quy
đơn
đơn
gi
gi
ả
ả
n
n
: 20
: 20
H
H
ồ
ồ
i
i
quy
quy
đa
đa
bi
bi
ế
ế
n
n
: 50
: 50
–
–
100
100
Quy
Quy
t
t
ắ
ắ
c
c
th
th
ự
ự
c
c
h
h
à
à
nh
nh
:
:
T
T
ỷ
ỷ
l
l
ệ
ệ
s
s
ố
ố
kh
kh
ả
ả
o
o
s
s
á
á
t/s
t/s
ố
ố
bi
bi
ế
ế
n
n
= 5:
= 5:
1
1
Đ
Đ
ể
ể
ki
ki
ể
ể
m tra s
m tra s
ự
ự
ph
ph
ù
ù
h
h
ợ
ợ
p t
p t
ổ
ổ
ng qu
ng qu
á
á
t c
t c
ủ
ủ
a mô h
a mô h
ì
ì
nh:
nh:
K
K
í
í
ch thư
ch thư
ớ
ớ
c m
c m
ẫ
ẫ
u: 50 + 8k (k s
u: 50 + 8k (k s
ố
ố
bi
bi
ế
ế
n đ
n đ
ộ
ộ
c l
c l
ậ
ậ
p)
p)
Đ
Đ
ể
ể
ki
ki
ể
ể
m tra
m tra
ả
ả
nh hư
nh hư
ở
ở
ng c
ng c
ủ
ủ
a t
a t
ừ
ừ
ng bi
ng bi
ế
ế
n đ
n đ
ộ
ộ
c l
c l
ậ
ậ
p:
p:
K
K
í
í
ch thư
ch thư
ớ
ớ
c m
c m
ẫ
ẫ
u: 104 + k
u: 104 + k
Green (1991)
Green (1991)
7
7
Slide
Slide
©
©
2005 Thomson/South
2005 Thomson/South
-
-
Western
Western
The equation that describes how the dependent
The equation that describes how the dependent
variable
variable
y
y
is related to the independent variables
is related to the independent variables
x
x
1
1
,
,
x
x
2
2
, . . .
, . . .
x
x
p
p
and an error term is called the
and an error term is called the
multiple
multiple
regression model
regression model
.
.
Multiple Regression Model
Multiple Regression Model
y
y
=
=
β
β
0
0
+
+
β
β
1
1
x
x
1
1
+
+
β
β
2
2
x
x
2
2
+
+
. . . +
. . . +
β
β
p
p
x
x
p
p
+
+
ε
ε
where:
where:
β
β
0
0
,
,
β
β
1
1
,
,
β
β
2
2
, . . . ,
, . . . ,
β
β
p
p
are the
are the
parameters
parameters
, and
, and
ε
ε
is a random variable called the
is a random variable called the
error term
error term
8
8
Slide
Slide
©
©
2005 Thomson/South
2005 Thomson/South
-
-
Western
Western
The equation that describes how the mean value
The equation that describes how the mean value
of
of
y
y
is related to
is related to
x
x
1
1
,
,
x
x
2
2
, . . .
, . . .
x
x
p
p
is called the
is called the
multiple
multiple
regression equation
regression equation
.
.
Multiple Regression Equation
Multiple Regression Equation
E
E
(
(
y
y
) =
) =
β
β
0
0
+
+
β
β
1
1
x
x
1
1
+
+
β
β
2
2
x
x
2
2
+ . . . +
+ . . . +
β
β
p
p
x
x
p
p
9
9
Slide
Slide
©
©
2005 Thomson/South
2005 Thomson/South
-
-
Western
Western
A simple random sample is used to compute
A simple random sample is used to compute
sample statistics
sample statistics
b
b
0
0
,
,
b
b
1
1
,
,
b
b
2
2
,
,
. . . ,
. . . ,
b
b
p
p
that are used as the
that are used as the
point estimators of the parameters
point estimators of the parameters
β
β
0
0
,
,
β
β
1
1
,
,
β
β
2
2
, . . . ,
, . . . ,
β
β
p
p
.
.
Estimated Multiple Regression Equation
Estimated Multiple Regression Equation
^
^
y
y
=
=
b
b
0
0
+
+
b
b
1
1
x
x
1
1
+
+
b
b
2
2
x
x
2
2
+ . . . +
+ . . . +
b
b
p
p
x
x
p
p
The
The
estimated multiple regression equation
estimated multiple regression equation
is:
is:
10
10
Slide
Slide
©
©
2005 Thomson/South
2005 Thomson/South
-
-
Western
Western
Estimation Process
Estimation Process
Multiple Regression Model
Multiple Regression Model
E
E
(
(
y
y
) =
) =
β
β
0
0
+
+
β
β
1
1
x
x
1
1
+
+
β
β
2
2
x
x
2
2
+. . .+
+. . .+
β
β
p
p
x
x
p
p
+
+
ε
ε
Multiple Regression Equation
Multiple Regression Equation
E
E
(
(
y
y
) =
) =
β
β
0
0
+
+
β
β
1
1
x
x
1
1
+
+
β
β
2
2
x
x
2
2
+. . .+
+. . .+
β
β
p
p
x
x
p
p
Unknown parameters are
Unknown parameters are
β
β
0
0
,
,
β
β
1
1
,
,
β
β
2
2
, . . . ,
, . . . ,
β
β
p
p
Sample Data:
Sample Data:
x
x
1
1
x
x
2
2
. . .
. . .
x
x
p
p
y
y
. . . .
. . . .
. . . .
. . . .
01122
ˆ
pp
ybbxbxbx
=++++
01122
ˆ
pp
ybbxbxbx
=++++
Estimated Multiple
Estimated Multiple
Regression Equation
Regression Equation
Sample statistics are
Sample statistics are
b
b
0
0
,
,
b
b
1
1
,
,
b
b
2
2
,
,
. . . ,
. . . ,
b
b
p
p
b
b
0
0
,
,
b
b
1
1
,
,
b
b
2
2
,
,
. . . ,
. . . ,
b
b
p
p
provide estimates of
provide estimates of
β
β
0
0
,
,
β
β
1
1
,
,
β
β
2
2
, . . . ,
, . . . ,
β
β
p
p
11
11
Slide
Slide
©
©
2005 Thomson/South
2005 Thomson/South
-
-
Western
Western
L
L
ự
ự
a
a
cho
cho
̣
̣
n
n
bi
bi
ê
ê
́
́
n
n
đ
đ
ô
ô
̣
̣
c
c
l
l
â
â
̣
̣
p
p
n
n
Phương
Phương
pha
pha
́
́
p
p
hierarichal
hierarichal
entry
entry
•
•
D
D
ự
ự
a
a
trên
trên
ca
ca
́
́
c
c
nghiên
nghiên
c
c
ứ
ứ
u
u
tr
tr
ướ
ướ
c
c
hay
hay
kinh
kinh
nghi
nghi
ê
ê
̣
̣
m
m
cu
cu
̉
̉
a
a
ng
ng
ườ
ườ
i
i
nghiên
nghiên
c
c
ứ
ứ
u
u
đê
đê
̉
̉
cho
cho
̣
̣
n
n
bi
bi
ê
ê
́
́
n
n
đưa
đưa
va
va
̀
̀
o
o
•
•
Ca
Ca
́
́
c
c
bi
bi
ê
ê
́
́
n
n
sô
sô
́
́
đa
đa
̃
̃
bi
bi
ê
ê
́
́
t
t
đ
đ
ượ
ượ
c
c
đưa
đưa
va
va
̀
̀
o
o
mô
mô
hi
hi
̀
̀
nh
nh
theo
theo
thư
thư
́
́
tư
tư
̣
̣
t
t
â
â
̀
̀
m
m
quan
quan
tro
tro
̣
̣
ng
ng
trong
trong
vi
vi
ê
ê
̣
̣
c
c
dư
dư
̣
̣
ba
ba
́
́
o
o
bi
bi
ê
ê
́
́
n
n
phu
phu
̣
̣
thu
thu
ô
ô
̣
̣
c
c
12
12
Slide
Slide
©
©
2005 Thomson/South
2005 Thomson/South
-
-
Western
Western
L
L
ự
ự
a
a
cho
cho
̣
̣
n
n
bi
bi
ê
ê
́
́
n
n
đ
đ
ô
ô
̣
̣
c
c
l
l
â
â
̣
̣
p
p
n
n
Phương
Phương
pha
pha
́
́
p
p
hierarichal
hierarichal
entry
entry
•
•
Ca
Ca
́
́
c
c
bi
bi
ê
ê
́
́
n
n
co
co
́
́
thê
thê
̉
̉
đ
đ
ượ
ượ
c
c
đưa
đưa
va
va
̀
̀
o
o
mô
mô
hi
hi
̀
̀
nh
nh
theo
theo
m
m
ô
ô
̣
̣
t
t
trong
trong
ca
ca
́
́
c
c
ca
ca
́
́
ch
ch
sau
sau
:
:
•
•
Đưa
Đưa
h
h
ê
ê
́
́
t
t
va
va
̀
̀
o
o
m
m
ô
ô
̣
̣
t
t
l
l
â
â
̀
̀
n
n
(Enter
(Enter
-
-
SPSS )
SPSS )
•
•
B
B
ă
ă
́
́
t
t
đ
đ
â
â
̀
̀
u
u
tư
tư
̀
̀
mô
mô
hi
hi
̀
̀
nh
nh
chi
chi
̉
̉
co
co
́
́
hê
hê
̣
̣
sô
sô
́
́
g
g
ô
ô
́
́
c
c
va
va
̀
̀
thêm
thêm
t
t
ừ
ừ
ng
ng
bi
bi
ê
ê
́
́
n
n
va
va
̀
̀
o
o
.
.
M
M
ô
ô
̃
̃
i
i
l
l
â
â
̀
̀
n
n
thêm
thêm
se
se
̃
̃
ki
ki
ê
ê
̉
̉
m
m
tra
tra
m
m
ứ
ứ
c
c
đô
đô
̣
̣
gia
gia
̉
̉
i
i
thi
thi
́
́
ch
ch
cu
cu
̉
̉
a
a
mô
mô
hi
hi
̀
̀
nh
nh
đê
đê
̉
̉
cho
cho
̣
̣
n
n
bi
bi
ê
ê
́
́
n
n
co
co
́
́
m
m
ứ
ứ
c
c
gia
gia
̉
̉
i
i
thi
thi
́
́
ch
ch
cao
cao
nh
nh
â
â
́
́
t
t
đưa
đưa
va
va
̀
̀
o
o
tr
tr
ướ
ướ
c
c
(Forward)
(Forward)
•
•
Đưa
Đưa
va
va
̀
̀
o
o
m
m
ô
ô
̃
̃
i
i
l
l
â
â
̀
̀
n
n
m
m
ô
ô
̣
̣
t
t
bi
bi
ê
ê
́
́
n
n
va
va
̀
̀
ki
ki
ê
ê
̉
̉
m
m
tra
tra
la
la
̣
̣
i
i
t
t
â
â
́
́
t
t
ca
ca
̉
̉
ca
ca
́
́
c
c
bi
bi
ê
ê
́
́
n
n
va
va
̀
̀
loa
loa
̣
̣
i
i
bi
bi
ê
ê
́
́
n
n
i
i
́
́
t
t
h
h
ữ
ữ
u
u
du
du
̣
̣
ng
ng
nh
nh
â
â
́
́
t
t
(Stepwise
(Stepwise
–
–
SPSS)
SPSS)
•
•
Đưa
Đưa
va
va
̀
̀
o
o
h
h
ê
ê
́
́
t
t
m
m
ô
ô
̣
̣
t
t
l
l
â
â
̀
̀
n
n
va
va
̀
̀
loa
loa
̣
̣
i
i
t
t
ừ
ừ
ng
ng
bi
bi
ê
ê
́
́
n
n
m
m
ô
ô
̣
̣
t
t
d
d
ự
ự
a
a
va
va
̀
̀
o
o
t test
t test
(Backward)
(Backward)
à
à
Backward
Backward
du
du
̀
̀
ng
ng
phô
phô
̉
̉
bi
bi
ê
ê
́
́
n
n
va
va
̀
̀
cho
cho
k
k
ê
ê
́
́
t
t
qua
qua
̉
̉
t
t
ô
ô
́
́
t
t
h
h
ơn
ơn
Forward
Forward
13
13
Slide
Slide
©
©
2005 Thomson/South
2005 Thomson/South
-
-
Western
Western
Least Squares Method
Least Squares Method
n
n
Least Squares Criterion
Least Squares Criterion
2
ˆ
min()
ii
yy
−
∑
2
ˆ
min()
ii
yy
−
∑
n
n
Computation of Coefficient Values
Computation of Coefficient Values
The formulas for the regression coefficients
The formulas for the regression coefficients
b
b
0
0
,
,
b
b
1
1
,
,
b
b
2
2
, . . .
, . . .
b
b
p
p
involve the use of matrix algebra.
involve the use of matrix algebra.
We will rely on computer software packages to
We will rely on computer software packages to
perform the calculations.
perform the calculations.
14
14
Slide
Slide
©
©
2005 Thomson/South
2005 Thomson/South
-
-
Western
Western
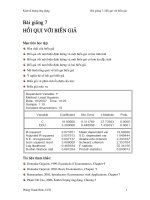
The years of experience, score on the aptitude
The years of experience, score on the aptitude
test, and corresponding annual salary ($1000s) for a
test, and corresponding annual salary ($1000s) for a
sample of 20 programmers is shown on the next
sample of 20 programmers is shown on the next
slide.
slide.
n
n
Example: Programmer Salary Survey
Example: Programmer Salary Survey
Multiple Regression Model
Multiple Regression Model
A software firm collected data for a sample
A software firm collected data for a sample
of 20 computer programmers. A suggestion
of 20 computer programmers. A suggestion
was made that regression analysis could
was made that regression analysis could
be used to determine if salary was related
be used to determine if salary was related
to the years of experience and the score
to the years of experience and the score
on the firm
on the firm
’
’
s programmer aptitude test.
s programmer aptitude test.
15
15
Slide
Slide
©
©
2005 Thomson/South
2005 Thomson/South
-
-
Western
Western
4
4
7
7
1
1
5
5
8
8
10
10
0
0
1
1
6
6
6
6
9
9
2
2
10
10
5
5
6
6
8
8
4
4
6
6
3
3
3
3
78
78
100
100
86
86
82
82
86
86
84
84
75
75
80
80
83
83
91
91
88
88
73
73
75
75
81
81
74
74
87
87
79
79
94
94
70
70
89
89
24
24
43
43
23.7
23.7
34.3
34.3
35.8
35.8
38
38
22.2
22.2
23.1
23.1
30
30
33
33
38
38
26.6
26.6
36.2
36.2
31.6
31.6
29
29
34
34
30.1
30.1
33.9
33.9
28.2
28.2
30
30
Exper
Exper
.
.
Score
Score
Score
Score
Exper
Exper
.
.
Salary
Salary
Salary
Salary
Multiple Regression Model
Multiple Regression Model
16
16
Slide
Slide
©
©
2005 Thomson/South
2005 Thomson/South
-
-
Western
Western
Suppose we believe that salary (
Suppose we believe that salary (
y
y
) is
) is
related to the years of experience (
related to the years of experience (
x
x
1
1
) and the score on
) and the score on
the programmer aptitude test (
the programmer aptitude test (
x
x
2
2
) by the following
) by the following
regression model:
regression model:
Multiple Regression Model
Multiple Regression Model
where
where
y
y
= annual salary ($1000)
= annual salary ($1000)
x
x
1
1
= years of experience
= years of experience
x
x
2
2
= score on programmer aptitude test
= score on programmer aptitude test
y
y
=
=
β
β
0
0
+
+
β
β
1
1
x
x
1
1
+
+
β
β
2
2
x
x
2
2
+
+
ε
ε
17
17
Slide
Slide
©
©
2005 Thomson/South
2005 Thomson/South
-
-
Western
Western
Solving for the Estimates of
Solving for the Estimates of
β
β
0
0
,
,
β
β
1
1
,
,
β
β
2
2
Input Data
Input Data
Least Squares
Least Squares
Output
Output
x
x
1
1
x
x
2
2
y
y
4 78 24
4 78 24
7 100 43
7 100 43
. . .
. . .
. . .
. . .
3 89 30
3 89 30
Computer
Computer
Package
Package
for Solving
for Solving
Multiple
Multiple
Regression
Regression
Problems
Problems
b
b
0
0
=
=
b
b
1
1
=
=
b
b
2
2
=
=
R
R
2
2
=
=
etc.
etc.
18
18
Slide
Slide
©
©
2005 Thomson/South
2005 Thomson/South
-
-
Western
Western
n
n
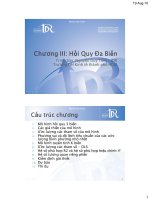
Excel Worksheet (showing partial data entered)
Excel Worksheet (showing partial data entered)
A B C D
1 ProgrammerExperience (yrs) Test Score Salary ($K)
2
1 4 78 24.0
3
2 7 100 43.0
4
3 1 86 23.7
5
4 5 82 34.3
6
5 8 86 35.8
7
6 10 84 38.0
8
7 0 75 22.2
9
8 1 80 23.1
Note: Rows 10
Note: Rows 10
-
-
21 are not shown.
21 are not shown.
Solving for the Estimates of
Solving for the Estimates of
β
β
0
0
,
,
β
β
1
1
,
,
β
β
2
2
19
19
Slide
Slide
©
©
2005 Thomson/South
2005 Thomson/South
-
-
Western
Western
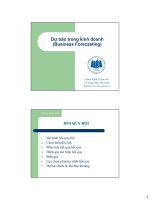
n
n
Excel
Excel
’
’
s Regression Dialog Box
s Regression Dialog Box
Solving for the Estimates of
Solving for the Estimates of
β
β
0
0
,
,
β
β
1
1
,
,
β
β
2
2
20
20
Slide
Slide
©
©
2005 Thomson/South
2005 Thomson/South
-
-
Western
Western
n
n
Excel
Excel
’
’
s Regression Equation Output
s Regression Equation Output
A B C D E
38
39
Coeffic.Std. Err. t Stat P-value
40
Intercept 3.173946.15607 0.51560.61279
41
Experience 1.40390.19857 7.07021.9E-06
42
Test Score 0.250890.07735 3.24330.00478
43
Note: Columns F
Note: Columns F
-
-
I are not shown.
I are not shown.
Solving for the Estimates of
Solving for the Estimates of
β
β
0
0
,
,
β
β
1
1
,
,
β
β
2
2
21
21
Slide
Slide
©
©
2005 Thomson/South
2005 Thomson/South
-
-
Western
Western
Estimated Regression Equation
Estimated Regression Equation
SALARY = 3.174 + 1.404(EXPER) + 0.251(SCORE)
SALARY = 3.174 + 1.404(EXPER) + 0.251(SCORE)
SALARY = 3.174 + 1.404(EXPER) + 0.251(SCORE)
Note: Predicted salary will be in thousands of dollars.
Note: Predicted salary will be in thousands of dollars.
22
22
Slide
Slide
©
©
2005 Thomson/South
2005 Thomson/South
-
-
Western
Western
H
H
ô
ô
̀
̀
i
i
quy
quy
đa
đa
bi
bi
ê
ê
́
́
n
n
Y
Y
́
́
nghi
nghi
̃
̃
a
a
cu
cu
̉
̉
a
a
ca
ca
́
́
c
c
hê
hê
̣
̣
sô
sô
́
́
h
h
ô
ô
̀
̀
i
i
quy
quy
•
•
Thê
Thê
̉
̉
hi
hi
ê
ê
̣
̣
n
n
đô
đô
̣
̣
ma
ma
̣
̣
nh
nh
,
,
chi
chi
ê
ê
̀
̀
u
u
h
h
ướ
ướ
ng
ng
cu
cu
̉
̉
a
a
a
a
̉
̉
nh
nh
h
h
ưở
ưở
ng
ng
cu
cu
̉
̉
a
a
t
t
ừ
ừ
ng
ng
bi
bi
ê
ê
́
́
n
n
đ
đ
ô
ô
̣
̣
c
c
l
l
â
â
̣
̣
p
p
đê
đê
́
́
n
n
bi
bi
ê
ê
́
́
n
n
phu
phu
̣
̣
thu
thu
ô
ô
̣
̣
c
c
•
•
Thê
Thê
̉
̉
hi
hi
ê
ê
̣
̣
n
n
m
m
ứ
ứ
c
c
đô
đô
̣
̣
tăng
tăng
cu
cu
̉
̉
a
a
bi
bi
ê
ê
́
́
n
n
phu
phu
̣
̣
thu
thu
ô
ô
̣
̣
c
c
khi
khi
bi
bi
ê
ê
́
́
n
n
đ
đ
ô
ô
̣
̣
c
c
l
l
â
â
̣
̣
p
p
nh
nh
â
â
̣
̣
n
n
gia
gia
́
́
tri
tri
̣
̣
b
b
ă
ă
̀
̀
ng
ng
1 hay
1 hay
tăng
tăng
lên
lên
1
1
đơn
đơn
vi
vi
̣
̣
va
va
̀
̀
ca
ca
́
́
c
c
bi
bi
ê
ê
́
́
n
n
kha
kha
́
́
c
c
không
không
thay
thay
đ
đ
ô
ô
̉
̉
i
i
gia
gia
́
́
tri
tri
̣
̣
Y
Y
́
́
nghi
nghi
̃
̃
a
a
cu
cu
̉
̉
a
a
hê
hê
̣
̣
sô
sô
́
́
tung
tung
đô
đô
̣
̣
g
g
ô
ô
́
́
c
c
:
:
Gia
Gia
́
́
tri
tri
̣
̣
cu
cu
̉
̉
a
a
tung
tung
đô
đô
̣
̣
g
g
ô
ô
́
́
c
c
chi
chi
̉
̉
đ
đ
u
u
́
́
ng
ng
v
v
ớ
ớ
i
i
ca
ca
́
́
c
c
gia
gia
́
́
tri
tri
̣
̣
tương
tương
ứ
ứ
ng
ng
cu
cu
̉
̉
a
a
bi
bi
ê
ê
́
́
n
n
đ
đ
ô
ô
̣
̣
c
c
l
l
â
â
̣
̣
p
p
Thê
Thê
̉
̉
hi
hi
ê
ê
̣
̣
n
n
gia
gia
́
́
tri
tri
̣
̣
cu
cu
̉
̉
a
a
bi
bi
ê
ê
́
́
n
n
phu
phu
̣
̣
thu
thu
ô
ô
̣
̣
c
c
khi
khi
ca
ca
́
́
c
c
bi
bi
ê
ê
́
́
n
n
đ
đ
ô
ô
̣
̣
c
c
l
l
â
â
̣
̣
p
p
nh
nh
â
â
̣
̣
n
n
gia
gia
́
́
tri
tri
̣
̣
b
b
ă
ă
̀
̀
ng
ng
0
0
23
23
Slide
Slide
©
©
2005 Thomson/South
2005 Thomson/South
-
-
Western
Western
Salary is expected to increase by $1,404 for
Salary is expected to increase by $1,404 for
each additional year of experience (when the variable
each additional year of experience (when the variable
score on programmer attitude test
score on programmer attitude test
is held constant).
is held constant).
b
1
= 1. 404
b
b
1
1
= 1. 404
= 1. 404
Interpreting the Coefficients
Interpreting the Coefficients
24
24
Slide
Slide
©
©
2005 Thomson/South
2005 Thomson/South
-
-
Western
Western
Salary is expected to increase by $251 for each
Salary is expected to increase by $251 for each
additional point scored on the programmer aptitude
additional point scored on the programmer aptitude
test (when the variable
test (when the variable
years of experience
years of experience
is held
is held
constant).
constant).
b
2
= 0.251
b
b
2
2
= 0.251
= 0.251
Interpreting the Coefficients
Interpreting the Coefficients
25
25
Slide
Slide
©
©
2005 Thomson/South
2005 Thomson/South
-
-
Western
Western
Multiple Coefficient of Determination
Multiple Coefficient of Determination
n
n
Relationship Among SST, SSR, SSE
Relationship Among SST, SSR, SSE
where:
where:
SST = total sum of squares
SST = total sum of squares
SSR = sum of squares due to regression
SSR = sum of squares due to regression
SSE = sum of squares due to error
SSE = sum of squares due to error
SST = SSR + SSE
SST = SSR + SSE
2
()
i
yy
−
∑
2
()
i
yy
−
∑
2
ˆ
()
i
yy
=−
∑
2
ˆ
()
i
yy
=−
∑
2
ˆ
()
ii
yy
+−
∑
2
ˆ
()
ii
yy
+−
∑