Forecasting the manpower requirement in vietnamese tertiary institutions.PDF
Bạn đang xem bản rút gọn của tài liệu. Xem và tải ngay bản đầy đủ của tài liệu tại đây (792.24 KB, 13 trang )
Asian Journal of Empirical Research, 2013, 3(5): 563-575
563
FORECASTING THE MANPOWER REQUIREMENT IN VIETNAMESE
TERTIARY INSTITUTIONS
Wang Chia-Nan
1
Nguyen Nhu Ty
2
ABSTRACT
In Vietnam, the number of students has risen so fast since reform and opening-up; whereas, the
faculties are not enough to be sufficient to that raising. In fact, the Bachelors are outnumbered in
many Vietnamese universities. Thus, the problem is how to prepare and to reach the high qualified
teaching/learning and faculty to adapt with the rising numbers of students in recent years and next
years on. In addition, this research is to do analyses and get prediction values of students and
faculties in all Vietnamese universities for the future by taking the statistics provided by the
Ministry of Vietnamese Education and Training from 1999 to 2011 and adapting Grey Model to
forecast. This study also analyses on the trending of the faculty and students to get valuable results
which are accurate by applying the Mean Absolute Percentage Error (MAPE) showing low range
errors. After that, this study can provide the Ministry of Vietnamese Education and Training
(MOET) a good method and results to plan the education policies and resources allocation in the
future.
Keywords: Vietnam Education, Numbers of Students and Faculties, Grey Forecasting, Grey
Model.
INTRODUCTION
Education now develops all around the world toward the life-long and international trend. The
numbers of students and lecturers in which are the important and irreplaceable elements for any
professional education to make this trend become effective and global. With the rapid development
of society and economy in Vietnam since reform and opening-up, Vietnamese education has made
great progress in which tertiary education also has made remarkable development and great
1
Department of Industrial Engineering and Management National Kaohsiung University of Applied Sciences, Taiwan
E-mail:
2
International Relations Office Lac Hong University, Vietnam E-mail:
Asian Journal of Empirical Research
journal homepage:
Asian Journal of Empirical Research, 2013, 3(5): 563-575
564
contribution to the popularization and development of the whole society and economy, and the
national quality improvement. Recently, many researches in the globe have been taken place with a
cognitive activity to reveal the essence and law of higher education. As a result, these researches
have contributed to the society, economy and education development. For example, Trends in
Global Higher Education: Tracking an Academic Revolution - A report prepared for the UNESCO
World Conference on Higher Education by Altbach, (2009). Another example is the contribution to
the Chinese Education system Grey System Research on Influencing Factor and Forecast of Scale
of Chinese Ordinary Higher Education from Li, (2009). Li has analyzed influencing factors and
prediction of the future of scale of Chinese ordinary higher education. Nevertheless, tertiary
researches are still at the early stage in Vietnam with single and simple research approaches, and so
the research results are obviously limited and lack of positive analyses. That is the reason why there
are not a lot of provided materials about education in Vietnam; especially in detail research even
yearbooks and sources have been searched. In fact, just the rough statistics in the Vietnam Ministry
of Education and Training website is available about the numbers of students and lecturers in recent
academic years. Therefore, it is time to try the exact research method to extend the research
thoughts of higher education.
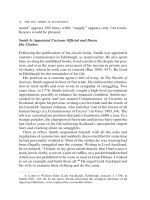
Among the total numbers of faculties, according to Altbach et al. (2009), there are only 9% of
Chinese academic professionals holding doctorates, 35% having doctoral qualifications in India.
Altbach et al. (2009) also stated that up to half of the world‟s university faculties have only earned
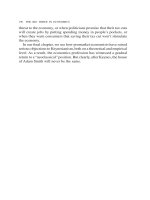
Bachelor‟s degrees. In 2011, Vietnam had 74,573 lecturers totally, just 1,924 PhDs and 30,374
Masters – shown in Figure-1. From the above figure, it states out that the Bachelors are
outnumbered to the others, which makes education activities underdeveloped, according to
Associate Professor Vo Van Sen - President of Social and Human Sciences University. He also
declared that one of the weaknesses of Vietnamese education system is that there is a crisis towards
lacking of teaching staff and the qualified ones. Another aspect is that the steady flow of students
coming to universities to study annually in Vietnam is huge (Figure-3). The official data in Figure-
2 show that there were around 2,162,106 tertiary students while totally calculated to be only 74,573
faculties in Vietnam in 2011. As the result, the research would see the numbers in future. This is
the very important objective; since if it‟s predicted well or even likely exactly, the Ministry can
have their calculation applied to this change in numbers of students and lecturers in universities.
Whenever the good forecast is applied, it is easier to build the strategy. The strategy here includes
how to adapt with the number of students which is rising so fast, how to provide faculty, facilities.
Moreover, lecturers play the central part, so to standardize the numbers between students and
lecturer is the contribution for the Ministry to consider and solve out some problems in order to
minimize the ratio between students per a teaching staff into the ideal digit.
Asian Journal of Empirical Research, 2013, 3(5): 563-575
565
Figure-1. The Total Faculty; PhDs and Master Lecturers in 2011, Vietnam
Source: The Statistics of Ministry of Vietnamese Education and Training (2011)
Figure-2.The Total Number of Students Compared with the Total Faculty in 2011, Vietnam
Source: The Statistics of Ministry of Vietnamese Education and Training (2011)
Figure-3.The Total Numbers of Students (Colleges and Universities) in Recent Years, Vietnam
Source: The statistics of Ministry of Vietnamese Education and Training (2011)
74,573
1,924
30,374
Total Faculties Ph.D. Lecturers Master Lecturers
2,162,106
74,573
Total students Total faculties
Asian Journal of Empirical Research, 2013, 3(5): 563-575
566
Moreover, with all above-stated facts and reasons, this research will apply Grey Model formulated
by Professor Deng Julong in 1982 to study the problems of less data, poor information and
uncertainty (Liu et al. 2004) to make positive analysis about trending of students and lecturers in
Vietnam from 2007 to 2011, and prediction for 06 coming years 2012 - 2017. There are three
problems raised and solved in this paper: first, it will apply Grey Forecasting to make grey
prediction analysis about the total enrollment, then to estimate and to balance the ratio of university
students and lecturers; second, it will find out the very urgent and significant concern that
Bachelors are outnumbered to others; and finally, the solutions to reach high-qualified teaching
staff.
LITERATURE REVIEW
Fundamental Concepts of Grey Forecasting
To see and have an overview about the future values through the past and current data is what it
means by prediction (Liu et al. 2004). Grey Model is to forecast the system using both clear data
and changeable information. It means that Grey is used to make forecasting the time-related grey
process of change in particular field or range (Cheng, 2003). It is also known as GM as to predict
quantity on Grey Prediction Model. Step 1 is to input the data sequence of strong regularity by
methods of grey generating to make less randomness of the original data flow. The second step it
gets various equation model established to discover and gain the rule of sequence, also forecast the
trend for the future of the current system. Thus, a great leap can be easily achieved to set up the
familiar and dynamic differential equation through fixed data source (Liu et al. 2004 and Cheng,
2003). In short, Grey Forecasting is the most widely used and chosen to forecast the magnitude of
numerical data leaned on the single time series data (Tang, 2007).
Grey Model
This is a time series forecasting model, which is refreshed as the latest data coming available to the
prediction model, and the differential equations of the Grey Model have time-varying coefficients.
The Grey Model can only be used in positive data sequences (Deng, 1989). This paper uses grey
models to make prediction for the future values of the primitive data points since all the primitive
data points are positive. To obtain the n-step ahead predicted value of the system, this research
solves the differential equation, Grey Model Lastly, the Inverse Accumulating Generation Operator
(IAGO) is applied to search for the predicted values of original data by the predicted value (Deng,
1982).
(0)
=
0
1
,
0
2
, ,
0
, 4 where
(0)
is a non-negative sequence
and n is the sample size of the data. When this sequence is subjected to the Accumulating
Generation Operation (AGO), the following sequence
(1)
is obtained. It is obvious that
(1)
is
monotonically increasing.
Asian Journal of Empirical Research, 2013, 3(5): 563-575
567
(1)
=
1
1
,
1
2
, ,
1
, 4,
1
=
0
, = 1,2,3 ,
=1
The generated mean sequence of
(1)
of
(1)
is defined as:
(1)
=
1
1
,
1
2
, ,
1
, where
1
is the mean of adjacent, i.e.
1
=
0.5
1
+ 0.5
1
1
, = 2,3, , . The least square estimate sequence of the grey
difference equation of Grey Model is defined as follows (Deng, 1982):
0
+
1
= .
The whitening equation is therefore, as follows
1
()
+
1
= . In above,
,
is a
sequence of parameters that can be seen as follows:
,
=
1
= [
0
2
,
0
3
, ,
0
]
=
1
2
1
1
3
1
. .
. .
. .
1
1
The solution of
1
() at time k:
1
+ 1
=
0
1
+
. The IAGO is
calculated to show out the following grey model to obtain the predicted value of the primitive data
at time (k + 1):
0
+ 1
=
0
1
1
and the predicted value of the
primitive data at time (k + H):
0
+
=
0
1
+1
1
.
Important Reasons to Apply Grey Model
In education, many complicated issues, or even unsolvable, could be clearly solved, and deeper
understandings towards difficult problems in the term related to the calculation of numbers can be
solved out with the help of newly emerging fields of study (Gu and Xu, 1999). Moreover, applying
to the predicting numbers of Vietnamese lecturers and students in the future is a critical problem
that has not been solved yet. This method is suitable for the trends of the digits, and also opens a
new view for forecasting the problems of human resources related to the numbers mentioned above
in Vietnam education system. In fact, the numbers of lecturers and students in Vietnam fluctuate
uncertainly due to many complicated reasons, such as education policies, facilities for researching,
salary issue, and brain draining in high tech, fluctuated recruiting student numbers, and university
Asian Journal of Empirical Research, 2013, 3(5): 563-575
568
locations i.e. many are big cities and vice versa to suburb areas. So that applying this method is
reasonable for the research and finding out solutions for the future work of the general management
to the education system based on the predicted numbers in the next two years and future.
CASE ANALYSIS
Data Source
This paper uses the statistics provided by the Vietnam Ministry of Education and Training. These
data were posted in the official website based on the real numbers of total students and lecturers in
all Vietnamese universities. Then to adapt with the purposes of research, this study divides the
statistics into two main parts: students in universities and teaching staff in universities.
Table-1. Total University Students in Recent Years
Academic Years
Full time
In-service
Total
1999-2000
376,401
343,441
719,842
2000-2001
403,568
327,937
731,505
2001-2002
411,721
351,535
763,256
2002-2003
437,903
367,220
805,123
2003-2004
470,167
428,600
898,767
2004-2005
501,358
544,933
1,046,291
2005-2006
546,927
469,349
1,087,813
2006-2007
677,409
495,738
1,173,147
2007-2008
688,288
492,259
1,180,547
2008-2009
468,855
468,855
1,242,778
2009-2010
496,292
496,292
1,358,861
2010-2011
465,243
465,243
1,435,887
Source: The Statistics of Ministry of Vietnamese Education and Training (Sept., 2011)
Table-2.Total University Faculties
Academic Years
Doctors
Masters
Bachelors
Other
Degrees
Total
2007-2008
5,643
15,421
16,654
499
38,217
2008-2009
5,879
17,046
17,610
472
41,007
2009-2010
6,448
19,856
19,090
567
45,961
2010-2011
7,338
22,865
20,059
689
50,951
Source: The Statistics of Ministry of Vietnamese Education and Training (Sept., 2011)
In the two tables, the total numbers of students have been arranged separately on the academic
years including three kinds including full time: day time program (4-5 years); in-service: night time
education – students can work and study at the same time; and the total of these numbers. Lecturers
in universities are divided into levels PhDs, Masters, Bachelors and other degrees. After the data
Asian Journal of Empirical Research, 2013, 3(5): 563-575
569
are collected (Tables 1 & 2), this study uses them to have some calculating samples applying grey
forecasting developed by Deng, (1982).
Sample Forecasting of Grey Model
In this part, a practical forecasting is conducted on the number of students in the Academic years
1999~2007 by adopting the above Grey Model by Deng, (1982); and the predicted results are by
means of relative error test. This model is based on Matlab software to do calculation. The number
of students (as sample) in Vietnam from academic years 1999 to 2007 is listed as in Table 3. From
the Table 3, it is apparent that the number of students during the eight school years from 1999 to
2007 increased from 893,754 to 1,540,201, which proves that this number is at a stage of rapid
growth.
Table-3. The Original, Prediction Values, and AGO of the Total Students
Values
School Years
Original
Prediction
AGO
*
1
1999-2000
893,754
893,754
893,754
2
2000-2001
918,228
892,763
1,811,982
3
2001-2002
974,119
973,255
2,786,101
4
2002-2003
1,020,667
1,061,005
3,806,768
5
2003-2004
1,131,030
1,156,666
4,937,798
6
2004-2005
1,319,754
1,260,951
6,257,552
7
2005-2006
1,387,107
1,374,639
7,644,659
8
2006-2007
1,540,201
1,498,577
9,184,860
*AGO (Accumulated Generating Operation)
Accuracy Inspection Analysis of Forecasting Ability
Numerous methods exist for judging forecasting model accuracy, and no single recognized
inspection method exists for forecasting ability. Mean Absolute Percentage Error (MAPE) is often
used to measure forecasting accuracy (Teng and Huang, 2009). MAPE is the average absolute
percent error which measures of accuracy in a fitted time series value in statistics, specifically
trending (Stevenson, 2009). Smaller MAPE value indicates better forecasting ability.
100
1
Actual
ForecastActual
n
MAPE
; n Forecasting number of step. Evaluation of MAPE
forecasting ability is divided forecasting ability is evaluated as follows:
<10% Excellent forecasting ability
10%~20% Good forecasting ability
20%~50% Reasonable forecasting ability
>50% Poor forecasting
Asian Journal of Empirical Research, 2013, 3(5): 563-575
570
In order to ensure that the Grey Forecasting based on MATLAB has high accuracy for application
in predicting the number in reality, this part of the research calculates the errors of the process.
Table 4 shows the range of these errors from 0.09% to 4.46%, forecasting ability.
Table-4. Calculating Process of MAPE
Period
Actual
Forecast
Error (A-F)
[
÷ ]
×
1
893,754
893,754
0
0
0.00
2
918,228
892,763
25,465
25,465
2.77
3
974,119
973,255
864
864
0.09
4
1,020,667
1,061,005
-40,338
40,338
3.95
5
1,131,030
1,156,666
-25,636
25,636
2.27
6
1,319,754
1,260,951
58,803
58,803
4.46
7
1,387,107
1,374,639
12,468
12,468
0.90
8
1,540,201
1,498,577
41,624
41,624
2.70
%14.2
8
14.17
100
1
Actual
ForecastActual
n
MAPE
Moreover, in this sample, MAPE is used to know the average absolute percent error of the whole.
Obviously, as the result of MAPE (2.14%) for the whole process equally to 8 periods, it is stated
that grey prediction is a good method for forecasting.
FINDINGS AND DISCUSSIONS
Results
The calculations on the numbers of students and teach staff in recent academic years from 2007 to
2011 are analyzed in this section. Furthermore, the prediction values for the six next school years
2011-2012 to 2016-2017 are mentioned in table 5 with the updated data from the MOET. It‟s
obviously that the real numbers of students and faculties are rising, and also the forecast‟s ones.
The errors between the real and forecasted data in 2011-2012 are so small as calculated 6.97% for
total students; and 4.25%, 4.21% and 4.72% for universities lecturers including PhDs, Masters and
Bachelors, respectively.
Trending for Development
The line graph below demonstrates the general trend in recent school years and next six years as
predicted. Firstly, Ph.D. lecturers are on progress with the percentage of Vietnamese university
faculties around 14.20% and 14.96%. Masters, meanwhile, steadily rises in recent years and
predicted values, at only 40.88% in (2007-2008) to 55.33% in (2016-2017) as forecasted. However,
Bachelor lecturers, in general have dropped sharply in recent years and next 06 years. The gap
Asian Journal of Empirical Research, 2013, 3(5): 563-575
571
between Masters and Bachelors used to be -3.27 (40.88% for Masters and 44.15% for Bachelors) in
2007-2008; and after 10 years it will be +25.14 (55.33% Masters and 30.19% Bachelors). This is as
a result showing good trend for the future; the other for PhDs is also important to raise the
percentage of this group.
Table-5. The Results of Forecasting with Updated Data
Academi
c years
Forecasted by Grey
Model
Updated Data (Sept. 11,
2012)*
Total
students
Faculties
Total
Students
Faculties
PhDs
Masters
Bachel
ors
PhDs
Masters
Bachelo
rs
2011-
2012
1,548,99
4
8,157
26,433
21,483
1,448,02
1
8,519
27,594
22,547
2012-
2013
1,663,58
1
9,125
30,590
22,912
2013-
2014
1,785,34
5
10,186
35,262
24,422
2014-
2015
1,917,08
7
11,388
40,768
26,043
2015-
2016
2,057,20
3
12,707
46,956
27,757
2016-
2017
2,208,73
4
14,202
54,246
29,597
Updated Data Source: The Statistics of Ministry of Vietnamese Education and Training (Sept.,
2012). *These are not mentioned in the time of doing this paper (Oct., 2011 – June, 2012)
Figure-3. The General Trend in Recent School Years and Next Six Years as Predicted
2007-2008
2008-2009
2009-2010
2010-2011
2011-2012
2012-2013
2013-2014
2014-2015
2015-2016
2016-2017
PhDs
14.96%
14.50%
14.20%
14.60%
14.55%
14.57%
14.58%
14.56%
14.54%
14.49%
Masters
40.88%
42.05%
43.74%
45.49%
47.14%
48.84%
50.47%
52.13%
53.71%
55.33%
Bachelors
44.15%
43.44%
42.05%
39.91%
38.31%
36.58%
34.95%
33.30%
31.75%
30.19%
0%
10%
20%
30%
40%
50%
60%
Asian Journal of Empirical Research, 2013, 3(5): 563-575
572
Students-per-Faculty Ratio
In this thesis, the ratios are mentioned as an important part in the findings because it shows the
Vietnamese education foundation to have the good ratios in the near future. Ratios here are
calculated as the number of students per a lecturer. “The trend to have 450 students among 10,000
citizens, but this trend has to be adjusted to acquire the quality in education, due to the fact. The
number of lecturers is not enough; socialized speed is not reached, and the potential of investment
on education and training is limited so that we cannot make into the quantity only” said Mr. Bui
Van Ga – Vice Ministry of Vietnam Ministry of Education and Training. Vietnam is now trying to
decrease the rate between students and lecturers, so that number of students is focused not to
overestimate.
Total in (2007-2008): Ratio: = = 30.891
Table-6. The Ratio of Student per a Lecturer by the Academic Years
School Years
Total Students
Total Lecturers*
The Ratio =
2007-2008
1,180,547
38,217
30.891
2008-2009
1,242,778
41,007
30.306
2009-2010
1,358,861
45,961
29.566
2010-2011
1,435,887
50,951
28.182
2011-2012**
1,548,994
56,073
27.625
2012-2013
1,663,581
62,627
26.563
2013-2014
1,785,345
69,870
25.552
2014-2015
1,917,087
78,199
24.515
2015-2016
2,057,203
87,420
23.532
2016-2017
2,208,734
98,045
22.528
*Lecturers with other degrees are in small in numbers so it does not effect to the results (around
1%). ** Numbers in italics are forecasted.
Table 6 figures that with the same process as above the rates in (2008-2009) was 30.306, and
29.565 and 28.182 for (2009-2010) and (2010-2011), respectively. The predicted values produce
the ratio which is on downturn from 27.625 in next year (2011-2012) to 22.528 (2016-2017). It is
apparently that the number of students for 01 lecturer‟s capacity is controllable with range from 22
to 30 students in one classroom.
The Discussions of the Results
To the listed calculation results, it is shown that there would be the stable trend to the predicted
numbers. Relied on the meaning of each digit, it‟s concerned that the Vietnamese people‟s
affordability for the tertiary and the society‟s educational structure are the main factors towards the
Teachers
Students
38217
1180547
Asian Journal of Empirical Research, 2013, 3(5): 563-575
573
impact of the development scale around the adult higher education in Vietnam, whereas the
demographic structure of society, the employment structure of society and the level of economic
development are comparatively the minor ones.
After the further analysis of these indexes, we can find out some important information.
1. It is shown that the demand of Vietnamese society towards the well-educated or the high-level-
educated people is rising up based on the education structure of society, so that day by day more
non-school-age faculty with not-high-levels of education will make decision on accepting tertiary
education to get the improvement in their educational level and meet the social requirements.
2. The growing income of most of residents is one more reason for top priority of the investment in
higher education.
3. The demographic structure, the working environment structure of society and the developing
economy review the quick growth of Vietnamese society and economy from the macroscopic
view. Such development takes no doubt a good part in the development of tertiary education in
Vietnam.
To solve the problem of quantity and quality in the tertiary education should be based on the new
ways of thinking and application of the new training technology. In the recent 12 years, the total
number of students has increased 2.5 times – from 893,754 in 1999 to 2,162,106 in 2011,
especially the pace has become faster. However, the teaching staff in 2011 was only 74,573 (1) so
the ratio of students per faculty in the country has been at around 28. Moreover, some universities
have the bigger digit, up over 100 (2). The above figures make some education managers worried.
The issue of managing quantity is in place a harsh and it is reflected more on the public opinion.
CONCLUSIONS AND SUGESTIONS
It is a great opportunity for students, teachers, and staff to access to advanced knowledge, learning
methods and modern research, and contact with the cultures of countries around the world.
However, the question is that not everyone gets the opportunity. The number of students studying
aboard is accounted for only a very small percentage of the total number of pupils and students all
over Vietnam. Besides, if viewed in economic relations, the foreign studying abroad is a form of
purchased services in another country, and then it would lose an amount of foreign currency. That's
not to mention numerous men have not returned after studying, but continued living and working
abroad. This can lead to the brain drain for developing countries. Meanwhile, foreign direct
investment in education services can solve the above disadvantages, when foreign investors build
scientific research institutions, schools and facilities for higher learning and research. Thus,
researchers, lecturers, pupils, students can study and learn at their own country, it can lead to the
result that foreign investment in local education can save costs and avoid the brain drain
phenomenon. In conclusion, according to the research of this paper, the scale of tertiary education
Asian Journal of Empirical Research, 2013, 3(5): 563-575
574
is growing wider and larger with some influential factors, for instance the social educational
structure, the eager and affordability to get higher education of the Vietnamese, the recent growth
of social economy and infrastructure, and so on. However, due to the weak regularity of related
data about adult higher education of our country, the results of this study probably contain some
errors compared with the facts. Therefore, how to improve the reliability of application Grey
Forecasting in the field of research on adult higher education will become a focus of further
research. Moreover, with the attained results from this research, this method can be applied for
further education resources planning, for example, high school or maybe the whole educational
system so that, it is so important to have good strategies to make good development for Vietnamese
education system.
REFERENCES
Altbach, P.G., Reisberg, L., and Rumbley L. E. (2009) Trends in Global Higher Education:
Tracking an Academic Revolution - A report prepared for the UNESCO 2009 World
Conference on Higher Education.
Cheng, C. C. (2003) Forecasting the Benefit of a University Based on the Grey Model. Journal of
Nanjing Institute of Technology: Natural Science Edition, 2003, Vol. 1, No. 1, pp. 59-66 (in
Chinese).
Deng, J. L. (1987) Basic Methods of Grey System. Huazhong University of Science and
Technology Press, Wuhan City, Hubei Province, China.
Deng, J. L. (1989) Introduction to Grey System Theory. The Journal of Grey System. No. 1, pp.1–
24.
Đỗ, H. (2012) Một giảng viên dạy 423 sinh viên at ‘ />duc/575863/Mot-giang-vien-day-423-sinh-vien-tpov.html‟, May 4
th
, 2012.
Government’s Resolution of Basic Innovations and Comprehensive Higher Education for
Vietnam (2006-2010) at „
=15003&opt=brpage‟
Gu, J. F. and Xu, G. Z. (1999) Preface for Grey Systems Theory and Its Application (2
nd
edn).
Beijing: Science Press.
Hải, D. (2011) Trường đại học „khát‟ giảng viên at „ />duc/2011/11/truong-dai-hoc-khat-giang-vien/‟, November 2
nd
, 2011.
Hồng, H. (2012) Kết quả kiểm tra 38 trường: Có ngành trên 400 sinh viên/giảng viên at
„ />viengiang-vien.htm‟, May 4
th
, 2012.
Lâm, Q. T. (1998) “Vai trò của các đại học Mở trong việc giải bài toán quan hệ giữa quy mô và
chất lượng Giáo dục đại học Việt Nam”. Hội thảo nhân dịp kỷ niệm 5 năm thành lập Đại học
Mở Hà Nội, Nov., 1998 (in Vietnamese).
Asian Journal of Empirical Research, 2013, 3(5): 563-575
575
Li, D. J. (2009) Grey System Research on Influencing Factor and Forecast of Scale of Chinese
Ordinary Higher Education. Proceedings of 2009 IEEE International Conference on Grey
Systems and Intelligent Services, November 10-12, 2009, Nanjing, China.
Lin, C. R. and Deng, J. L. (1996) Grey Prediction of Gas Pool. New Developments in Grey
Systems Research (Chinese), edited by Liu, S.F. and Xu, Z. X. Press of Huangzhong
University of Science and Technology, Wuhan, 1996, pp. 25-3.
Liu, S. F, Dang, Y. G., and Fang, Z. G. (2004) Grey System Theory and Its Application. Beijing:
Science Press, 2004 (in Chinese).
Liu, S. F. and Lin, Y. (1998) An Introduction to Grey Systems.PA, USA: IIGSS Academic
Publisher.
Mean Absolute Percentage Error at „
_error‟, February 2013.
Stevenson, J. W. (2009) Operations Management (10
th
edn).McGraw-Hill companies.
Tang, Q. Y. (2007) DPS Data Processing System - Experimental Design, Statistical Analysis and
Data Mining. Beijing: Science Press, 2007 (in Chinese).
Teng, H. C.and Huang, Y. F. (2009) Comparison and Analysis of Trend Co-opetition and Grey
Forecasting Model Selection –A Case Study of the Taiwan IC Assembly Industry in 2009.
The Statistics of Ministry of Vietnamese Education and Training (2011)
at„
Yearbook of Vietnamese Education and Training (2003) Thong Ke press - Hanoi Vietnam (in
Vietnamese).