Farmland loss nonfarm diversication and inequality A micro-econometric analysis of household surveys in Vietnam
Bạn đang xem bản rút gọn của tài liệu. Xem và tải ngay bản đầy đủ của tài liệu tại đây (636.67 KB, 26 trang )
MPRA
Munich Personal RePEc Archive
Farmland loss, nonfarm diversification
and inequality: A micro-econometric
analysis of household surveys in Vietnam
Tuyen Tran and Huong Vu
Vietnam National University, Waikato University, New Zealand
14. June 2013
Online at />MPRA Paper No. 47596, posted 15. June 2013 14:48 UTC
`1
Farmland loss, nonfarm diversification and inequality:
A microeconometric analysis of household surveys in Vietnam
Tuyen Tran
a
1
and Huong Vu
b
a
University of Economics and Business,
b
Waikato University, New Zealand
Vietnam National University, Hanoi Academy of Finance, Vietnam
Abstract:
The relationship between farmland loss, nonfarm diversification and inequality has been well-documented in the
literature. However, no study has quantified this relationship. Using a dataset from a 2010 field survey involving
477 households, this study has contributed to the literature by providing the first econometric evidence about the
impacts of farmland loss (due to urbanization and industrialization) on nonfarm diversification and income
quality among households in Hanoi's peri-urban areas. Our results show that under the impact of farmland loss,
households have actually diversified their income through various nonfarm activities, notably in informal wage
work. In addition, while farmland loss has reduced the share of farm income, resulting in an increase in income
inequality, it has also increased the share of informal wage income, leading to a decrease in income inequality.
Keywords:Farmland acquisition, formal wage income, fractional multinomial logit and Gini decomposition.
JEL: Q12, O15.
1
Corresponding author. We gratefully acknowledge financial support from Vietnamese Government
for this study. The authors are most grateful for the helpful comments by Steven Lim and Michael
Cameron. The usual disclaimer applies.
Contact: , Huong Vu- .
`2
1. Introduction
International experience indicates that rapid urbanization and economic growth often coincide
with the conversion of land from the agricultural sector to industry, infrastructure and
residential uses (Ramankutty, Foley, and Olejniczak, 2002). Over the past two decades in
Vietnam, an immense area of farmland has beentakentoprovide space for urbanisation and
industrialzation. According to Le (2007), 697,417 hectares of land were compulsorily
acquired by the State for the construction of industrial zones, urban areas and infrastructure
and other national use purposes from 1990 to 2003. Furthermore, in the period 2000-2007 it
was estimated that approximately 500,000 hectares of agricultural land were converted for
nonfarm use purposes, accounting for 5 percent of the country's land (Vietnam Net/TN,
2009).
Increasing urban population and rapid economic growth, particularly in urban areas of
Vietnam's large cities, have resulted in a great demand for urban land. For example, almost
500,000 hectares of farmland was acquired for the use of urban, industrial, or commercial
land in the period 1993–2008 (the World Bank (WB), 2011). In order to satisfy the rising land
demand for urban expansion and economic development in the Northern key economic
region, most farmland acquisitions have taken place in the Red River Delta, which has a large
area of fertile agricultural land, a prime location and high population density (Hoang,
2008).
2
Consequently, farmland acquisition has a major effect on households in Vietnam's
rural and peri-urban areas (the Asian Development Bank (ADB), 2007). In the period 2003-
2008, it was estimated that the acquisition of agricultural land considerably affected the
livelihood of 950,000 farmers in 627,000 farm households. About 25-30 percent of these
farmers became jobless or had unstable jobs (VietNamNet/TN, 2009).
In the context of accelerating loss of farmland due to urbanization and industrialization
in the urban fringes of large cities in Vietnam, we wonder how and to what extent farmland
loss has affected household livelihood sources, which are measured as household income
shares by source. The motivation to pursue this topic originates from two main reasons. First,
while a number of studies have examined the impact of farmland loss on households'
livelihood adaptation, their findings are mixed. Some studies indicate negative impacts of
farmland loss because farmland loss may cause the loss of traditional agricultural livelihoods
2
This key economic region includes Hanoi, Hai Phong, Vinh Phuc, Bac Ninh, Hung Yen, Quang Ninh, and Hai
Duong.
`3
and lead to food insecurity (e.g., Nguyen, 2009 in Vietnam, and Deng, Huang, Rozelle, and
Uchida, 2006 in China). Nevertheless, other studies show positive impacts of farmland loss on
rural livelihoods as farmland loss may offer a wide-range of nonfarm job oppertunities for
local pepople (e.g., Nguyen, Nguyen, Ho, 2013). Similar observations have been also found in
China (Chen, 1998; Parish, Zhe, and Li, 1995) and Bangladesh (Toufique and Turton, 2002).
More importantantly,all above studies use either qualitative methods or descriptive statistics
when investigating the impacts of farmland loss, possiblely because of the unavailablity of
data, and this obviously limits our understanding. Using a dataset from a 2010 field survey,
this study contributes to the literature by providing the first econometric evidence of the
impact of farmland loss on household livelihood sources.
Another important contribution of this study is that we consider the indirect impact of
farmland loss on income inequality. It has been found that income sources have a close
association with income inequality in Vietnam (Adger, 1999; Cam and Akita, 2008; Gallup,
2002). Hence, if farmland loss affects household income shares by source, which in turn how
it will cause changes in income inequality. Our results indicate that farmland loss has a
significant impact on the household livelihood sources and it also has indirect mixed effects
on income inequality.
The remainder of paper is structured as follows: Data and the methodology are
mentioned in section 2. Results and discussions are reported in section 3. Conclusions and
policy implications are made in the final section.
2. Data and Methodology
2.1 Study site and data collection
2.1.1 Study site
The data for this study was collected through our household survey in Hoai Duc, a peri-urban
district of Hanoi.
3
The district is situated on the northwest side of Hanoi, 19 km from the
Central Business District (CBD). Hoai Duc is an appropriate site for this research since it
holds the biggest number of farmland-acquisition projects among districts of Hanoi (Huu Hoa,
2011). A huge area of agricultural land in the district has been taken for many projects in
recent years. In the period from 2006 to2010, around 1,560 hectares of farmland have been
3
Surveyed areas in administrative map of Hoai Duc District, Hanoi (see Appendix 1)
`4
compulsorily acquired by the State for 85 projects (Ha Noi Moi, 2010).The district covers an
area of 8,247 hectares of land, of which agriculture land accounts for 4,272 hectares and 91
percent of this area is used by households and individuals (Hoai Duc District People's
Committee, 2010). Hoai Duc has 20 administrative units, including 19 communes and 1 town.
There are around 50,400 households with a population of 193,600 people living in the district.
In the whole district, the share of agricultural employment decreased by around 23 percent
over the past decade. However, a considerable share of employment has still remained in
agriculture, making up around 40 percent of the total employment in 2009 (Statistics
Department of Hoai Duc District, 2010).
2.1.2 Data collection
Adapted from the General Statistical Office (GSO) (2006), De Silva et al. (2006), and Doan
(2011), a household questionnaire was constructed to collect a quantitative data on household
characteristics and assets, income-earning activities (working time allocation), and household
economic welfare (income and consumption expenditure).
4
A disproportionate stratified
sampling method was employed with two steps as follows: First, 12 communes that lost their
farmland (due to the land acquisition by the State) were divided into three groups based on
their employment structure. The first group consisted ofthree agriculture-based communes;
the second one was represented by five communes that based on both agricultural and non-
agricultural production while the third one included fournon-agriculture-based communes.
From each group, two communes were randomly chosen. Second, from each of these
communes, 80 households, including 40 households with farmland loss and 40 households
without farmland loss, were randomly chosen, for a target of sample size of 480.The survey
was implemented from April to June 2010. 477 households were successfully interviewed,
among which 237 households lost some or all of their farmland. Due to some delays in the
implementation of the farmland acquisition, of the 237 land-losing households, 124
households had farmland acquired in the first half of 2008 and 113 households had farmland
acquired in early 2009.
4
More details for sampling frame, questionnaire and study site, see Tuyen (2013)
`5
2.2 Model specification and estimation methods
2.2.1 The impacts of farmland loss on income shares by source
In order to consider the effect of farmland loss on income shares by source, our empirical
specification is as below:
5
iiiiii
uFLDZXY
33210
where dependent covariate (Y
i
) is the income shares by various livelihoods sources. Based on
our own fieldwork experience, survey data and thedefinition of the Vietnam informal sector
introduced by Cling et al. (2010), five types of income sources are identified at the household
level namely farm income (income from household agriculture, including crop and livestock
production and other related activities); nonfarm self-employment income(income earned
from own household businesses in nonfarm activities); informal wage income (income from
wage work that is often casual, low paid and often requires no education or low education
levels. Informal wage workers are often manual workers who work for other individuals or
households without formal labour contracts); formal wage income (formal wage work that is
regular and relatively stable in factories, enterprises, state offices and other organizations with
formal labour contracts and often requires skills and higher levels of education); and finally
other income (income from other sources such as remittances, rental, and pensions).
Among independent variables, farmland loss (FL) was considered as the variable of
interest. The farmland acquisition by the State took place at different times; therefore, land-
losing households were divided into two groups namely (i) those that lost their farmland in
2008 and (ii) those lost their farmland in 2009. The reason for this division is that the length
of time since farmland acquisition was expected to be highly associated with the changes in
income sources. In addition, the level of farmland loss was quite different among households.
Some lost little, some lost part of their land while others lost all their land. As a consequence,
the level of farmland loss, as measured by the proportion of farmland acquired by the State in
2008 and in 2009, was expected to capture the influence of farmland loss on households’
income shares. In general, households with a higher level of land loss were hypothesized to
have a lower share of farm income and conversely, were expected to raise the proportion of
all other nonfarm incomes.
5
Definitions and descriptive statistics of variables in the models (see Appendices 2, 3,4)
`6
Second, livelihood strategies may change year to year but they always change slowly
because of irreversible investments in human and social capital that are requirements for
switching to a new income-generating strategy. Due to path dependence, past livelihood
choices (Z
i
) are thought to considerably determine the present livelihood choice (Pender and
Gebremedhin, 2007). This implies that households’ current income shares by source might be
largely determined by their past livelihood strategy. Hence, we included thepast livelihood
strategy variable as an important explanatory predictor that was expected to considerably
affect income shares by source.
Finally, following the framework for micro policy analysis of rural livelihoods
proposed by Ellis (2000), income shares by source were assumed to be determined by vector
X
i
including household livelihood assets (natural, physical, human, financial and social
capital).Furthermore, commune dummies(D
i
)were also included to control for the fixed
commune effects. Such communal variables were expected to capture differences between
communes in terms of farmland fertility, educational tradition, local infrastructure
development and geographic attributes, and other unobserved community level factors that
may affect households’ income sources.
Since each of dependent variables (including the share of farm, informal wage, formal
wage, nonfarm self-employment and other income) is a fraction lies between zero and one and
the shares from this set of dependent variables for each observation add up to one, a fractional
multinomial logit model (FMLM) proposed by Buis (2008) is employed. As Buis (2008)
notes, the FMLM is a multivariate generalization of the fractional logit model developed by
Papke and Wooldridge (1996) to deal with the case where the shares add up to one. Similar to
the fractional logit model, the FMLM is estimated by using a quasi-maximum likelihood
method, which in this case always implies robust standard errors (Buis, 2008). In fact, there
are a growing number of studies applying the FMLM to handle models containing a set of
fractional response variables with shares that add up to one (Barth, Lin, and Yost, 2011; Choi,
Gulati, and Posner, 2012; Kala, Kurukulasuriya, and Mendelsohn, 2012; Winters, Essam,
Zezza, Davis, and Carletto, 2010).
2.2.2 The relationship between income sources and income inequality
Another interest in this study is that we consider the indirect role of farmland loss in income
inequality through investigating the linkage between income share by sources and
inequality.Among the different ways of inequality measurement, according to López-Feldman
`7
(2006), the Gini coefficient of total income inequality (G) is popularly used to measure the
disparity in the distribution of income, consumption, and other welfare indicators and is
denoted as:
(1)
where
represents for the share of income source in total income,
is the Gini coefficient
of the income distribution from source , and
is the correlation coefficient between income
from source and with total income Y.
The Gini decompositions are analytical tools used for investigating the linkage between
income share by sources and inequality (Van Den Berg and Kumbi, 2006). First, Babatunde
(2008) shows that
is known as the pseudo-Gini coefficient of income source , while the
share or contribution of income source to total income inequality is expressed as:
(2)
Beyond this, as shown by Stark, Taylor, and Yitzhaki (1986), the income source
elasticity of inequality indicates the percent change in the overall Gini coefficient resulting
from a one percent change in income from source, is expressed as:
(3)
Where is the overall Gini coefficient prior to the income change. As noted by Van Den
Berg and Kumbi (2006), Equation (3) is the difference between the share of source in the
overall Gini coefficient and its share of total income (Y). It should be noted that the sum of
income source elasticities of inequality should be zero, which means that if all the income
sources changed by same percentage, the overall Gini coefficient () would remain
unchanged.
3. Empirical results
This section provides two sets of results. Sub-section 3.1 reports the impacts of farmland loss
on income shares by source. Sub-section 3.2 presents the results from investigating the
relationship between income sources and inequality using a Gini decomposition analysis.
`8
3.1 Farmland loss and household livelihood source
Table 1: Fractional multinomial logit estimates for determinants of nonfarm income
shares
Note: Robust standard errors in parentheses. RPRs are Relative Proportion Ratios. Estimates are adjusted for
sampling weights. *, **, *** mean statistically significant at 10%, 5 % and 1 %, respectively. The farm income share
is the excluded category.
Explanatory variables
Informal wage income
Formal wage income
RPRs
Coefficients
RPRs
Coefficients
Land loss 2009
4.984**
1.606**
4.309*
1.461*
(3.177)
(0.638)
(3.365)
(0.781)
Land loss 2008
15.937***
2.769***
5.400***
1.686***
(8.778)
(0.551)
(3.299)
(0.611)
Household size
0.788***
-0.238***
0.920
-0.084
(0.059)
(0.075)
(0.087)
(0.095)
Dependency ratio
1.134
0.125
1.007
0.006
(0.194)
(0.171)
(0.302)
(0.300)
Number of male working
1.486***
0.396***
1.259
0.231
members
(0.214)
(0.144)
(0.264)
(0.210)
Household head's gender
0.831
-0.185
0.714
-0.338
(0.251)
(0.301)
(0.266)
(0.372)
Household head's age
0.999
-0.001
0.998
-0.002
(0.011)
(0.011)
(0.015)
(0.015)
Age of working members
0.948***
-0.054***
0.949***
-0.052***
(0.016)
(0.017)
(0.017)
(0.018)
Education of working
1.009
0.009
1.339***
0.292***
members
(0.064)
(0.063)
(0.090)
(0.067)
Social capital
1.034
0.033
1.148*
0.138*
(0.081)
(0.078)
(0.092)
(0.080)
Farmland/adult
0.866***
-0.144***
0.879***
-0.128***
(0.046)
(0.053)
(0.043)
(0.049)
Residential land size
1.002
0.002
1.006
0.006
(0.006)
(0.006)
(0.011)
(0.011)
House location
0.805
-0.217
1.147
0.137
(0.198)
(0.246)
(0.373)
(0.326)
Formal credit
0.906
-0.099
0.688
-0.373
(0.214)
(0.236)
(0.211)
(0.306)
Informal credit
0.794
-0.231
0.598
-0.515
(0.215)
(0.270)
(0.197)
(0.330)
Productive assets/working
0.697***
-0.361***
0.711***
-0.341***
members
(0.063)
(0.091)
(0.084)
(0.118)
Past livelihood A
6.605***
1.888***
2.812**
1.034**
(1.819)
(0.275)
(1.360)
(0.483)
Past livelihood B
0.858
-0.153
13.329***
2.590***
(0.499)
(0.582)
(4.959)
(0.372)
Past livelihood C
0.656
-0.422
1.994
0.690
(0.301)
(0.460)
(1.105)
(0.554)
Commune dummies
(included)
Intercept
263.401***
5.574***
3.743
1.320
(349.737)
(1.328)
(6.578)
(1.757)
Observations
457
457
Wald chi2(96)
1185.30
Prob> chi2
0.0000
`9
Table 1 (continued)
Note: Robust standard errors in parentheses. RPRs are Relative Proportion Ratios. Estimates are adjusted for
sampling weights. *, **, *** mean statistically significant at 10%, 5 % and 1 %, respectively. The farm income share
is the excluded category.
Explanatory variables
Non-farm self-employment income
Other income
RPRs
Coefficients
RPRs
Coefficients
Land loss 2009
1.889
0.636
8.283***
2.114***
(1.251)
(0.662)
(6.688)
(0.807)
Land loss 2008
3.874***
1.354***
6.776**
1.913**
(2.025)
(0.523)
(5.391)
(0.796)
Household size
0.937
-0.065
0.702***
-0.354***
(0.086)
(0.092)
(0.075)
(0.107)
Dependency ratio
1.269
0.239
1.926***
0.655***
(0.201)
(0.159)
(0.365)
(0.190)
Number of male working
0.671**
-0.400**
0.416***
-0.876***
members
(0.123)
(0.183)
(0.122)
(0.293)
Household head's gender
0.510**
-0.673**
0.592*
-0.524*
(0.140)
(0.274)
(0.179)
(0.303)
Household head's age
1.002
0.002
1.036***
0.036***
(0.012)
(0.012)
(0.012)
(0.011)
Age of working members
0.984
-0.016
1.013
0.013
(0.015)
(0.015)
(0.021)
(0.021)
Education of working
1.110**
0.104**
1.332***
0.287***
members
(0.056)
(0.050)
(0.087)
(0.065)
Social capital
0.966
-0.035
1.062
0.060
(0.075)
(0.078)
(0.108)
(0.102)
Farmland/adult
0.839***
-0.176***
0.923
-0.080
(0.050)
(0.060)
(0.109)
(0.118)
Residential land size
0.987
-0.013
0.998
-0.002
(0.009)
(0.009)
(0.007)
(0.007)
House location
2.936***
1.077***
0.980
-0.020
(0.649)
(0.221)
(0.281)
(0.287)
Formal credit
1.524*
0.421*
1.211
0.191
(0.372)
(0.244)
(0.381)
(0.315)
Informal credit
0.542**
-0.613**
0.587
-0.532
(0.131)
(0.241)
(0.232)
(0.395)
Productive assets/working
1.107
0.102
0.792**
-0.233**
members
(0.114)
(0.103)
(0.094)
(0.118)
Past livelihood A
0.639
-0.448
2.149*
0.765*
(0.221)
(0.346)
(0.939)
(0.437)
Past livelihood B
0.443**
-0.815**
5.965***
1.786***
(0.179)
(0.403)
(2.624)
(0.440)
Past livelihood C
7.408***
2.002***
5.741***
1.748***
(2.088)
(0.282)
(2.372)
(0.413)
Commune dummies
(included)
Intercept
0.757
-0.279
0.039*
-3.248*
(1.006)
(1.329)
(0.076)
(1.962)
Observations
457
457
Wald chi2(96)
1185.30
Prob> chi2
0.0000
`10
As indicated in Table 1, the coefficients of land loss in both years are statistically significant
and positive; suggesting that land loss is positively associated with every share of all nonfarm
incomes except for the case of nonfarm self-employment income in 2009. Among nonfarm
sources, land loss is found to be most positively related to the share of informal wage income.
Possibly, this is also indicative of high availability of manual labour jobs in Hanoi’s peri-
urban areas. According to Cling et al. (2010), the informal sector in Hanoi offers the most job
opportunity for unskilled workers. Such job opportunities are also often found in Hanoi’srural
and peri-urban areas and those working in this sector have much a lower level of education
than those in other sectors(Cling, Razafindrakoto, and Roubaud, 2011).Holding all other
variables constant, a 10 percentage-point increase in the land loss in 2009 and in 2008
corresponds with around a 17 percent and 32 percent increase respectively in the relative
proportion of the informal wage income share. For the case of the share of nonfarm self-
employment income, only the land loss in 2008 is statistically significant with a 14 percent
increase in the relative proportion. This implies that there may be some potentially high entry
barriers to adopting formal wage work and nonfarm self-employment, and simultaneously
easier access to informal wage work, which makes this type of employment the most popular
choice among land-losing households. A similar trend was also observed in a peri-urban
village of Hanoi by Do (2006) and in some urbanizing communes in Hung Yen, a neighboring
province of Hanoi by Nguyen et al. (2011).
To complement the above results, we also quantify the impact of farmland loss on the
farm income share (see appendix 5). The results indicate that a higher level of land loss is
closely linked with a lower percentage of farm income in the total household income. Holding
all other variables constant, if the land loss in 2009 and land loss in 2008 rises by 10
percentage-points the relative proportion of farm income share decreases 12 percent and 18
percent, respectively.
Farmland per adult has a negative association with every share of nonfarm labour
income. While the size of residential land is not related to any change in the income shares by
source; the house location is positively associated with the percentage of nonfarm self-
employment income. The relative proportion of the share of nonfarm self-employment
income is around 3 times higher for households with a house in a prime location than those
without it, holding all other variables constant. This implies that having a house in a prime
location might allow many households to actively seize lucrative nonfarm opportunities. A
`11
similar phenomenon was also observed in a peri-urban Hanoi village by Nguyen (2009) and
in some rapid urbanizing areas of Hung Yen Province by Nguyen et al. (2011) where houses
with a suitable location were utilised for nonfarm businesses such as restaurants, small shops,
bars, coffee shops or beauty salons, etc.
Schooling years of working members are negatively associated with the share of farm
income but positively correlated with that of nonfarm self-employment income and formal
wage income. As indicated by Reardon, Taylor, Stamoulis, Lanjouw, and Balisacan (2000),
better education may shift households away from farming and the most lucrative nonfarm
opportunities often require higher educational qualifications. Male headed households tend to
have a lower share of nonfarm self-employment income, suggesting that female-headed
households are likely to be more active than male-headed households in nonfarm self-
employment activities. This is because the majority of nonfarm self-employment activities
were small trades and the provision of local services which were possibly more suitable for
women. This finding is consistent with that of Pham et al. (2010), who found that in rural
Vietnam women are more likely than men to engage in nonfarm self-employed jobs but men
are more likely to be wage earners in nonfarm activities.
Access to financial capital is related to shares of farm income and nonfarm self-
employment income, whereas each share of other income sources is found unrelated to
financial capital. However, there are some interesting points to note. Access to formal credit
has a positive association with the percentage of nonfarm self-employment income but a
similar relationship it is not observed for the case of farm income share. In addition, while
access to informal credit is positively linked with the farm income share, it is negatively
related to the nonfarm self-employment income share. Possibly this is because formal loans
tended to be used for nonfarm production rather than farm production, whereas informal loans
were more used for farm production than nonfarm production
6
.
Physical capital has a positive relationship with farm income share but that is not the
case for nonfarm self-employment income share. This may be because the majority of
nonfarm self-employment activities were made of small-scale units, specializing in small
6
As revealed by the surveyed households, about 45 percent of borrowing households said that one of their
purposes of their borrowing formal loans was for nonfarm production while the corresponding figure for farm
production was only about 10 percent. By contrast, 40 percent answered that one of the purposes of borrowing
informal loans was for farm production and the corresponding figure for nonfarm production was only around 12
percent.
`12
trades and provision of local services, which possibly did not require a large amount of
memberships, is positively associated with the formal wage income share but a similar
association is not found for other income shares. Possibly, a higher share of formal wage
income is often contributed by formal wage workers who tended to have more memberships
in groups and associations.
Finally, the inclusion of past livelihood strategies as explanatory variables in the model
helps explain that each type of current income share is closely correlated with its
corresponding past livelihood strategy. For example, households following a past informal
wage work-based strategy are much more likely to have a higher share of informal wage
income share than those pursuing past farm work-based strategy.
3.2 The relationship between income sources and inequality
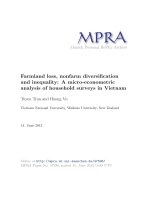
Figure 1 presents the distribution of income sources by income quintile. As compared to
households in the higher income quintiles (4 and 5), the lower income quintile households (1
and 2) had a higher share of farm income, whereas those in the richer groups had a higher
share of nonfarm self-employment and formal wage income. This suggests that income shares
by source are closely associated with the income distribution; specifically there is a positive
association between the nonfarm self-employment income share, formal wage income share
and per capita income, but a negative correlation between the farm and informal wage income
shares and per capita income.
Figure 1.Income shares by source and income quintiles
0%
20%
40%
60%
80%
100%
1 2 3 4 5
Share of total household income
Income quintiles
(income per capita)
Non-farm Formal wage Informal wage Other income Farm
`13
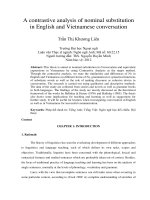
Figure 2 shows the distribution of income sources over farmland holdings. As revealed
in this figure, households in the higher landholding stratums had a much higher percentage of
farm income but had a lower share of nonfarm self-employment, formal wage incomes and
other income. By contrast, the lower landholding stratum households received more income
from nonfarm self-employment and manual labour jobs, which implies that households with
limited farmland might be pushed into these activities as a way to complement their income.
Finally, the share of formal wage income appears not to be correlated with the distribution of
farmland, suggesting that this income source may be associated with other factors, such as
education, rather than farmland holdings.
Figure 2.Income shares by source and farmland holding quintiles
Table 2 presents the Gini decomposition of income inequality by income source. The
overall Gini coefficient for the sample households was 0.267, which is much lower than the
Gini coefficient of 0.434 for the whole country and 0.411 for the Red River Delta reported by
GSO (2008). This indicates a quite low degree of income inequality among the sample
households. This reduced inequality at the district level compared tolarger areas was also
found in Vietnam by Minot, Baulch, and Epprecht (2006), who explained that, similar to other
measurements of inequality, there is a trend toward smaller Gini coefficients for smaller
regions, such as provinces or districts, than for the country as a whole. This is due to the fact
that households in a small region are likely to have more similarities than households across
the whole country.
0%
20%
40%
60%
80%
100%
1 2 3 4 5
Share of total household income
Farmland holding quintiles
(farmland size per household)
Non-farm Formal wage Informal wage Other income Farm
`14
Table 2.Gini decomposition of income inequality by income sources
Income source
Income
share
Sk
Gini
Gk
Correlation
with the
distribution of
total income
Rk
Pseudo-Gini
GkRk
Share to
total income
inequality
(RkGkSk)/G
Source elasticity
of total inequality
(RkGkSk)/G-Sk
Farm
0.232
0.606
0.121
0.073
0.064
-0.168
Nonfarm
Self-employment
0.271
0.757
0.534
0.404
0.409
0.138
Informal wage
0.197
0.727
0.012
0.009
0.007
-0.191
Formal wage
0.219
0.818
0.572
0.468
0.383
0.164
Other income
0.082
0.876
0.518
0.454
0.138
0.057
Total
1.000
0.267
1.000
Note: Estimates are based on annual per capita incomes. N=477.
In previous studies on the decomposition of income inequality in Vietnam, household
income is often disaggregated into various sources, including wage income, nonfarm self-
employment income, agricultural income and other income (Adger, 1999; Cam and Akita,
2008; Gallup, 2002). Going beyond the conventional classification, the paper further breaks
down wage income into two sub-categories, namely informal wage income and formal wage
income. By decomposing the total household income inequality into various income sources,
the results reveal that nonfarm self-employment, formal wage income and other income are
the major contributors to overall income inequality among the sample households. Taken
together, they accounted for 93 percent of the total income inequality. By contrast, farm
income and informal wage income reduced the inequality; the pseudo-Gini coefficients of
these income sources are much lower than the total Gini coefficient, whereas the pseudo-Gini
coefficients for nonfarm self-employment income, formal wage income and other income are
much higher. Specifically, a 10 percent increase in income from farm and informal wage
activities will lead to a 1.7 percent and 1.9 percent decline in the overall income inequality,
respectively. Whereas, the same increase in nonfarm self-employment, formal wage income
and other income will result in a 1.4 percent, 1.6 percent and 0.57 percent increase in the
overall income inequality, respectively.
Looking at the third and fourth column in Table 5, the results show that the inequality of
farm and informal wage incomes among households is lower than the inequality of nonfarm
self-employment, formal wage income and other income among households. In addition, as
`15
compared to nonfarm self-employment income, formal wage income and other income, farm
and informal wage incomes each have a much lower correlation with the distribution of total
income. Consequently, the incomes from farm and informal wage work had an equalizing
effect on the income distribution. This finding is partly in accordance with Gallup (2002) and
Cam and Akita (2008), who found that while agricultural income actually reduced the
inequality of income distribution, nonfarm self-employment income and other income sources
mainly contributed to inequality in Vietnam.
4. Conclusions and policy implications
The linkages between farmland loss, nonfarm diversification and inequality have been
documented in previous studies by using qualitative analysis and descriptive statistics. Going
beyond the literature, we have quantified such linkages by using a household-level dataset
from a 2010 field survey and quantitative tools. This study offers main findings as below.
First, under the impact of farmland loss due to urbanisation and industrialization, land-losing
households diversified into various nonfarm activities. Among sources of nonfarm income,
the income share from informal wage work is found to be most positively associated with land
loss, which suggests that such low skilled paid jobs have been emerging as the most common
choice of land-losing households in or near Hanoi’s peri-urban areas. Consequently, such job
opportunities might allow many land-losing households to supplement a shortfall of income
with an informal wage income, which in turn might mitigate the negative effects of land loss
and improve household welfare.
Second, the results confirm the role of natural capital in shaping peri-urban livelihoods.
While farmland is associated positively with farming but negatively with nonfarm activities, a
house or a plot of residential land in a prime location is emerging as a crucial livelihood asset
that enables households to take up nonfarm household businesses. This suggests that the
government may provide a new source of livelihood for land-losing households by granting
them a plot of non-agricultural land in a prime location for doing business. For instance, Ha
Tay Province People's committee have promulgated a new compensation policy for land-
losing households, which states that households who lose more than 30 percent of their
farmland by the State's land acquisition will be granted a plot of commercial land (đất dịch
vụ)equivalent to 10 percent of the area of acquired farmland(Hop Nhan, 2008).Đất dịch vụ is
located near industrial zones or residential land in urban areas(WB, 2009); therefore it can be
used as business premises for nonfarm activities such as opening a shop or for rent. This
`16
implies that speeding up the implementation of this policy can be one of the prerequisites to
facilitate livelihood transitions of land-losing households in Hanoi’s peri-urban areas.
Finally, econometric results indicate that farmland loss has a negative effect on farm
income share and a positive impact on informal income share. In addition, Gini
decomposition analysis shows that increasing inequality has a negative linkage with farm
income share, but is positively related with informal wage income. The above findings
suggest that land loss has indirect mixed impacts on the income distribution. The inequality -
decreasing effect of informal wage income implies that there is no or a low entry barrier to
manual labour jobs and thus everyone can undertake these jobs. In contrast, the inequality-
rising effect of other nonfarm income sources, namely nonfarm self-employment and formal
wage incomes, suggests that there are some relatively high entry barriers that hinder everyone
from participating in these high return activities.
7
Our findings, therefore, support Adger’s
hypothesis (1999) that income diversification into nonfarm activities results in either greater
income inequality if opportunities for these activities are skewed towards to the better-off; or
in less income inequality if such opportunities are accessible to the poorer parts of the
population. Hence, improving households' access to lucrative nonfarm activities is expected
not only to have a positive effect on welfare but also to have an equalizing effect on income
distribution.
7
Formal wage work and nonfarm self-employment offer much higher levels of income per hour compared to
those of farm work and informal wage work. More details, see column 1, Appendix 2
`17
Appendices
Appendix 1: Surveyed areas in administrative map of HoaiDuc District, Hanoi include DucThuong, Kim Chung,
An Thuong, Lai Yen, Song Phuong.
Source: Narenca, 2011
`18
Appendix 2: Descriptive statistics of dependent variables and income-earning activities
Income per
working hour
Annual
income per
household
Annual
income
per capita
Share of total
Income
(%)
Participation
rate
( %)
Total income
14.22
60,642
13,513
SD
9.50
33,034
7,091
Farm income (D)
11.25
14,432
3,216
27.69
83.04
SD
7.30
16,169
3,621
Nonfarm income
12.80
42,801
9,537
65.90
90.00
SD
7.12
33,571
7,140
A. Informal wage income
10.06
11,559
2,576
23.20
40.35
SD
4.10
17,703
3,973
B. Formal wage income
14.70
14,431
3,216
16.95
27.30
SD
8.60
29,762
6,232
C. Nonfarm self-employment
14.52
16,811
3,746
25.74
43.28
SD
8.57
27,803
6,231
Non-labour income (E)
3,409
760
6.41
31.88
SD
8,676
2,410
Note: SD (standard deviations). Estimates in columns 3-6 are adjusted for sampling weights. N= 477.
Income and its components inVND 1,000;US$ 1 equated to about VND 18,000 in 2009. Nonfarm income = (A+B+C).
`19
Appendix 3: Definitions and measurements of explanatory variables of fractional logit and fractional
multinomial logit models
Explanatory variables
Definition
Measurement
Farmland loss
Land loss 2009
Proportion of farmland compulsorily acquired by the State in
2009
Ratio
Land loss 2008
Proportion of farmland compulsorily acquired by the State in
2008
Ratio
Natural capital
Farmland per adult
Owned farmsize per member aged 15 and over
100 m
2
Residential land size
The total size of residential land
10
2
House location
Whether or not households have a house a plot of residential
land with a prime location.
Dummy
(=1 if yes)
Human capital
Household size
Number of household members
Number
Dependency ratio
This ratio is calculated by the number of household members
aged under 15 and over 59, divided by the total members
aged 15-59
Ratio
Number of male working
members
Number of male adult members who were employed in the
last 12 month
Number
Household head’s gender
Whether or not the household head is male
Dummy
(=1 if yes)
Household head’s age
Age of household head
Years
Education of working
members
Average years of formal schooling of adult members who
were employed in the last 12 months
Years
Age of working members
Average age of adult members who were employed in the last
12 months
Years
Social capital
Group memberships
Number of memberships in formal and informal groups and
organizations
Number
Financial capital
Dummy
Formal credit
Received any loan from banks or credit institutions in the last
24 months
(=1 if yes)
Informal credit
Received any loan from friends, relatives or neighbours in
the last 24 months
(=1 if yes)
Physical capital
Productive assets
Value of all productive assets per working member
Natural
logarithms
Past livelihood strategy
(Included)
The livelihood strategy that households followed before
farmland acquisition
Dummy
Commune dummies
(Included)
The commune in which households live
Dummy
`20
Appendix 4: Summary statistics of explanatory variables of the fractional logit and fractional multinomial
logit models
Explanatory variables
M
SD
Mean
SD
Min
Max
Farmland acquisition
Land loss 2009 (%)
10.27
24.50
13.00
27.00
0.00
1.00
Land loss 2008 (%)
10.50
24.00
14.00
26.00
0.00
1.00
Human capital
Household size
4.49
1.61
4.50
1.61
1
11
Dependency ratio
0.61
0.67
0.60
0.65
0.00
3.00
Number of male working members
1.25
0.69
1.26
0.72
0.00
4
Gender of household head*
0.77
0.48
0.78
0.41
0
1
Age of household head
51.21
13.24
51.35
12.60
21
96
Age of working members
40.46
8.25
40.04
8.07
21.50
78.00
Education of working members
8.37
2.90
8.32
2.80
0
16
Natural capital
Owned farmland size per adult
(100 m
2
)
3.43
2.80
2.92
2.41
0
18.13
Residential land size (10
2
)
21.88
14.62
22.43
15.24
0
125
House location*
0.32
0.47
0.30
0.46
0
1
Physical capital
8.63
1.17
8.60
1.15
4.94
11.25
Social capital
3.43
2.09
3.42
2.06
0
11
Financial capital
Formal credit*
0.27
0.44
0.26
0.44
0
1
Informal credit*
0.19
0.39
0.20
0.40
0
1
Past livelihood
Informal wage work*
0.22
0.42
0.21
0.41
0
1
Formal wage work*
0.18
0.38
0.18
0.38
0
1
Nonfarm self-employment *
0.19
0.39
0.16
0.36
0
1
Commune (included)
Estimates in the second and third columns, including mean (M) and standard errors (SD) are adjusted for sampling weights.
*denotes dummy variables. N=477.
`21
Appendix 5: Fractional logit estimates for determinants of farm income share
Explanatory variables
Farm income share
RPRs
SE
Coefficients
SE
Land loss 2009
0.2780**
(0.147)
-1.278**
(0.530)
Land loss 2008
0.132***
(0.055)
-2.024***
(0.419)
Household size
1.172***
(0.067)
0.159***
(0.058)
Dependency ratio
0.816
(0.108)
-0.204
(0.132)
Number of male working members
0.939
(0.101)
-0.063
(0.108)
Household head's gender
1.580**
(0.309)
0.457**
(0.195)
Household head's age
0.995
(0.008)
-0.005
(0.008)
Age of working members
1.036***
(0.012)
0.035***
(0.012)
Education of working members
0.876***
(0.031)
-0.133***
(0.035)
Social capital
0.965
(0.050)
-0.036
(0.052)
Farmland per adult
1.149***
(0.047)
0.139***
(0.041)
Residential land size
1.001
(0.005)
0.001
(0.005)
House location
0.627***
(0.100)
-0.468***
(0.160)
Formal credit
0.943
(0.163)
-0.059
(0.173)
Informal credit
1.470**
(0.286)
0.385**
(0.195)
Productive assets/working members (Ln)
1.180**
(0.084)
0.165**
(0.071)
Past informal wage work livelihood
0.303***
(0.069)
-1.193***
(0.227)
Past formal wage work livelihood
0.283***
(0.072)
-1.261***
(0.254)
Past nonfarm self-employment livelihood
0.174***
(0.042)
-1.751***
(0.243)
Commune dummy ( included)
Intercept
0.053***
(0.050)
-2.930***
(0.942)
Observations
457
Log pseudolikelihood
-10409.86357
Note: Estimates are adjusted for sampling weights. RPRs are relative proportion ratios.
SE: robust standard errors. *, **, *** mean statistically significant at 10%, 5 % and 1 %, respectively
`22
References
ADB. (2007). Agricultural land conversion for industrial and commercial use: Competing
interests of the poor. InADB, ed., Markets and Development Bulletin, Hanoi, Vietnam:
Asian Developmen Bank, pp.85-93.
Adger, W. N. (1999). Exploring income inequality in rural, coastal Viet Nam. The Journal of
Development Studies, 35(5), pp. 96-119.
Babatunde, R. O. (2008). Income inequality in Rural Nigeria: Evidence from farming
households survey data. Australian Journal of Basic and Applied Sciences, 2(1),
pp.134-140.
Barth, J. R., Lin, D., and Yost, K. (2011). Small and medium enterprise financing in transition
economies. Atlantic Economic Journal, 39(1), 19-38.
Buis, M. L. (2008). FMLOGIT: Stata module fitting a fractional multinomial logit model by
quasi maximum likelihood. Statistical Software Components.Boston College
Department of Economics. Available from
Cam, T. V. C., and Akita, T. (2008). Urban and rural dimensions of income inequality in
Vietnam.GSIR Working Paper. Graduate School of International Relations,
International University of Japan.
Cardoso, A. R., Fontainha, E., and Monfardini, C. (2010). Children’s and parents’ time use:
Empirical evidence on investment in human capital in France, Germany and Italy.
Review of Economics of the Household, 8(4), pp.479-504.
Chen, W. (1998). The political economy of rural industrialisation in China: Village
conglomerates in Shandong Province. Modern China, 24(1), pp.73-96.
Cling, J. P., Razafindrakoto, M., and Roubaud, F. (2011). The informal economy in Viet Nam.
Hanoi, Vietnam: International Labour Organisation.
Cling, J. P., Razafindrakoto, M., Rouubaud, F., Nguyen, H. T. T., Nguyen, C. H., and Phan,
T. T. N. (2010). The informal sector in Vietnam: A focus on Hanoi and Ho Chi Minh
City. Hanoi, Vietnam: The Gioi Editions.
Choi, S. J., Gulati, M., and Posner, E. A. (2012). What do federal district judges want? An
analysis of publications, citations, and reversals. Journal of Law, Economics, and
Organization, 28(3), 518-549.
De Silva, M. J., Harpham, T., Tuan, T., Bartolini, R., Penny, M. E., and Huttly, S. R. (2006).
Psychometric and cognitive validation of a social capital measurement tool in Peru
and Vietnam. Social Science & Medicine, 62(4), pp.941-953.
Deng, X., Huang, J., Rozelle, S., and Uchida, E. (2006). Cultivated land conversion and
potential agricultural productivity in China. Land Use Policy, 23(4), pp.372-384.
Do, T. N. (2006). Loss of land and farmers' livelihood: A case study in Tho Da village, Kim
No commune, Dong Anh district, Hanoi, Vietnam. Thesis (MA). Swedish University
of Agricultural Sciences, Sweden.
Doan, T. T. (2011). Impacts of household credit on the poor in peri-urban areas of Ho Chi
Minh City, Vietnam .Thesis (PhD). The University of Waikato, New Zealand
Ellis, F. (2000). Rural livelihoods and diversity in developing countries. New York, NY:
Oxford University Press.
Egloff, B., Schmukle, S. C., Burns, L. R., Kohlmann, C. W., and Hock, M. (2003). Facets of
dynamic positive affect: differentiating joy, interest, and activation in the positive and
negative affect schedule (PANAS). Journal of Personality and Social Psychology,
85(3), pp.528-540.
`23
Fazal, S. (2001). The need for preserving farmland: A case study from a predominantly
agrarian economy (India). Landscape and Urban Planning, 55(1), pp.1-13.
Gallup, J. (2002). The wage labor market and inequality in Vietnam in the 1990s. World Bank
Policy Research Working Paper No. 2896.Washington, D.C: The World Bank.
GSO. (2006). Questionnaire on Household Living Standard Survey 2006 (VHLSS-2006).
Hanoi, Vietnam: General Statistical Office.
GSO. (2008). The result of survey on household living standards 2008. Hanoi, Vietnam:
Statistical Publishing House.
Ha Noi moi. (2010). Vướng nhất là giao đất dịch vụ cho dân [ Granting land for services to
people is the biggest obstacle].Hanomoi [online]. Available from
/>dan/148/5244280.epi (Accessed on 2 June 2013).
Hoai Duc District People's Committee. (2010). Báo cáo thuyết minh kiểm kê đất đai năm
2010 [2010 land inventory report]. Ha Noi, Vietnam: Hoai Duc District People's
Committee.
Hoang, B. T. (2008). Công nghiệp hóa nông thôn và những biến đổi trong gia đình nông thôn
hiện nay: Nghiên cứu trường hợp xã Ái Quốc, Nam Sách, Hải Dương[Rural
industrialisation and changes in the life of Vietnamese rural families : A case study in
Ai Quoc Commune, Nam Sach, Hai Duong].In VNU, Ed. The Third International
Conference on Vietnam studies,4-7 December 2008. Hanoi, Vietnam.Pp.256-271.
Hop Nhan. (2008). Giải phóng mặt bằng tại Hà Tây: Bao giờ hết "tắc"? [Site clearance in Ha
Tay: When will it be solved?)].Monre. Available from
/>CKE7S43669 (Accessed on 2 June 2013).
Huu Hoa. (2011). Mỏi mắt ngóng đất dịch vụ [Waiting for land for services for a weary long
time in vain].Hanoimoi .Available from />te/532088/moi-mat-ngong-dat-dich-vu (Accessed on 2 June 2013).
Jonasson, E. (2011). Informal employment and the role of regional governance. Review of
Development Economics, 15(3), pp.429-441.
Kala, N., Kurukulasuriya, P., and Mendelsohn, R. (2012). The impact of climate change on
agro-ecological zones: Evidence from Africa. Environment and Development
Economics, 1(1), 1-25.
Le, D. P. (2007). Thu nhập, đời sống, việc làm của người có đất bị thu hồi để xây dựng các
khu công nghiệp, khu đô thị, kết cấu hạ tầng kinh tế-xã hội, các công trình công cộng
phục vụ lợi ích quốc gia [Income, life and employment of those whose land was
acquired for the construction of industrial zones, urban areas, infrastructures and
public projects]. Hanoi, Vietnam: National Political Publisher.
Lerman, R. I., and Yitzhaki, S. (1985). Income inequality effects by income source: a new
approach and applications to the United States. The Review of Economics and
Statistics, 67(1), pp.151-156.
López-Feldman, A. (2006). Decomposing inequality and obtaining marginal effects. Stata
Journal, 6(1), pp.106-111.
Minot, N., Baulch, B., and Epprecht, M. (2006). Poverty and inequality in Vietnam: Spatial
patterns and geographic determinants. Research Report. Washington D.C:
International Food Policy Research Institute.
Nguyen, T. D., Vu, D. T., and Philippe, L. (2011). Peasant responses to agricultural land
conversion and mechanism of rural social differentiation in Hung Yen province,
Northern Vietnam. Paper presented at the 7th ASAE International Conference, Hanoi,
Vietnam, 13-15 October 2011.
`24
Nguyen, T. H. H., Nguyen, T. T., and Ho, T. L. T. (2013). Effects of Recovery of Agricultural
Land to Life, the Jobs of Farmers in Van Lam Distric, Hung Yen Province. Journal of
Science and Development, 11(1), pp. 59-67.
Nguyen, V. S. (2009). Industrialisation and urbanisation in Vietnam: How appropriation of
agricultural land use rights transformed farmers' Livelihoods in a Per-Urban Hanoi
Village? EADN working paper No.38. Hanoi, Vietnam: East Asian Developmet
Network.
Papke, L. E., and Wooldridge, J. M. (1996). Econometric methods for fractional response
variables with an application to 401 (k) plan participation rates. Journal of Applied
Econometrics, 11(6), pp.619-632.
Parish, W., Zhe, X., and Li, F. (1995). Nonfarm work and marketization of the Chinese
countryside. The China Quarterly, 143(Sep.,1995), pp.697-730.
Pender, J., and Gebremedhin, B. (2007). Determinants of agricultural and land management
practices and impacts on crop production and household income in the highlands of
Tigray, Ethiopia. Journal of African Economies, 17(3), pp.395-450.
Pham, T. H., Bui, A. T., and Dao, L. T. (2010). Is nonfarm diversification a way out of
poverty for rural households? Evidence from Vietnam in 1993-2006. PMMA Working
Paper 2010-17.
Punj, G., and Stewart, D. W. (1983). Cluster analysis in marketing research: Review and
suggestions for application. Journal of Marketing Research, 20(2), pp.134-148.
Ramankutty, N., Foley, J., and Olejniczak, N. (2002). People on the land: Changes in global
population and croplands during the 20th century. AMBIO: A Journal of the Human
Environment, 31(3), pp.251-257.
Reardon, T., Taylor, J. E., Stamoulis, K., Lanjouw, P., and Balisacan, A. (2000). Effects of
nonfarm employment on rural income inequality in developing countries: An
investment perspective. Journal of Agricultural Economics, 51(2), pp.266-288.
Shorrocks, A. F. (1982). Inequality decomposition by factor components. Econometrica,
50(1), pp.193-211.
Stark, O., Taylor, J. E., and Yitzhaki, S. (1986). Remittances and inequality. The Economic
Journal, 96(383), pp.722-740.
Statistics Department of Hoai Duc District. (2010). Statistical Yearbook of Hoai Duc 2009.
Hanoi, Vietnam: Statistics Department of Hoai Duc District.
Toufique, K. A., and Turton, C. (2002). Hand not land: How livelihoods are changing in
rural Banladesh. Dhaka, Bangladesh: Bangladesh Institute of Development Studies.
Tuyen, Q. T. (2013). Farmland acquisition and household livelihoods in Hanoi's peri-urban
areas. (PhD thesis). The University of Waikato, Hamilton, New Zealand.
Van Den Berg, M., and Kumbi, G. E. (2006). Poverty and the rural nonfarm economy in
Oromia, Ethiopia. Agricultural Economics, 35(3), pp.469-475.
VietNamNet/TN. (2009). Industrial boom hurts farmers, threatens food supply: seminar.
VietnamNews.biz. Available from />farmers-threatens-food-supply-seminar_470.html (Accessed on 2 June 2013).
Wagner, J. (2001). A note on the firm size–export relationship. Small Business Economics,
17(4), pp.229-237.
WB. (2009). Improving land acquisition and voluntary land conversion in Vietnam.Policy
Note 51942. Washington D.C:The World Bank.
WB. (2011). Vietnam development report 2011: Natural resources management. Washington,
D.C: The World Bank.