MEASURING the Real Size of the WORLD ECONOMY
Bạn đang xem bản rút gọn của tài liệu. Xem và tải ngay bản đầy đủ của tài liệu tại đây (6.14 MB, 696 trang )
MEASURING
the Real Size of the
WORLD ECONOMY
T
he Framework, Methodology, and Results of
th
e International Com
p
arison Pro
g
ram
—
IC
P
MEASURING
the Real Size of the
WORLD ECONOMY
T
he Framework, Methodology, and Results of
th
e International Com
p
arison Pro
g
ram
—
IC
P
THE WORLD BANK
© 2013 International Bank for Reconstruction and Development / e World Bank
1818 H Street NW, Washington DC 20433
Telephone: 202-473-1000; Internet: www.worldbank.org
Some rights reserved
1 2 3 4 16 15 14 13
is work is a product of the sta of e World Bank with external contributions. Note that e
World Bank does not necessarily own each component of the content included in the work. e
World Bank therefore does not warrant that the use of the content contained in the work will not
infringe on the rights of third parties. e risk of claims resulting from such infringement rests
solely with you.
e ndings, interpretations, and conclusions expressed in this work do not necessarily
re ect the views of e World Bank, its Board of Executive Directors, or the governments they
represent. e World Bank does not guarantee the accuracy of the data included in this work. e
boundaries, colors, denominations, and other information shown on any map in this work do not
imply any judgment on the part of e World Bank concerning the legal status of any territory or
the endorsement or acceptance of such boundaries.
Nothing herein shall constitute or be considered to be a limitation upon or waiver of the
privileges and immunities of e World Bank, all of which are speci cally reserved.
Rights and Permissions
is work is available under the Creative Commons Attribution 3.0 Unported license (CC BY 3.0)
Under the Creative Commons Attribution license,
you are free to copy, distribute, transmit, and adapt this work, including for commercial purposes,
under the following conditions:
Attribution—Please cite the work as follows: World Bank. 2013. Measuring the Real Size of the
World Economy: e Framework, Methodology, and Results of the International Comparison Program
—ICP. Washington, DC: World Bank. DOl:10.1596/978-0-8213-9728-2). License: Creative
Commons Attribution CC BY 3.0
Translations—If you create a translation of this work, please add the following disclaimer along
with the attribution: is translation was not created by e World Bank and should not be con-
sidered an o cial World Bank translation. e World Bank shall not be liable for any content or
error in this translation.
All queries on rights and licenses should be addressed to the O ce of the Publisher, e
World Bank, 1818 H Street NW, Washington, DC 20433, USA; fax: 202-522-2625; e-mail:
ISBN (paper): 978-0-8213-9728-2
ISBN (electronic): 978-0-8213-9731-2
doi: 10.1596/978-0-8213-9728-2
Cover design: Jomo Tariku, e World Bank.
Contents
Preface . . . . . . . . . . . . . . . . . . . . . . . . . . . . . . . . . . . . . . . . . . . . . . . . . . . . . . . ix
Acknowledgments . . . . . . . . . . . . . . . . . . . . . . . . . . . . . . . . . . . . . . . . . . . . . xi
Contributing Authors . . . . . . . . . . . . . . . . . . . . . . . . . . . . . . . . . . . . . . . . . xiii
Executive Summary . . . . . . . . . . . . . . . . . . . . . . . . . . . . . . . . . . . . . . . . . . . .xv
Frederic A. Vogel
Introduction: Reshaping the World. . . . . . . . . . . . . . . . . . . . . . . . . . . . . . 1
Angus S. Deaton
1
The Framework of the International Comparison Program . . . . . . . . 13
D. S. Prasada Rao
2
Governance Structure of ICP 2005 . . . . . . . . . . . . . . . . . . . . . . . . . . . . . .47
Paul McCarthy
3
National Accounts Framework for International Comparisons:
GDP Compilation and Breakdown Process . . . . . . . . . . . . . . . . . . . . . . .59
Paul McCarthy
4
Computation of Basic Heading PPPs for Comparisons
within and between Regions. . . . . . . . . . . . . . . . . . . . . . . . . . . . . . . . . . . .93
D. S. Prasada Rao
V
VI MEASURING THE REAL SIZE OF THE WORLD ECONOMY
5
Methods of Aggregation above the Basic Heading
Level within Regions . . . . . . . . . . . . . . . . . . . . . . . . . . . . . . . . . . . . . . . . . . 121
W. Erwin Diewert
6
Methods of Aggregation above the Basic Heading Level:
Linking the Regions. . . . . . . . . . . . . . . . . . . . . . . . . . . . . . . . . . . . . . . . . . . 169
W. Erwin Diewert
7
The ICP Survey Framework . . . . . . . . . . . . . . . . . . . . . . . . . . . . . . . . . . . . 197
Frederic A. Vogel
8
The Ring Comparison: Linking the Regions . . . . . . . . . . . . . . . . . . . . . 225
Frederic A. Vogel
9
Validation of ICP Regional Prices and Basic Heading PPPs . . . . . . . 245
David Roberts
10
Validation of Basic Heading and Aggregated PPPs:
When Does Validation End and Estimation Begin? . . . . . . . . . . . . . . 279
Frederic A. Vogel
11
Health and Education . . . . . . . . . . . . . . . . . . . . . . . . . . . . . . . . . . . . . . . . . 301
Derek Blades
12
Dwelling Services. . . . . . . . . . . . . . . . . . . . . . . . . . . . . . . . . . . . . . . . . . . . . 319
Alan Heston
13
Construction . . . . . . . . . . . . . . . . . . . . . . . . . . . . . . . . . . . . . . . . . . . . . . . . . 343
Paul McCarthy
14
Machinery and Equipment . . . . . . . . . . . . . . . . . . . . . . . . . . . . . . . . . . . . . 369
Derek Blades
15
Government Services . . . . . . . . . . . . . . . . . . . . . . . . . . . . . . . . . . . . . . . . . 393
Derek Blades
16
Government Services: Productivity Adjustments . . . . . . . . . . . . . . . . 413
Alan Heston
17
Reference PPPs . . . . . . . . . . . . . . . . . . . . . . . . . . . . . . . . . . . . . . . . . . . . . . . 441
Derek Blades and Yuri Dikhanov
18
Extrapolating PPPs and Comparing ICP Benchmark Results . . . . . . 473
Paul McCarthy
19
Results and Empirical Analysis, ICP 2005. . . . . . . . . . . . . . . . . . . . . . . 507
Yuri Dikhanov and Frederic A. Vogel
VIICONTENTS
20
Absolute Poverty Measures for the Developing World,
1981–2008 . . . . . . . . . . . . . . . . . . . . . . . . . . . . . . . . . . . . . . . . . . . . . . . . . . . 531
Shaohua Chen and Martin Ravallion
21
PPP Exchange Rates for the Global Poor . . . . . . . . . . . . . . . . . . . . . . . 553
Angus S. Deaton and Olivier Dupriez
22
International Relative Price Levels: An Empirical Analysis. . . . . . . . 589
Charles omas, Jaime Marquez, Sean Fahle, and James Coonan
23
PPP Estimates: Applications by the International Monetary
Fund. . . . . . . . . . . . . . . . . . . . . . . . . . . . . . . . . . . . . . . . . . . . . . . . . . . . . . . . . 603
Mick Silver
24
Using Expenditure PPPs for Sectoral Output and Productivity
Comparisons . . . . . . . . . . . . . . . . . . . . . . . . . . . . . . . . . . . . . . . . . . . . . . . . . 617
Robert Inklaar and Marcel P. Timmer
Abbreviations . . . . . . . . . . . . . . . . . . . . . . . . . . . . . . . . . . . . . . . . . . . . . . . . 645
Glossary . . . . . . . . . . . . . . . . . . . . . . . . . . . . . . . . . . . . . . . . . . . . . . . . . . . . . 647
Preface
T
he International Comparison Program (ICP) has become not only the largest international
statistical program in the world, but also the most complex. e rst coordinated attempt to
produce purchasing power parities was carried out from 1967 to 1970; it was based on 10 coun-
tries. In the years leading up to 2005, six rounds of the ICP were conducted, each with more coun-
tries and each with improved methodology. e 2005 ICP included 100 countries from Africa, the
Asia-Paci c, the Commonwealth of Independent States, South America, and Western Asia, plus
46 countries from the comparison conducted by Eurostat (the statistical o ce of the European
Union) and the Organisation for Economic Co-operation and Development. e 2005 ICP stands
on the shoulders of those who developed the theory and methodology used in previous rounds.
e lessons learned from previous ICP rounds led to the development of several signi cantly
new and improved methods for the 2005 ICP. e subsequent analysis of the 2005 data set the
stage for additional improvements to the 2011 ICP.
is volume is a comprehensive review of the statistical theory and methods underlying
the estimation of PPPs and real expenditures, the choices made for the 2005 ICP round, and the
lessons learned that led to improvements in the 2011 ICP. Disclosing the theory, concepts, and
methods underlying estimates enhances the transparency of the 2011 ICP process. is allows
interested stakeholders and users to fully understand the strengths, limitations, and assumptions
underlying the estimates. is volume also contains several chapters about uses of the data from
the 2005 ICP. ese uses are signi cant because they expand the boundaries of the needs served by
the ICP to encompass poverty estimation and analysis of the global economic situation.
Worldwide, no other statistical program requires so much cooperation among national,
regional, and international organizations. e ICP greatly depends on the overwhelming support
received from national statistical o ces. ey assume the e ort of and responsibility for provid-
ing the prices and other measures underlying all components of the gross domestic product and
breaking it down into subaggregates.
IX
X MEASURING THE REAL SIZE OF THE WORLD ECONOMY
On behalf of the World Bank and the ICP Executive Board, I thank all who have contrib-
uted to this volume. It is not possible to give credit in this limited space to all of the individuals
responsible for its successful completion. Many are listed in the acknowledgments section that
follows. Here I highlight the contributions of two special groups. Much of the material presented
is based on the wholehearted discussions of the ICP’s Technical Advisory Group, which included
many of the authors. e Global O ce team, which is located in the World Bank, provided the
means for the expert data analysis underlying many of the chapters and championed completion
of the book.
Finally, to everyone involved in producing this book, thanks very much for a job well done.
Shaida Badiee, Director
Development Data Group, World Bank
Acknowledgments
T
his report by the International Comparison Program (ICP), Measuring the Real Size of the
World Economy, was prepared by the World Bank, with contributions from the leading inter-
national experts in the elds of economics and statistics on international comparisons. e con-
tributors and their a liations are listed separately.
is volume was prepared under the aegis of the Bank’s Development Data Group, which is
led by Shaida Badiee, director, and Grant Cameron, manager. e global manager of the Interna-
tional Comparison Program is Michel Mouyelo-Katoula. e e ort to prepare the ICP book was
guided and overseen by Frederic A. Vogel. e book was edited by Sabra Ledent. Virginia Romand
assisted with the coordination e ort. Jomo Tariku and Virginia Romand steered the book through
production.
e World Bank is grateful for the e orts of the authors, who contributed ground-breaking
analysis and results describing complicated methodology in a transparent fashion. Members of the
ICP Global O ce provided valuable input about the scope and content of the book, and special
mention is made of Nada Hamadeh, who helped manage the overall project. Other members of
the ICP Global O ce are recognized in the chapters in which they provided the computations and
other input. Individual mention is also made of D. S. Prasada Rao at the University of Queensland,
Australia, for his suggestion that the World Bank publish a book about the ICP and for his early
input into the development of the scope and content of many of the chapters.
XI
Contributing Authors
Derek Blades, World Bank consultant and former sta member, Organisation for Economic Co-
operation and Development, Paris
Shaohua Chen, Senior Statistician, Development Research Group, World Bank
James Coonan, U.S. Federal Reserve Board
Angus S. Deaton, Dwight D. Eisenhower Professor of International A airs and Professor of Eco-
nomics and International A airs, Woodrow Wilson School of Public and International
A airs, Princeton University
W. Erwin Diewert, Professor, Department of Economics, University of British Columbia
Yuri Dikhanov, Senior Economist/Statistician, Development Data Group, World Bank
Olivier Dupriez, Lead Statistician, Development Data Group, World Bank
Sean Fahle, University of California, Los Angeles
Alan Heston, Professor Emeritus, Department of Economics, University of Pennsylvania
Robert Inklaar, Groningen Growth and Development Centre, Faculty of Economics and Business,
University of Groningen
Jaime Marquez, U.S. Federal Reserve Board
Paul McCarthy, consultant, International Comparison Program, World Bank
D. S. Prasada Rao, Professor and ARC Professorial Fellow, School of Economics, University of
Queensland, Australia
Martin Ravallion, Director, Development Research Group, World Bank
XIII
XIV MEASURING THE REAL SIZE OF THE WORLD ECONOMY
David Roberts, World Bank consultant and former sta member, Statistics Directorate, Organisa-
tion for Economic Co-operation and Development, Paris
Mick Silver, Statistics Department, International Monetary Fund
Charles omas, U.S. Federal Reserve Board
Marcel P. Timmer, Groningen Growth and Development Centre, Faculty of Economics and Busi-
ness, University of Groningen
Frederic A. Vogel, International Comparison Program, World Bank, and former Global Manager,
ICP
Executive Summary
I
n its 2005 round, the International Comparison Program (ICP) became the largest and most
complex international statistical program in the world. One hundred and forty-six countries
and economies provided the thousands of prices and related measures used to estimate purchas-
ing power parities (PPPs) in order to de ate national gross domestic product (GDP) expenditures
into a common global currency. e resulting PPPs and volume indexes make possible sound
comparisons between countries that are based on economic and statistical theory. Each successive
round of the ICP since its launch in the 1960s has involved more countries and more innovations
in methodology. e results of each round provided the building blocks for the new theory and
methods introduced in the next rounds.
is book describes the challenges faced by the 2005 round of the ICP, the new theories and
methods developed to address those problems, and the lessons learned that can be applied to future
rounds of the ICP. is book has been prepared to ensure complete transparency in the theory and
methods used and the problems encountered. Much of the analysis presented by the authors of the
chapters was made possible by giving them access to a data le containing the basic heading PPPs
and expenditures for the 146 participating countries.
e book refers to six geographic regions of the world. e ve geographic ICP regions in
2005 were Africa, Asia-Paci c, Commonwealth of Independent States (CIS), South America, and
Western Asia. Although Eurostat (the statistical o ce of the European Union) and the Organisa-
tion for Economic Co-operation and Development (OECD) jointly conduct their own PPP pro-
gram, the Eurostat-OECD and ICP programs are coordinated so that all are included in the global
results. For the purposes of this book, the Eurostat-OECD comparison is considered as the sixth
region. In a similar fashion, the ICP includes both countries and economies. e term countries as
used throughout this book refers to both.
FREDERIC A. VOGEL
XV
XVI MEASURING THE REAL SIZE OF THE WORLD ECONOMY
What Is a Purchasing Power Parity?
In its simplest form, a PPP is a price ratio. PPPs for the total consumption aggregate of the GDP,
for example, are built up from comparisons of the prices of products purchased by households. To
ensure that comparable products are being priced, the characteristics of each product must be care-
fully de ned.
is summary relies on the data example in table 1 to explain the concepts and methods used
in the ICP. e table shows examples
1
of prices for three products and four countries for the rice basic
heading. e PPP between the Arab Republic of Egypt and the United Kingdom for prepacked long
grain rice is the average price in Egypt in its national currency (Egyptian pound or LE) divided by the
average price in U.K. pounds sterling (£). e price ratio 7.54 means that LE 7.54 is the cost of an
amount of long grain rice in Egypt that would cost £1.0 in the United Kingdom. Likewise, LE 3.30 is
the cost of the same quantity of long grain rice sold loose that would cost £1.0 in the United Kingdom.
As table 1 illustrates, the relative prices (product PPPs) di er by product. erefore, the
product PPPs are averaged to arrive at a PPP for the rice basic heading. e simple geometric mean
is the bilateral PPP. In practice, multilateral PPPs are computed, and this computation takes into
account the relative prices between all of the countries as a group. More will be said about this in
the sections that follow.
Because there are no weights re ecting the quantities of each product purchased, the basic
heading PPPs are computed with products and countries treated equally. However, expenditures
are available for each basic heading, and thus they are used as weights when averaging basic heading
PPPs to major aggregates such as food. e PPPs for the major aggregates are then averaged to the
GDP, again using weights. Table 2 shows PPPs for selected basic headings in the food aggregate and
the average PPP for food. e food PPP means that LE 4.22 is the cost of an amount of food in
Egypt that would cost £1.0 in the United Kingdom. More important, the expenditures in Egyptian
pounds for the food aggregate of the GDP in Egypt can be converted to the U.K. currency by
dividing it by the PPP, or 4.22. e food expenditures in the other countries can also be converted
to the U.K. pound by dividing them by their respective PPPs.
Table 1 Prices of Products in Rice Basic Heading and Their Ratios to U.K. Prices
for Selected Countries
Rice basic
heading
Egypt, Arab Rep./
United Kingdom
Estonia/
United Kingdom
Philippines/
United Kingdom United Kingdom
National
price
PPP to
U.K.
National
price
PPP to
U.K.
National
price
PPP to
U.K.
National
price PPP
Long grain,
prepacked
5.51 7.54 11.59 15.87 32.73 44.83 .73 1.00
Long grain, loose 3.47 3.30 23.35 22.23 1.05 1.00
Basmati 5.69 5.69 45.68 20.48 2.23 1.00
Geometric
mean—bilateral
PPP
5.22 18.02 31.56 1.00
Multilateral PPP 4.80 19.98 33.36 1.00
Exchange rate 10.12 22.78 90.87
Source: ICP 2005.
XVIIEXECUTIVE SUMMARY
Another important measure is the price level index (PLI), which is simply the PPP divided by
the exchange rate. PLIs that are less than 1.0 mean the products or aggregates are relatively cheap.
e PLI is also a measure of the ratio of nominal expenditures (based on the exchange rate) to real
expenditures based on PPPs. e price level indexes for food shown in table 2 indicate that food
is relatively cheap in Egypt, Estonia, and the Philippines, and also that the nominal expenditures
for food in those countries would be 0.42, 0.64, and 0.52 of the real expenditures, respectively.
e PPP for the GDP is based on the prices collected for about 1,000 products plus mea-
surements for other aggregates such as housing, government, and construction that are used to
rst estimate basic heading PPPs and then average them to the GDP. e PPPs at each level of
aggregation and for the GDP are simply a form of exchange rate to calibrate expenditures in
national currencies to a common currency. While simple to say, the resulting PPPs are based on
the very complex statistical and economic theories presented in detail in chapters 4, 5, and 6 and
summarized here in a later section.
Uses of PPPs
e PPP-based expenditures allow direct comparisons of indicators of well-being, such as expendi-
tures per capita, because they are now in a common currency. Similar comparisons can be made for
other aggregates such as health, education, housing, government, and GDP. e PPPs for household
consumption are the main input for estimation of the international poverty line, which is a main
driver of international development e orts. Countries with di erent rates of economic growth can
compare their price levels and per capita expenditures to guide their development policies. PPP-based
expenditures allow comparisons across countries for di erent sectors. For example, the 2005 ICP
showed that China accounted for 29 percent of global real expenditures on construction.
A major use of PPPs is for poverty assessments (see chapters 20 and 21). National poverty
assessments di er by country because purchasing power di ers. erefore, an international poverty
line is established using PPPs to hold the real value constant across countries. e international
poverty line of $1.25 in international dollars is translated to the national level using PPPs. House-
hold survey data are then used to determine the number of people living with per capita consump-
tion below the poverty line.
Table 2 PPPs for Selected Basic Headings and Countries (UK = 1.00)
Basic heading
Basic heading PPPs (UK = 1.00)
Egypt, Arab Rep./
United Kingdom
Estonia/
United Kingdom
Philippines/
United Kingdom United Kingdom
Rice 4.80 19.98 33.36 1.00
Other cereals 7.12 18.46 95.28 1.00
Bread 6.80 15.98 60.73 1.00
Beef and veal 4.60 10.60 31.22 1.00
. . . 29 basic headings
Food aggregate PPP 4.22 14.67 47.32 1.00
Exchange rate 10.12 22.78 90.87 1.00
Price level index 0.42 0.64 0.52
Source: ICP 2005.
XVIII MEASURING THE REAL SIZE OF THE WORLD ECONOMY
e U.S. Federal Reserve Board uses PPP-based data on the GDP and aggregates to under-
take an empirical analysis of international price levels (see chapter 22).
e International Monetary Fund (IMF) uses PPP-based GDP to determine the quota
subscriptions of member countries (see chapter 23). e quota not only determines the nancing
each country must provide to the IMF, but also determines the amount of nancing a country can
obtain from the IMF and largely determines its voting power in IMF decisions. e IMF also uses
PPP-based GDP numbers in its World Economic Outlook, which provides estimates of regional and
world output and growth.
Other organizations and researchers use PPPs for international comparisons of output and
productivity at the sector level (agriculture, manufacturing, and services). ese comparisons pro-
duce useful complements to comparisons of GDP or expenditure categories (see chapter 24).
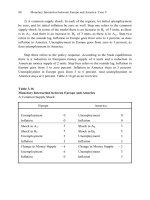
Why Not Use Exchange Rates?
is question arises often. First, exchange rates do not re ect the di erent price levels across com-
ponents of the GDP—for example, table 2 shows the variability of selected basic headings in the
food aggregate. Table 3 shows the PLIs for the GDP and major aggregates for Brazil and India.
If exchange rates were used to de ate GDP expenditures by aggregate, the same value would be
used regardless of the di erence in price levels. e comparisons of per capita expenditures across
countries would then not re ect the relative price di erences. Second, the use of PPPs allows direct
comparisons. Again using table 3, the PLI for health in both countries is considerably less than
the food price level. e PLI also reveals the di erence in health expenditures if they are de ated
using the exchange rate instead of PPPs. In other words, the nominal expenditures for health in
Brazil and India based on the exchange rate would be 55 and 13 percent, respectively, of the real
expenditures based on PPPs.
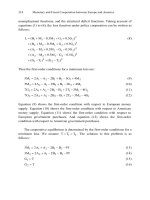
Steps to Estimating PPPs
e ICP has three major components. e rst component is the conceptual framework, which
is determined by the set of national accounts making up the GDP. e second component is the
national annual average prices or quantity or value data for a basket of goods and services that are
comparable across countries and are representative of purchasing patterns within each country. e
third component is the methodology used to compute the PPPs at the following levels: product,
basic heading, aggregates of GDP, and GDP.
Table 3 Price Level Indexes for Major Aggregates, Brazil and India
Price level indexes (world = 100 for major aggregates)
GDP Food Health Education
Collective
government
Gross fixed
capital
formation
Brazil 69 77 55 78 62 76
India 41 53 13 16 35 48
Source: ICP 2005.
XIXEXECUTIVE SUMMARY
ese three components are carried out under a governance structure whereby countries
are grouped into regions with a regional coordinator. e ICP Global O ce in the World Bank
provides the overall coordination of the program across the regions and also the coordination with
the Eurostat-OECD comparison (see chapter 2).
Figure 1 is an overview of the di erent steps required to produce estimates of PPPs. e
starting point is the GDP. e best practice in the measurement of economic activities is the System
of National Accounts 1993, which forms the basis of the ICP (see chapter 3). e breakdown of the
GDP expenditures into 155 basic headings forms the building blocks to estimate PPPs. e basic
Figure 1 Main Components of the International Comparison Program
Source: ICP.
Note: GEKS = Gini-Éltetö-Köves-Szulc.
Data validation and estimation of BH PPPs
GDP—155
basic headings
Overview of the ICP
Basic heading (BH)
expenditures in
national currencies
Construction,
equipment
prices/costs
Reference
PPPs for
imputed BHs
Productivity
adjustment
Government
salaries
Health and
education
Comparison-resistant BHs:
global specifications
Dwelling
rents and
quantities
Between-region
BH PPPs: linking
factors
BH PPP in global
currency
Within-region
BH PPPs
BH
weights
Aggregated PPPs
in regional currency
BH
weights
2005—GEKS aggregated linking factors used to calibrate
each level to the global currency and retain fixity of
regional results
2011—Global GEKS aggregation: distribute to regions
to retain fixity of regional results
BH PPP in global
currency =
between-region
PPP × within-
region PPP
Between-region
BH PPPs: linking
factors
Within-region
BH PPPs
National annual
average prices:
regional validation
National annual
average prices:
global validation
Ring product
list: price
collection
Regional product
lists: price
collection
BHs with prices from market surveys
Governance—five ICP
regions and Eurostat-
OECD comparison
BH PPP in global
currency =
between-region
PPP × within-
region PPP
Direct estimates
for some BHs
instead of
linking factors
XX MEASURING THE REAL SIZE OF THE WORLD ECONOMY
heading represents the categories into which individual products are grouped for pricing purposes;
it is the lowest level for which expenditure estimates (breakdown of the GDP) are required. Use
of the GDP as the main element of the conceptual framework of the ICP means that the prices
to be collected must be consistent with the underlying values in the national accounts. e prices
must be national annual averages and basically represent purchaser prices that include taxes and
other costs.
Basic headings fall into three main categories. e rst category is those basic headings
containing products consumers purchase in various markets. Prices for these basic headings are
obtained by means of market surveys. e second category is made up of the basic headings that are
“comparison-resistant” because of the di culties encountered in collecting data to estimate PPPs.
ese include the basic headings grouped into dwelling rents, health, education, government,
construction, and equipment. e third category is those basic headings in which the prices either
are not available or are too expensive to obtain. erefore, their PPPs are imputed using PPPs from
other basic headings (reference PPPs).
Some Basic Concepts Underlying
the Estimation of PPPs
e previous section outlined the steps taken to collect and validate the data used for estimation
of PPPs. is section reviews some basic concepts underlying the estimation of PPPs, which is the
subject of the next section.
ere are many ways in which the basic heading PPPs can be computed using the relative
product prices or simply the product PPPs—each has strengths and weaknesses. Many methods
can be used as well to average the basic heading PPPs to aggregates and then to the GDP.
e rst step is estimation of the basic heading PPPs. e bilateral PPP between any coun-
try and the United Kingdom is simply the geometric mean of the product PPPs, which, as shown
in table 1, equals 18.02 for Estonia. Also, the PPP between any two countries can be computed
directly. For example, the geometric mean of the price ratios between Egypt and Estonia is 0.243.
e PPP between Egypt and Estonia can also be measured indirectly by the ratio of their respec-
tive PPPs to the United Kingdom as the base, or 5.22/18.02 = 0.289. One could also compute
the PPP between Egypt and Estonia indirectly by dividing the PPP for Egypt and the Philippines
by the PPP for Estonia and the Philippines. If n countries are in the comparison, a PPP can be
obtained directly between any two countries, and n – 1 PPPs between the same two countries can
be obtained indirectly through the base country.
In each case, one will get di erent answers. e section that follows reveals that the one way
to estimate multilateral PPPs between any two countries is to take the geometric mean of the direct
and indirect PPPs. In table 1, the PPP for Egypt to the United Kingdom goes from 5.22 (bilateral)
to 4.80 when the multilateral estimate is computed. is means that the PPPs between any two
countries are a ected by their respective PPPs with each other country. is also means that the
PPPs between any two countries can change if the mix of countries included in the computations
changes. As illustrated in table 1, not all countries price every product. And as shown in the sec-
tions that follow, there are many ways to estimate basic heading PPPs. ese methods would all
provide about the same answer if every country priced every item.
e choice of methods is based on several properties. Multilateral PPPs are computed so
that the results satisfy two basic properties—transitivity and base country invariance. Transitivity
simply means that the PPP between any two countries should be the same whether it is computed
XXIEXECUTIVE SUMMARY
directly or indirectly through a third country. e second requirement is that the PPPs be base
country–invariant, which means that the PPPs between any two countries should be the same
regardless of the choice of base country. A simple solution is to use the geometric mean of the
direct and indirect PPPs.
e basic heading PPPs shown in table 1 are essentially averages of the relative prices with
no weights taken into account, which means that every product is treated equally. However, in
reality expenditure shares for each would not be equal. For example, the prices for long grain rice
sold loose are cheaper than the prices for Basmati. It is likely that in Egypt and the Philippines
long grain rice sold loose is purchased in much greater quantities than long grain prepacked and
Basmati, and that in Estonia and the United Kingdom prepacked long grain is the most popular of
the two kinds. Because products with the greatest expenditures are likely to have the lowest prices,
it would improve the quality of the estimates if some form of weighting could be introduced. is
brings in the concept of representativity used by the Eurostat-OECD and CIS regions in the 2005
ICP and attempted in the other regions.
A representative product is one that is purchased frequently by households and has a price
level consistent with all products in the basic heading. is classi cation can be used in applying
a form of weighting in the estimation of basic heading PPPs, as shown in chapter 4. Most coun-
tries in the ICP regions had di culty applying the concept, especially the meaning of price level.
To simplify the classi cation of products for its 2011 round, the ICP adopted a simpler concept,
importance. Each country is asked to use expert judgment to determine which product(s) would
have the largest expenditure shares. is will allow the introduction of simple weights for the
products deemed important and used to estimate basic heading PPPs.
Weights based on basic heading expenditures are used in the methodology to average a
group of basic headings to an aggregate level. e food aggregate, for example, contains 29 basic
headings. In table 2, for the column of basic heading PPPs between, say, Egypt and the United
Kingdom, there are two sets of weights: the expenditure shares for Egypt and those for the United
Kingdom. Another basic concept that determines the choice of index method is that countries be
treated equally. erefore, the basic heading PPPs are rst averaged using Egypt’s weights (Laspey-
res index), and are then averaged using the United Kingdom’s weights (Paasche index). Each index
provides a PPP between Egypt and the United Kingdom, and therefore the geometric mean is
taken. e result is a Fisher index. As discussed in chapter 5, this is a superlative multilateral index
that is consistent with economic comparisons of utility across countries. For each pair of countries,
the multilateral PPP is the geometric mean of the direct and indirect Fisher indexes. is method
was used for the 2005 ICP even though it does not satisfy the additivity requirement.
Additivity means that, for example, the expenditures for each food basic heading (in national
currency) divided by the respective PPPs should add to the sum of food expenditures (in national
currency) divided by the aggregated food PPP. e addition of major aggregate expenditures in PPP
terms to the GDP should equal the real expenditures obtained by dividing GDP expenditures (in
national currency) by the aggregated PPP for the GDP. However, the requirement that countries be
treated symmetrically produces results that are not additive. Because the nonadditive method was
used for the 2005 ICP, the real world GDP was about 2 percent smaller than the GDP obtained
by the summation of the aggregate real expenditures. ese di erences were many times larger at
the national level. However, at each level of aggregation the results were consistent with economic
comparisons of utility and also minimized the di erences between the bilateral and multilateral PPPs.
Additive methods can be used, but they have the disadvantage of giving more weight to the
relative prices of the larger, more developed countries. As a result, the real expenditures for poor
countries become larger and move further away from the bilateral PPPs.
XXII MEASURING THE REAL SIZE OF THE WORLD ECONOMY
Fixity is another concept that determines the methodology used. is means that the rela-
tive volume (ratio of real expenditures) between any pair of countries in a region remains the same
after the region has been combined with other countries or regions. is concept is critical when
a region prepares its results, which are then later converted from a regional currency to the global
currency.
Estimating PPPs—Within Regions
As depicted in gure 1, the PPPs between countries within a region are estimated in two steps. e
rst step is to estimate the basic heading PPPs. e next step is to average or, using ICP jargon, to
aggregate the basic heading PPPs for each country to higher aggregates and the GDP using expen-
diture weights. e basic requirement for each stage of aggregation is that the resulting PPPs are
transitive and base country–invariant, as de ned earlier.
From Product PPPs to the Basic Heading
is section provides a brief overview of the material presented in chapter 4 and builds o table
1 in this executive summary. e bilateral PPPs for each country shown in table 1 are a form of
a Jevons index. If the table is full—that is, if every country priced every item—then the bilateral
PPPs would be transitive and base country–invariant.
In practice, not every country can price every item. Two basic methods are used in the ICP to
calculate basic heading PPPs. e rst approach is based on the Jevons index and the Gini-Éltetö-
Köves-Szulc (GEKS) method, which turns the bilateral PPPs into multilateral PPPs to make them
transitive and base country–invariant. e GEKS method is based on averaging the direct PPPs
between any two countries with the n – 1 PPPs that can be obtained indirectly. e other method
uses a regression model known as the Country Product Dummy (CPD), which directly estimates
PPPs that are transitive and base country–invariant in one step.
As noted earlier, both methods treat every product equally regardless of their relative expen-
ditures. For that reason, the concepts of representativity and importance were introduced.
Table 4 repeats the data shown in table 1 for Egypt and the United Kingdom with represen-
tative products indicated. Long grain rice, prepacked, is representative of the basic heading in the
United Kingdom, whereas long grain rice sold loose is representative in Egypt. ere are two ways
to compute basic heading PPPs using this information. e PPP between Egypt and the United
Kingdom is computed rst using only products representative of Egypt, and then again using only
products representative of the United Kingdom. e bilateral PPP between Egypt and the United
Kingdom is then the geometric mean of these two PPPs. Basmati is not considered representative
in either country, even though prices were provided. us those prices are not used in the price
comparison for either country. ese bilateral PPPs are made transitive and base country–invari-
ant using the GEKS* method. is method is used by the Eurostat-OECD comparison and the
CIS region. e GEKS method becomes the GEKS* method when the representativity variable
is introduced.
e other regions in the 2005 ICP attempted to use the Country Product Representative
Dummy (CPRD) method, with representativity included as another variable in the regression.
However, the countries were not able to consistently provide the representativity coding because
the concept required judgment about both price levels and relative expenditures. erefore, the
XXIIIEXECUTIVE SUMMARY
concept was not used in the remaining four regions. e concept has been simpli ed for the 2011
ICP, and the importance classi cation is being used only to indicate those products with the great-
est expected expenditures. Because the importance classi cation is based on assumptions about
expenditures, the Country Product Dummy-Weighted (CPD-W) method is being used in the
2011 ICP, with important products receiving weights greater than 2.
Table 5 shows the methods that can be used to estimate basic heading PPPs. e Jevons,
Jevons-GEKS, and CPD methods provide the same results if every country prices every product
and the representative or importance classi cations are not used. However, the results produced
by the GEKS* method and either the CPRD or CPD-W method will di er for one basic reason
illustrated in table 4. In that table, Basmati rice was not representative for any country, and thus
it would not enter into the estimation of PPPs for the group of countries using the Jevons-GEKS
method. However, the CPRD and CPD-W regressions include all data, thereby becoming more
robust when the price matrix is incomplete.
e main outcome of the analysis of the 2005 ICP data is the realization that some classi ca-
tion process must be used to ensure that the products purchased most widely receive more weight
than the other products being priced. e classi cation of “importance” discussed earlier is being
used in the ICP regions for the 2011 ICP round, and basic heading PPPs are being estimated using
the CPD-W method.
Table 4 Estimating PPPs When Products Are Classifi ed as Representative or
Nonrepresentative
Rice basic heading
Egypt, Arab Rep.,
national price
United Kingdom
national price
Egypt, Arab Rep.*/
United Kingdom
Egypt, Arab Rep./
United Kingdom*
Long grain, prepacked 5.51 0.73* 7.54
Long grain, loose 3.47* 1.05 3.30
Basmati 5.69 2.23
Geometric mean 3.30 7.54
Bilateral PPP 4.98
Source: ICP 2005.
Note: The asterisk (*) indicates products representative of the basic heading price structure and frequently
purchased.
Table 5 Methods for Estimating Basic Heading PPPs
Methods for estimating basic heading PPPs
Jevons Jevons-GEKS CPD Jevons-GEKS* CPRD CPD-W
Properties Transitive and
base-invariant
with full matrix
Multilateral
procedure
to ensure
transitivity and
base invariance
with less than
full price table
Multilateral
procedure
to ensure
transitivity and
base invariance
with less than
full price table
Implied weights
used for
representative
products.
Results are
transitive and
base-invariant.
Implied weights
used for
representative
products.
Results are
transitive and
base-invariant.
Speci c
weights used
for “impor tant”
products.
Results are
transitive and
base-invariant.
Source: ICP.
Note: GEKS = Gini-Éltetö-Köves-Szulc; CPD = Country Product Dummy; CPRD = Country Product Repre-
sentative Dummy; CPD-W = Country Product Dummy-Weighted.