Quantitative cost-benefit analysis for typhoon resilient housing in Danang city, Vietnam
Bạn đang xem bản rút gọn của tài liệu. Xem và tải ngay bản đầy đủ của tài liệu tại đây (1 MB, 19 trang )
Quantitative cost-benefit analysis for typhoon
resilient housing in Danang city, Vietnam
Tran Huu Tuan
a,
⇑
, Phong Tran
b
, Kate Hawley
c
, Fawad Khan
d
,
Marcus Moench
c
a
College of Economics, Hue University, 100 Phung Hung Street, Hue City, Vietnam
b
Institute for Social & Environmental Transition (ISET), No. 18, alley 1/42, Lane 1 Au Co, Tay Ho District, Hanoi, Vietnam
c
Institute for Social & Environmental Transition (ISET), 948 North Street, Suite 7, Boulder, CO 80304, USA
d
Institute for Social & Environmental Transition (ISET), Pakistan
article info
Article history:
Received 6 March 2014
Revised 17 December 2014
Accepted 13 January 2015
Keywords:
Climate change
Cost-benefit analysis (CBA)
Da Nang city
Quantitative CBA
Typhoon resilient housing
Vietnam
abstract
Located in Central Vietnam, Da Nang city is experiencing rapid
urbanization and development. In recent years, floods and storms
have caused critical damage and losses to local communities and
destroyed thousands of houses despite great efforts of local
governments and agencies toward disaster risk reduction. Housing
is one of the most vulnerable sectors to climate extremes, of which
typhoons exhibit the greatest impact in comparison to other
climate hazards. This paper examines the costs and benefits of
applying typhoon resilient housing measures in Da Nang. The
paper aims to test the hypothesis that using typhoon resilient
housing has a positive economic return. The cost-benefit analysis
(CBA) results show that the return on investment of typhoon resil-
ient housing is positive when typhoon events occur early in the
lifetime of the house, suggesting that the investment in typhoon
resilient housing is economically desirable. The results from the
research illustrate that positive returns exist in most of the
scenarios tested, yet home owners are choosing not to make this
investment. The findings have investigated the information
asymmetry gap that exists between innovation and adoption and
explores policy implications to reduce the gap.
Ó 2015 Elsevier B.V. All rights reserved.
/>2212-0955/Ó 2015 Elsevier B.V. All rights reserved.
⇑
Corresponding author. Tel.: +84 54 3537432, mobile: +84 94 9819588; fax: +84 543529491.
E-mail addresses: (T.H. Tuan), (P. Tran), (K. Hawley),
(F. Khan), (M. Moench).
Urban Climate 12 (2015) 85–103
Contents lists available at ScienceDirect
Urban Climate
journal homepage: www.elsevier.com/locate/uclim
1. Introduction
Housing and climate change have strong links in Vietnam; housing is considered one of the most
valuable but also the most vulnerable area of local residents to climate change (MONRE, 2008; Nhu
et al., 2011; Phong and Tinh, 2010).
Located on the South Central Coast in the tropical storm belt, Da Nang experiences annual catas-
trophes. The city is characterized by a sloped topography from west to east, with many mountain
ranges, short rivers, deltas, and coastal areas, which creates a diversified ecosystem and perhaps
one of the most disaster-prone regions in Vietnam. As a coastal city, Da Nang is affected by many types
of climate hazards, including typhoons, floods, drought, coastline erosion, landslides, and so forth, and
the risk of such hazards is increasing as a consequence of global climate change.
The most dangerous hazards for Da Nang are storms (tropical lows and typhoons) and floods. The
city is impacted by three to five storms per year.
1
Storms hit this city from May to December and are
followed by long-lasting rains and inundation floods (ACCCRN, 2010). In recent years, strong storms and
floods have caused critical damage and losses to local communities and have destroyed thousands of
houses (e.g., flood in 1999, typhoon Xangsane in 2006, typhoon Nari in 2013) despite great efforts by
local governments and agencies toward DRR. According to the Vietnam Central Committee for Flood
and Storm Control (CCFSC), 80–90% of the population is affected by floods and storms. As reported by
the national government, housing is one of the sectors most vulnerable to climate extremes (MONRE,
2008). Typhoons exhibit the greatest impact on housing as compared to other climate hazards (Nhu
et al., 2011).
Many studies have acknowledged the relationship between housing vulnerability and household
poverty (Jones and Anh, 2010; McEntire, 2011; Wisner et al., 2004), but few studies deal with the eco-
nomic aspects of climate resilient housing. This research, therefore, examines the performance of cli-
mate resilient housing through an economic lens in order to analyze the costs and benefits brought by
resilient housing. This paper tests the hypothesis that applying climate resilient-related principles to
housing construction has a positive economic return to households in Da Nang.
2. Background
People living in flood and storm affected areas in Da Nang often belong to low-income groups. A
significant amount of household income is spent on housing repairs or reconstruction after annual
floods and storms (Norton and Chantry, 2008). In many cases, this causes a downward spiral into pov-
erty because households borrow more money than they can afford from friends, relatives, or neigh-
bors, which results in further debt. In addition, without technical guidance related to storm
resistant construction techniques (see CECI, 2003), they reconstruct their homes using the same con-
struction principles, thus reproducing vulnerabilities.
In Vietnam after the Reform (Ðổimới) policy in 1986, households began to use new materials
(cement blocks, steel bars, fired bricks, or corrugated sheeting) in their housing construction instead
of traditional materials (timber, bamboo; (Norton and Chantry, 2008) but frequently without safety-
related measures (Tinh et al., 2011). This failure has generated a so-called twofold source of vulnera-
bility (Norton and Chantry, 2008). Over 70% of houses built during this period did not incorporate
typhoon resistant features; flat roofs were constructed, limited attachments between building ele-
ments were implemented, and structural bracings were lacking (Norton and Chantry, 2008). In addi-
tion, houses in low-lying areas lack flood protection features; for example, they lack upper floors for
safekeeping valuables during floods or have hard and heavy roofs that are difficult to open for escape.
Literature review shows that there are not many studies done in the field of climate resilient hous-
ing regarding economic dimensions. Pompe and Rinehart (2008) addressed the link between hurricane
resistant construction and the role of the insurance system, where appropriate insurance measures
could reduce people’s vulnerabilities to disasters. Sutter et al. (2009) talked about the reduction of
1
A storm with a wind speed of 118 kph (Category 12 on the Beaufort scale) is called a typhoon.
86 T.H. Tuan et al. /Urban Climate 12 (2015) 85–103
insured losses by applying disaster-mitigating measures in fragile buildings. Their studies found a
positive net present value of safe construction in high-risk areas to natural disasters. However, there
is an absence of the clear assumptions used for the economic return of utilizing climate resilient strat-
egies. Thomas et al. (2010) conducted a study of Vietnam related to analyzing the impact of natural
disasters on household welfare.
In the area of cost-benefit analysis (CBA), Pearce et al. (2006) published a book of CBA with a focus
on the calculation of losses and gains from an event or intervention. A more comprehensive approach
is discussed in Boardman et al. (2011). Their approach is helpful in that it provides a tool to estimate
and compare costs and benefits before moving forward with decision making. With regard to applying
CBA in disaster risk management, several papers have addressed and evaluated the economic effi-
ciency of different disaster risk interventions (Hochrainer et al., 2011; Kull et al., 2013; Mechler,
2005; Moench et al., 2009). However, none of these studies addressed typhoon resilient housing as
an intervention strategy for disaster risk management.
This paper investigates the economic return of typhoon resilient housing in Da Nang city, Vietnam.
It is structured as follows. Section three highlights the study site, typhoon hazards, past impacts in the
study site, and sampling framework for the household survey. Section four identifies typhoon resilient
housing for CBA and its associated costs and benefits, provides analysis frameworks, and details
related key assumptions. Section five discusses CBA results, scope, and limitations. Finally, section
six presents conclusions and policy implications.
3. The study site
3.1. Da Nang city
Located on the South Central Coast and on the tropical storm bell, Da Nang city experiences the
largest annual catastrophes in Vietnam. Da Nang is characterized by aslope topography from west
to east, with many mountainous ranges, short rivers, deltas, and coastal areas, which create a diver-
sified ecosystem and perhaps one of the most disaster prone regions in Vietnam (ACCCRN, 2010).
Da Nang is the most dynamically developed city in Central Vietnam, where both economic devel-
opment and urbanization are occurring rapidly. The city’s gross domestic product is the highest in the
country at just over 11% in recent years (Cu, 2008). The population of the city is nearly 1 million, with
the average density at 721 persons per square kilometer. The annual population growth rate in Da
Nang is 3.48%, with the population expected to reach 1.2 million in 2020 and 1.5 million in 2030. This
uncontrolled population boom along with a high rate of unemployment are big challenges in Da Nang
that contribute to an increase in climate risks and vulnerability (Da Nang UPI, 2012).
3.2. Typhoon hazards and impacts in Da Nang
Surrounded by mountains, Da Nang is not only prone to the effects of typhoons but is also at risk
from floods. These challenges, together with other natural hazards such as drought, high tides, coastal
erosion, salinization, and landslides, are major concerns for city residents and local authorities and are
likely to be exacerbated by climate change (ACCCRN, 2010). Of these natural hazards, the most dan-
gerous climate hazard in Da Nang is typhoons. From 1997 to 2011, there were 25 typhoons and 39
floods, which killed 206 people, injured thousands, and caused 15,410 houses to collapse (Da Nang
CFSC, 2012).
Global climate change contributes to higher intensity typhoons (IMHEN, 2013). It is assumed that
typhoon trends will become more abnormal and unpredictable. Approximately 40% of households in
Da Nang are affected when a typhoon occurs. Those most affected are people living in coastal areas,
particularly the poor, women, and children. Other highly impacted groups are fishermen and farmers
(ACCCRN, 2010; Da Nang People’s Committee, 2011).
Housing damage is not only caused by climate hazards, but also by inappropriate housing solutions
and poor construction techniques. There are several barriers to safe housing construction in Da Nang,
including the additional costs of disaster resistant measures; limited awareness by home owners;
T.H. Tuan et al. /Urban Climate 12 (2015) 85–103
87
social pressures on owners to build more rooms or more living space for larger families; limited finan-
cial capacity or insufficient money to build; and limited professional and technical assistance in
typhoon resistant housing. Adverse effects of existing patterns of typhoons already greatly impact
the housing sector and local livelihoods; such impacts will worsen as climate change makes the area
more vulnerable.
3.3. Damage by typhoons Xangsane (2006) and Ketsana (2009) in study wards
Xangsane was the strongest typhoon to hit Da Nang city in 40 years. More than 15,000 people were
evacuated to safe havens such as schools, hospitals, and government offices. In total, there were
14,138 totally collapsed houses and 107,962 unroofed and badly ruined houses (Da Nang CFSC,
2012). Typhoon Ketsana hit Da Nang on October 2, 2009, with storm winds that reached a 9-to-10
magnitude. According to city statistics, there were 283 totally collapsed houses and 6396 unroofed
and ruined houses (Da Nang CFSC, 2012).
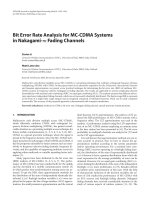
Fig. 1 shows the study area locations of the surveyed households. In order to select study wards
that are representative of the city in terms of vulnerability to typhoons, several shared learning dia-
logues (SLDs) with local authorities and experts were organized in Da Nang city. Based on the SLDs’
results, three wards were selected for household surveys to collect information about housing damage
due to the 2006 and 2009 typhoons: Man Thai (Son Tra district), Hoa Quy (Ngu Hanh Son district), and
Hoa Hiep Bac (Lien Chieu district). Hoa Hiep Bac and Man Thai are representative of wards located in
coastal areas, which were directly impacted by typhoon winds. Hoa Quy is located in a low-lying area
of Da Nang city, which is often affected by typhoons and floods.
For these selected wards, damage to houses caused by typhoons Xangsane and Ketsana are
reported in Table 1.
Fig. 1. Map of Da Nang city and the study wards. Source: ISET-international, based on Da Nang Department of Construction’s
geographical information system database.
88 T.H. Tuan et al. /Urban Climate 12 (2015) 85–103
Figures from Table 1 reveal that housing damage caused by typhoon Ketsana was significantly less
as compared to housing damage caused by Xangsane.
There are several reasons explaining for this difference. The first reason is due to the 2006 typhoon
is significant stronger than that of the 2009 event (i.e. the typhoon in 2006 with Category 11 to 12 on
the Beaufort scale vs. Category 9 to 10 for the 2009 event). The second reason is due to fast economic
growth in local economy and households have more resources for investing in housing construction.
The third reason is that local people have experienced significant damage during the 2006 event, thus
they become more aware of the importance of building houses using typhoon resistant techniques.
Since Xangsane in 2006, local communities in Da Nang have become more aware of the importance
of building houses using typhoon resistant techniques. In effect, autonomous adaptation has occurred.
However, poor and lower income households are not necessarily adapting autonomously without
incentives from the government.
3.4. Sampling framework for the household survey
Based on the secondary data on households’ damage by the 2006 Xangsane and 2009 Ketsana
typhoons, 120 households were selected in the study wards for the final household survey sample.
Based on the literature review and focus group discussions (i.e., SLDs), questionnaires were
designed and pre-tested with 20 households in order to guarantee that all questions were answerable
and all information was available to respondents. The questionnaire included four main sections. The
first section was designed to collect demographic information and household economic condition of
respondents. The second section was developed to collect the current status of house and household’s
fragility. The third section was developed with questions related to household’s impacts and damages
due to past typhoon events. The fourth section was used to collect information about typhoon knowl-
edge and response.
In the final survey, 98 questionnaires were completed with face-to-face interviews conducted dur-
ing May and June of 2013. The distribution of household samples followed the sampling design
(Table 2), and households that participated in the final survey were randomly selected in the study
areas based on the list of households affected by the Xangsane (2006) and Ketsana (2009) typhoons.
To increase the validity and accuracy of the data collected, 10 percent of completed questionnaires
were randomly selected for doing re-interviews and cross-checks. The questionnaires completed each
day were carefully checked to make sure that information was recorded in the correct manner. Finally,
these questionnaires were entered in data analysis software for data cleaning and analysis.
It is noted that this household survey contained at least two important limitations. The first limi-
tation was that the respondents may have thought they could influence policy in favor of resilience by
overstating the damage costs. The second limitation was the issue of recall bias because information
Table 1
Damage by typhoons Xangsane and Ketsana in study wards.
Housing damage Hoa Quy Man Thai Hoa Hiep Bac
Damage by typhoon Xangsane in 2006
Number of houses totally collapsed 50 184 720
Number of houses with roof totally blown 236 584 658
Number of houses partly collapsed 73 –
a
50
Number of houses with roof partly blown 1780 1107 1203
Damage by typhoon Ketsana in 2009
Number of houses totally collapsed 6 1 6
Number of houses with roof totally blown 28 7 156
Number of houses partly collapsed 14 3 –
b
Number of houses with roof partly blown 135 83 393
Note: Figures were pulled from Hoa Quy, Man Thai, and Hoa Hiep Bac wards’ reports on socio-economics.
a
The number of houses partly collapsed and the number of houses with roof totally blown by typhoon Xangsane in Man Thai
ward were not provided as separate figures.
b
The number of houses partly collapsed and the number of houses with roof totally blown by typhoon Ketsana in Hoa Hiep
Bac ward were not provided as separate figures.
T.H. Tuan et al. /Urban Climate 12 (2015) 85–103
89
about household’s damages and losses were occurred several years in the past. To reduce these biases,
during the interview we cross-checked their reported damage data against secondary damage data
provided by the local authorities.
3.5. Estimation of total damage per household
The household survey aimed to collect direct and indirect loss information.
2
Direct monetary losses
included the structural and asset damages incurred by the household due to the typhoon. Indirect mon-
etary losses included those costs that were incurred due to the disaster, but did not include damaged
items. These costs included the number of working days lost due to spending time on repairing or recon-
structing homes or temporarily staying in other houses; fees paid for medical treatment for injured peo-
ple, if any; and the cost of hiring local builders and purchasing materials for housing repairs or
reconstruction (see Table 3).
Average household damage estimates due to typhoons Xangsane in 2006 and Ketsana in 2009 are
reported in Table 4. Total damage per household is VND 42,812
3
million and VND 35,382 million for
Xangsane and Ketsana, respectively. These were the damage figures in 2006 and 2009. However, in order
to take into account the inflation of past years, it is reasonable to convert these figures using yearly infla-
tion rates (CIA World Fact Book, 2011). The total damages in 2012 figures are reported in column 3 of
Table 4.
Results of the household survey show that the floor space of a typical house in 2006 was about
50 m
2
but was 81 m
2
in 2012 as living standards in the study site have improved over time. The figures
have been adjusted to a standard house in 2012, as shown in column 4 of Table 4.
Table 2
Sampling of the household survey by typhoons and wards.
Typhoon Ward Total
Hoa Quy Man Thai Hoa Hiep Bac
Xangsane, 2006 7 15 38 60
Ketsana, 2009 9 23 6 38
Total 16 38 44 98
Note: Data based on 2013 survey of 98 households.
Table 4
Total damage per house (in units of VND 1000).
Typhoon Total damage Total damage in 2012 Total damage per standardized house
Xangsane, 2006 42,812.16 74,701.10 121,015.79
Ketsana, 2009 35,382.18 60,167.40 85,437.70
2
This study does not include certain types of costs, such as the cost of deaths or injuries or the cost of social disruptions within a
group or community. Typhoons lead to critical social disruptions, human causalities, and so forth, but due to the difficulty of
quantifying these economic costs, the study does not include them in the overall analysis.
Table 3
Quantifiable disaster impacts in monetary terms.
Direct Indirect
Housing partially damaged or totally destroyed Working days lost
Evacuation costs
Household assets damaged Health and medical fees
Cost of hiring local builders
Cost of purchasing materials for housing repair or reconstruction
3
The exchange rate is VND20.080/US$1.
90 T.H. Tuan et al. /Urban Climate 12 (2015) 85–103
4. Cost-benefit analysis
Cost-benefit analysis (CBA) is an established tool for determining the economic efficiency of devel-
opment interventions. CBA compares the costs of conducting such projects with their benefits and cal-
culates the net benefits, or economic efficiency (Kull et al., 2013).
4.1. Identification of typhoon resilient housing for CBA and Its associated costs and benefits
To apply CBA for typhoon resilient housing, it is necessary to define what forms of resilient housing
can be used for CBA. To do this, this study uses the results of the architectural housing design compe-
tition (details of the design competition’s results can be found in Anh and Phong, 2013; Thang et al.,
2013). Objectives of the design competition are to identify housing design elements that will signifi-
cantly reduce current typhoon and intermediate-term (30 years) climate risk.
Main characteristics of typhoon resilient housing include (i) Interconnection of all key structural
components in the house structure; (ii) Anchoring of roofing materials, particularly lighter ones made
of corrugated iron with roof angles designed to deflect wind and reduced eves; (iii) Increasing wall
thickness from the 10 cm common in low-income housing to a minimum of 15 cm (25 cm being stan-
dard in housing constructed for more wealthy residents) with air pockets to improve thermal perfor-
mance; (iv) Inclusion of a reinforced concrete ring beam at window level – mid way up most walls; (v)
Strategic placement of concrete pillars to strengthen walls; (vi) Establishment of safe rooms within
houses in case walls fail; and (vii) Avoidance of courtyards, verandas, setback entryways and other
features that concentrate wind pressures differentially.
4.1.1. Assessment of benefits
In a conventional CBA of investment projects, benefits are the additional outcomes generated by
the intervention project (e.g., resilient housing measures) as compared with the situation without
the project. In the disaster risk reduction case, benefits are the risks that are reduced or avoided
(Mechler, 2005). Benefits of resilient housing measures are defined as the avoided damage and loss
or the accrued benefits following the adoption and implementation of resilient housing measures.
Avoided damage (benefits) is the difference in damages and losses under two circumstances: with
and without undertaking the resilient housing measures.
It is noted that this study does not include certain types of costs, such as the cost of deaths or inju-
ries or the cost of social disruptions within a group or community. Typhoons lead to critical social dis-
ruptions, human causalities, and so forth, but due to the difficulty of quantifying these economic costs,
the study does not include them in the overall analysis.
In addition, as mentioned by some focus group discussion’s participants that the most benefit of a
resilient house is adding peace of mind during the typhoon season; building a resilience house could
also bring in some socio-economic benefits to the owner such as he/she is proud of new house and
easier to access credits and loans. These benefits can be considered as non-monetary ones and difficult
to measure. This study mainly focuses on financial benefits of resilient house.
4.1.2. Assessment of costs
Associated costs of a resilient house include (1) major investment cost for building a resilient house
(construction cost) and (2) operation and maintenance expenses for the house incurred over time
(O&M cost). The study focuses on the extra costs incurred by a standard non-storm-resistant house
as compared to a storm resistant house.
Finally, economic efficiency is assessed by comparing benefits and costs. Three economic instru-
ments were used to measure the overall economic returns to resilient housing. They include (1) net
present value (NPV), (2) benefit-cost ratio (BCR), and (3) internal rate of return (IRR).
4
4
For further explanation of these terms, see Appendix C.
T.H. Tuan et al. /Urban Climate 12 (2015) 85–103
91
4.2. Analysis frameworks
In this study, a combined backward- and forward-looking approach for cost-benefit analysis was
applied to assess current and future typhoon risk. Review of past typhoon impacts provided estimates
for current risk, while projected climate and exposure changes were used to estimate risk for the per-
iod 2012 to 2030.
4.2.1. Backward-looking analysis
Typhoon damage and loss due to the 2006 Xangsane and 2009 Ketsana typhoons were estimated
using household surveys. The household surveys yielded direct loss information (direct damage) and
indirect loss information (indirect damage) for housing, as seen in Table 3. As cost-benefit analysis
must be performed under present conditions, losses (damages) from past typhoons in 2006 and
2009 were adapted to present conditions using yearly inflation rates as an adjustment factor to con-
vert these amounts into 2012 Vietnamese Dong (VND). By utilizing this backward-looking approach,
we are able to identify what damages an average household experienced in both the 2006 and 2009
typhoons and use this information to build the forward-looking analysis.
4.2.2. Forward-looking analysis
The present value of the benefits from resilient housing are likely to be highly sensitive to the
expected timing of the typhoon events that would cause damage, yet these typhoon events are sto-
chastic, or random to climate change. The results of typhoon modeling are, so far, mixed at best. Thus,
it is not possible to add probabilities to different intensities of typhoons. Moreover, the damage caused
is related to the wind speed and direction, and it is difficult to correlate wind speed, damages, and
return periods for typhoons (see Khan et al., 2012). Therefore, the study utilized a scenarios approach
to investigate the future economic impacts of typhoons in Da Nang city. Specifically, the research
investigated two scenarios: (1) Without climate change and (2) With climate change.
4.2.2.1. Without climate change. In this scenario, climate stays generally the same. This implies that the
frequency and intensity of typhoons in the next 25 years will be similar to the frequency and intensity
of typhoons over the past 25 years.
5
In other words, the 2006 Xangsane and 2009 Ketsana typhoons will
be repeated once each over the next 25 years.
4.2.2.2. With climate change. This scenario is based on the assumption that in the future fewer but
more intense typhoons will likely occur in the region, as suggested by IMHEN (2013). More intensity
may lead to greater damage.
6
In this regard, we assume that two typhoons like the 2006 Xangsane
typhoon will happen in the next 25 years. Using this assumption, we recalculate the avoided damages
and estimate benefit-cost ratios, and compare the results with the ‘‘Without Climate Change” scenario.
Each climate scenario is then run with typhoon events occurring at different time periods over the
lifetime of the house. This ensures a complete view of what the overall economic returns will be in a
range of occurrences and extreme cases. The first run was chosen with the assumption that there is
equal probability that any of these events could occur over the lifetime of the house. Hence, this is
a simplistic Monte Carlo simulation in which the past is represented in the future evenly distributing
the benefits over the lifetime of the house. In effect, the probability of the event happening in any year
is equal. However, in reality events do not occur in that manner (Dobes, 2010). Whether they happen
earlier or later in the life of the investment has a big impact on the returns to the risk reduction invest-
ment.
7
To show the ranges of potential returns, extreme scenarios were chosen for the beginning of the
project or the end of the project, resulting in a range of benefit-cost ratios, as might be expected.
5
This is a conservative assumption as the fact is that there are many typhoons that happened in Da Nang in the last 25 years, but
these two typhoons are happened in recent years with significant damage to communities in Da Nang. For example, during the
period between 1976 and 2011 (36 years), there have been 59 storms and tropical low pressure storms that affect Da Nang, or
about 1.6 storms and tropical low pressure storms occurring annually (Da Nang Hydro-Meteorological Station, 2012).
6
This is not a linear relationship.
7
Any loss that happens later in the life of the investment accounts for a small benefit.
92 T.H. Tuan et al. /Urban Climate 12 (2015) 85–103
4.3. Key assumptions
Review of the risk analysis has identified a number of key assumptions driving the cost-benefit
analysis design and results, as summarized in Table 5.
8
4.4. Sensitivity analysis
A sensitivity analysis was performed on a range of discount rates due to the fact that these rates
often vary among institutions and by year.
In economic calculations, future benefits are discounted in relation to current benefits to reflect the
cost of capital. This is justified on the assumption that the current value of future benefits from invest-
ments should be compared to existing, secure investment alternatives for the same funds. Applying
high discount rates expresses a strong preference for the present while potentially shifting large bur-
dens to future generations. Standard practice in developing countries is to assume a discount rate of
10–12%. In this study, the discount rate of 10% is the common base for a CBA study, as widely cited in
the existing literature (Truong, 2011; Tuan and Navrud, 2008).
A range of discount rates from 5% to 15% was used for the sensitivity analysis. The discount rate of
5% was used because housing is a social welfare development program, with its effect mainly seen in
the long term. The discount rate of 15% was used to describe a context of economic crisis.
5. Results and discussions
5.1. The CBA’s results
In this section, the CBA (measured by NPV, IRR, and BCR) is assessed and the results compared.
5.1.1. Scenario 1: Without climate change
With this assumption, the NPV, IRR, and BCR are calculated using typhoon events occurring at dif-
ferent time periods over the lifetime of the house.
The first option (i.e., the base case) was chosen with the assumption that there is equal probability
that either of these two typhoon events could occur over the lifetime of the house (i.e., the probability
of an event happening in any year is equal). Results of the base case (reported in Table 6) show that
NPV is >0, BCR is >1, and IRR is >10% (i.e., market discount rate). This implies that the economic return
on investment in typhoon resilient housing is desirable. It should be noted that this is a conservative
result/estimate based on the assumption that only two typhoons occurred in the past 25 years.
9
Table 5
Key assumptions driving the cost-benefit analysis.
Assumption Value Notes (sources)
Construction costs per
house
68,937.11
(VND 1000)
Additional cost of resilient housing; cost of resilient housing minus cost of
nonresilient housing per house (calculation based on the results of housing
design competition)
Lifetime of house 25 years Using market rate based on market lending rate in 2012
Discount rate 10% Market discount rate in 2012
Annual asset growth 2.46% per
year
Annual increase in exposure of household assets (authors’ calculation)
Operation and
maintenance (O&M)
costs
2% per
5 years
An increase in additional cost for housing resilience; occurs every 5 years
Economic depreciation 2757.48
(VND 1000)
Straight line economic depreciation method used; this refers to the allocation
of the cost of housing assets to periods in which the assets are used (not the
decrease in value of assets)
8
For further details, see Appendix C.
9
As discussed in footnote 3, many more typhoons have occurred in the past 25 years.
T.H. Tuan et al. /Urban Climate 12 (2015) 85–103
93
Results show that if the typhoons happen very early in the project lifetime (particularly if the 2006
event happens in year 1 and the 2009 event happens in year 3
10
), the returns are optimal (the best
case). Conversely, if the typhoons happen very late in the project lifetime (the 2006 event happens in
year 25 and the 2009 event happens in year 23), the results are the worst (the worst case). This implies
that any loss happening later in the lifetime of the investment has a small benefit.
In the base case, the results shows that IRR equals 14% (i.e., higher than the market discount rate of
10%), which implies that it is preferable to invest in resilient housing rather than the bank. The best
case takes place when the typhoons happen very early in the project lifetime, and this seems to be
somewhat reflected by recent typhoon Nari,
11
which struck Da Nang in mid-October 2013.
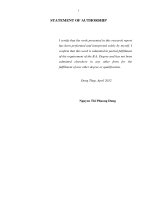
It is critical to investigate at what point during the lifetime of the house the turning point or break-
even point occurs (break-even case: from a positive NPV to a negative one). The analysis results show
that the break-even case occurs if the 2006 event happens in year 16 and the 2009 event happens in
year 18 (see Fig. 2). This means that if the 2006 event occurs after year 17 and the 2009 event occurs
after year 19 of the project lifetime, the NPV becomes negative.
Varying interest rates were used to test the sensitivity of the results. Fig. 3 shows the full range,
from interest rate equals 5% to interest rate equals 15%; BCR results range from 2.99 to 1.38,
respectively.
5.1.2. Scenario 2: With climate change
As stated earlier, the ‘‘With Climate Change” scenario increases the amount of damage that occurs
over the lifetime of the house. In other words, we assume that the 2006 typhoon (Category 12) may
occur twice in the next 25 years.
12
The return on investment in typhoon resilient housing is reported in
Table 7.
Results of Scenario 2 show that the base case IRR is 20% (compared to 14% in Scenario 1), the BCRs
for the sensitivity analysis range from 3.65 to 1.69 as seen in Fig. 4 (compared to 2.99 to 1.38 in
Table 6
Calculation of the economic return without climate change.
Base case Best case Worst case
NPV (VND 1000) 66,069.35 152,941.30 À35,218.32
NPV (US$) 3290.31 7616.60 À1753.90
IRR (%) 14 132 5
BCR 1.93 3.15 0.50
10
We assume that it takes 1 year for housing reconstruction.
11
Typhoon Nari (typhoon No. 11) hit Da Nang city at midnight on October 14, 2013, with level 12 winds and level 13 gusts,
equivalent to 130 km/h.
(50,000)
0
50,000
1,00,000
1,50,000
2,00,000
0
5 10 15 20 25
N
P
V
Years
NPV
Fig. 2. The break-even case.
12
Again, this is a conservative assumption.
94 T.H. Tuan et al. /Urban Climate 12 (2015) 85–103
Scenario 1), and the break-even case occurs in years 19 and 21 of the housing lifetime. In other words,
the returns of Scenario 2 are higher than the returns of Scenario 1. This implies that taking into
account the impact of climate change would result in higher returns on investment.
5.2. Scope and limitations
This paper has some limitations in providing a fully integrated CBA. These include:
exclusion of small storms from the analysis,
exclusion of nonmonetary losses,
exclusion of the role of multiple hazards,
typhoon intensity thresholds of only Category 12,
housing cost variations, and
uncertainty of the investment’s return.
2.99
2.71
2.47
2.27
2.09
1.93
1.79
1.67
1.56
1.47
1.38
-
0.50
1.00
1.50
2.00
2.50
3.00
3.50
0% 2% 4% 6% 8% 10% 12% 14% 16%
BCR
Fig. 3. BCRs with different interest rates (Scenario 1).
Table 7
Calculation of the economic return with climate change.
Base case Best case Worst case
NPV (VND 1000) 96,452.11 200,532.32 À28,144.22
NPV (US$) 4803.39 9986.67 À1401.60
IRR (%) 20 145 6
BCR 2.36 3.82 0.60
3.65
3.31
3.02
2.77
2.55
2.36
2.19
2.04
1.91
1.80
1.69
0
0.5
1
1.5
2
2.5
3
3.5
4
0% 2% 4% 6% 8% 10% 12% 14% 16%
BCR
Fig. 4. BCRs with different interest rates (Scenario 2).
T.H. Tuan et al. /Urban Climate 12 (2015) 85–103
95
5.2.1. Exclusion of small storms from the analysis
Many storms have hit Da Nang in the past 25 years, but only two typhoons (Xangsane in 2006 and
Ketsana in 2009) were used in the analysis. The reason is that these two typhoons were the largest in
the past quarter century, causing significant damage to housing in the city. Other smaller, more fre-
quent storms were not considered because these smaller events often do not harm housing stocks
significantly.
5.2.2. Exclusion of intangible costs
For the quantitative CBA—that is, the estimation of damage cost per household (which is
considered the benefits of the resilient house)—the study did not include intangible costs, such as cost
of social disruptions within a group or community. The destruction of many houses in a community is
likely to lead to critical social disruptions, where social relations among community members and
local cultural values are threatened or demolished. Another form of intangible costs are the human
casualties caused by typhoons. This also qualifies as a terrible loss to families but is very difficult
to convert into economic costs. As this study is intended to deal with the economic aspects of
typhoon resilient housing, the damages that can be converted into economic costs have been
included while psychological issues such as trauma, peace of mind, and safety concerns were not
taken into account in the quantitative CBA. Furthermore, environmental benefits were also not taken
into consideration.
5.2.3. Exclusion of multiple hazards
This study has the limitations of single-hazard analyses (i.e., typhoon and typhoon-associated
floods). If it took into account the issue of multiple hazards such as floods, droughts, and earthquakes,
the costs might increase significantly.
5.2.4. Issue of intensity thresholds
The housing design competition limited the capacity of typhoon resilient housing to a typhoon
intensity of level 12 on the Beaufort scale (about 120 km h). This means that this type of housing
may not be resilient if there are typhoons of stronger intensity
13
in the future.
5.2.5. The cost of typhoon resilient housing is case specific
The cost of typhoon resilient housing was estimated based on the winning model in the architec-
tural design competition and is, therefore, case specific. Even though this housing model was consid-
ered the best representative of typhoon resilient housing for Da Nang city, the costs associated with
this housing model could vary depending on the quality of materials, design features, floor area of
the house, and so forth. In reality, local people may build a larger or smaller house, use a different
quality of materials, employ different design features, and so forth.
5.2.6. The return on investment is uncertain
Due to variations in housing design features, degree of typhoon intensity, discount rates used, and
future climate uncertainty, the return on investment in typhoon resilient housing carries high uncer-
tainty, which may limit the accuracy of research results.
6. Conclusions and policy implications
6.1. Conclusions
Da Nang, located in Central Vietnam, is experiencing rapid development in locations that are highly
vulnerable to flooding and particularly the impact of typhoons. The city experienced a strong typhoon
in 2006 when typhoon Xangsane made landfall in Da Nang, causing devastating damage and losses to
13
An example of this would be if super-typhoon Haiyan had made landfall in Da Nang.
96 T.H. Tuan et al. /Urban Climate 12 (2015) 85–103
local communities and destroying thousands of houses. Projections concerning climate change by the
government authority suggest that typhoon intensity is likely to increase in the Da Nang area (IMHEN,
2013). In addition, the city frequently experiences floods, and it is projected that climate change will
intensify flood risk in the future (Opitz-Stapleton and Hawley, 2013), as the city’s growth and settle-
ment tend to occur in low-lying areas.
Housing construction in Da Nang has undergone great changes as a result of economic improve-
ment in recent years, with more durable and costly materials being used in housing repair and con-
struction instead of traditional materials. However, a lack of guidance and instruction from
professionals and authorities has resulted in housing that is more vulnerable to flooding and
typhoons.
Results of the quantitative CBA show that the returns on investment in typhoon resilient
housing are high in most scenarios, meaning that investment in typhoon housing is economically
viable. Yet, the question exists about why households are not choosing to make this investment
when returns exist. Through this research it became clear that asymmetric information exists with
innovation that one agent (the household) in this transaction does not have complete information
available to them and cannot acquire that information. Therefore, market failure is occurring. To
adjust the market failure, we explore policy implications for individual households and public
sector interventions.
6.2. Policy implications
This study investigated typhoon resilient housing measures that are being undertaken by individ-
ual households. Thus, we first examine what these results imply for local people living in typhoon-
prone areas of Da Nang city. Then we turn to the implications for public sector interventions.
6.2.1. Implications for individual households
The returns on typhoon resilient housing investments are positive and high, implying that local
households prioritize this investment. However, it should be emphasized that positive returns are a
necessary but not sufficient condition to justify investment in typhoon resilient housing. Individual
households have budget constraints, and the additional cost of building a typhoon resilient house
instead of a traditional house causes local households not to make that investment.
In addition, as pointed out by Kunreuther et al. (2010), people with low incomes are myopic
given that they often face extremely pressing and immediate problems that limit their capacity to
invest in typhoon resilient housing. However, these barriers create policy opportunities, as discussed
below.
6.2.2. Implications for public policy
6.2.2.1. Encouraging individual investment. The quantitative CBA results show that typhoon resilient
housing exhibits high benefit-cost ratios. In order to encourage individual investment in typhoon
resilient housing, the government should consider offering assistance to households that agree to
undertake appropriate climate resilient housing measures. This may take the form of technical assis-
tance, direct subsidies, or low-interest loans.
For example, in 2012 the government approved the pilot program for flood resilient housing for
poor households in 14 provinces in North Central Vietnam, including Da Nang (Degree 716). In this
pilot program, 40,000 households will be directly supported with cash (about VND 10–12 million)
as well as a loan with a low interest rate (VND 15 million) per household. However, this program
did not take into account typhoon resilience, and it is essential to include the issue of typhoon resil-
ience in this program in order to increase housing resilience for the poor.
6.2.2.2. Micro-insurance policy. Micro-insurance mechanisms have been viewed as an efficient and reli-
able risk management tool for encouraging households in developing countries to adopt disaster risk
reduction measures (Linnerooth-Bayer et al., 2012; World Bank, 2012). Index-based disaster insurance
plans, such as those for flood and drought, have been widely applied in low-income countries (World
Bank, 2012), but typhoon insurance is still new.
T.H. Tuan et al. /Urban Climate 12 (2015) 85–103
97
Typhoon insurance policies were pioneered in the Philippines in 2009 to protect Filipino farmers
against typhoon-related losses (IFC, 2013). This would seem to have relevant application for Central
Vietnam where several typhoons hit the region every year. Vietnam has created a subsidized pub-
lic–private partnership for agricultural crop, livestock, poultry, and aquaculture insurance, which
the government promoted by providing premium subsidies from 2011 to 2013 (World Bank, 2012).
Therefore, for future disaster risk reduction, typhoon insurance policies could be an appropriate
option.
6.2.2.3. Adoption of multi-hazard resilient construction. Results from current climate projections
(IMHEN, 2013) show that fewer but more intense typhoons will impact Vietnam in the future.
Typhoons like Xangsane will occur again and may be even stronger,
14
causing significant damage
if people are not prepared. Furthermore, flood models show that climate change will increase the
severity of flooding in Da Nang in the future Opitz-Stapleton and Hawley (2013). It is therefore
important that housing construction adopts multi-hazard resilience measures and that houses offer
homeowners a safe place to store assets. Investment in public projects for disaster risk reduction,
such as public shelters or improved early warning systems, can also help local people protect their
assets and their lives.
6.2.2.4. Improving awareness of at-risk communities and stimulating the local economy. Social issues
uncovered during the focus group discussions support the idea that climate risk reduction efforts
need to go beyond the physical aspects and include social enhancements such as raising local
awareness and sustaining the local economy. For low-income groups, disaster preparedness is not
as important as meeting the basic needs of living. For medium- and high-income groups, fashionable
construction focused on decorative details is preferred over safe construction (Anh and Phong,
2013). Adequate economic resources are needed to allow people to build resilient housing and plan
for long-term development, and homeowners need better information about resilient housing
options and their benefits.
6.2.2.5. Bridging the gap between at-risk groups and in-field professionals. Vulnerable communities in
the study, such as the poor and low-income groups, experience economic constraints that hinder
accessibility to professional services for better housing design and construction. Recent literature is
increasingly concerned with the role of construction professionals in DRR, as professional expertise
and skills are needed to assist at-risk communities in coping with future disasters (Anh and Phong,
2013). Mutual and interactive learning and sharing processes among at-risk people and
communities and in-field professionals are essential to achieve better communication.
6.2.2.6. Applying safety-related codes and criteria to local construction. Results from the focus group
discussions suggest that building codes and zoning/planning criteria for climate risk reduction
are still lacking in hazard-prone areas. Current governance mechanisms for civil construction tends
to focus on urban districts, with limited consideration for peri-urban and rural areas—places that
are, in fact, more vulnerable to climate risks. Improving local construction practices through the
application of safety-related regulations (in the form of building permits) would help to create
an enabling environment for resilience and enforce a resilient housing system in Vietnam into
the future.
14
For example, super-typhoon Haiyan (which reached Beaufort level 17) was forecasted to approach Central Vietnam in
November 2013.
98 T.H. Tuan et al. /Urban Climate 12 (2015) 85–103
Appendix A
A.1. Estimated costs of a non-resilient house (81 m
2
, 2012 price)
STT Name of works Amount (VND)
Materials Labor Machine Total
1 Excavation columns, pillars, pits large 6 1m,
depth 6 1 m, C3 land
0 5298 0 5298
2 Excavation broad band 6 3, depth 6 1 m, C3 land 0 2870 0 2870
3 Concrete foundation, width 6 250 cm, 1 Â 2M200
stone-drop 2–4 cm
2528 946 50 3524
4 Concrete foundation, stone 1 Â 2M150-drop
2–4 cm
5001 1972 94 7068
5 Concrete floor beams, bracing, roof deck,
high 6 4m,1Â 2M200 stone-a slump of 6–8 cm
4712 2924 136 7772
6 Concrete columns, column size 6 0, 1 m
2
,
height 6 4m,1Â 2M200 stone-a slump of
6–8 cm
460 363 15 839
7 Straight brick walls(6, 5 Â 10, 5 Â 22),
thickness 6 33 cm, height 6 4 m, fine
sandVXMM50-magnitude ML = 1.5–2.0
19,548 5644 27 25,220
8 Building layout 10 Â 20 Â 40, thickness 6 30 cm,
sandVXMM50-magnitude, ML = 1.5–2.0
3058 1793 0 4851
9 Production of steel purlins 16,119 1252 0 17370
10 Roofing, corrugated metal wall covering
length 6 2m
11,399 1075 0 12,474
11 Plastering outside walls, 1.5 cm thick, mortar
cement grade 75
2479 15,003 43 17,525
12 Flooring, ceramic floor tile, 400 Â 400 mm 5838 2115 68 0
13 Reinforced foundation, reinforcement
diameter 6 10 mm
1442 192 3 8022
14 Reinforced foundation, reinforcement
diameter 6 18 mm
1279 123 41 1637
15 Reinforced columns, reinforced cylinder
diameter 6 10 mm, height 6 4m
1040 182 2 1443
16 Reinforced columns, reinforced cylinder
diameter 6 18 mm, height 6 4m
3701 429 123 1224
17 Reinforcement steel floor beams, bracing rebar
diameter 6 10 mm, height 6 4m
2012 383 4 4253
18 Reinforcement steel floor beams, bracing rebar
diameter 6 18 mm, height 6 4m
5763 669 187 2400
19 Reinforced roof deck, reinforcement
diameter 6 10 mm, height 6 16 m
2129 366 4 6620
Total 88,507 43,602 800 130,409
T.H. Tuan et al. /Urban Climate 12 (2015) 85–103
99
Appendix B. Estimated costs of a resilient house (tube house model – corrugated iron sheets for
roof cover, 81 m
2
, 2012 price)
STT Name of works Amount (VND 1000)
Materials Labor Machine Total
1 Excavation columns, pillars, pits large 6 1m,
depth 6 1 m, C3 land
0 13,245 0 13,245
2 Excavation broadband 6 3, depth 6 1 m, C3 land 0 2870 0 2870
3 Concrete foundation, width 6 250 cm,
1 Â 2M200 stone-drop 2–4 cm
6319 2366 476 9161
4 Concrete foundation, stone 1 Â 2M150-drop 2–
4cm
5001 1972 399 7372
5 Concrete floor beams, bracing, roof deck,
high 6 4m,1Â 2M200 stone-a slump of 6–8 cm
4712 2924 723 8359
6 Concrete columns column size 6 0, 1 m
2
,
height 6 4m,1Â 2M200 stone-a slump of 6–
8cm
2422 1913 450 4785
7 Straight brick walls (6, 5 Â 10, 5 Â 22),
thickness 6 33 cm, height 6 4 m, fine sand
VXMM50-magnitude ML = 1.5–2.0
36,684 10,592 275 47,551
8 Building layout 10 Â 20 Â 40, thickness 6 30 cm,
sandVXMM50-magnitude, ML = 1.5–2.0
3058 1793 0 4851
9 Production of steel purlins 17,126 1330 0 18,456
10 Roofing, corrugated metal wall covering
length 6 2m
11,696 1104 0 12,800
11 Plastering outside walls, 1.5 cm thick, mortar
cement grade 75
2479 15,003 233 17,715
12 Flooring, ceramic floor tile 400 Â 400 mm 0 0 0 0
13 Reinforced foundation, reinforcement
diameter 6 10 mm
5838 2115 574 8528
14 Reinforced foundation, reinforcement
diameter 6 18 mm
3773 502 27 4302
15 Reinforced columns, reinforced cylinder
diameter 6 10 mm, height 6 4m
3410 329 180 3919
16 Reinforced columns, reinforced cylinder
diameter 6 18 mm, height 6 4m
2515 440 18 2973
17 Reinforcement, steel floor beams, bracing rebar
diameter 6 10 mm, height 6 4m
9380 1087 512 10,978
18 Reinforcement, steel floor beams, bracing rebar
diameter 6 18 mm, height 6 4m
503 96 4 602
19 Reinforced roof deck, reinforcement
diameter 6 10 mm, height 6 16 m
14,494 1683 774 16,951
Total 134,859 62,302 4685 201,846
Appendix C. Economic definitions
C.1. Construction cost
Construction costs the additional cost of resilient housing. This is the difference in the cost of
resilient housing and the cost of non-resilient housing with the same floor area and at 2012 prices.
100 T.H. Tuan et al. /Urban Climate 12 (2015) 85–103
Based on the results of the design competition, the costs of resilient housing and that of non-resilient
housing are calculated (see details in Appendices A and B).
C.2. Operation and maintenance (O&M) cost
Operations and maintenance occurs on average about every five years. The research team assumed
that 2% of total constructions costs equate to average operations and maintenance costs incurred by a
household.
C.3. Lifetime of house
25 years.
C.4. Discount rate
In economic calculations, future benefits are discounted in relation to current benefits to reflect the
cost of capital. This is justified on the assumption that the current value of future benefits from invest-
ments should be compared to existing, secure investment alternatives for the same funds. Applying
high discount rates expresses a strong preference for the present while potentially shifting large bur-
dens to future generations. Standard practice in developing countries is to assume a discount rate of
10–12%. In this study, we apply a 10% discount rate as the base case.
C.5. Depreciation
Housing depreciation refers to the allocation of the cost of housing assets to periods in which the
assets are used (not the decrease in the value of assets). Therefore, depreciation is considered as a
benefit to homeowners. For simplicity, housing depreciation is calculated using a straight-line depre-
ciation method: the additional resilient cost is divided by the lifetime of the house (25 years).
C.6. Annual asset growth
We make the assumption that annual asset growth equates with an annual increase in exposure
and losses. Due to a lack of data on annual asset growth, a proxy of household expenditure
15
is used.
According to the city’s household living standard surveys, the rate of household expenditure during the
period 2004–2012 increased 17.25% (or 2.46% per year on average).
C.7. Cost increase
Due to unforeseen price increases in labor and materials, one may assume that the cost of labor and
materials increases by the same rate as inflation (which is measured by the consumer price index).
However, this also goes in the benefits section (avoided damages). Therefore, cost increases on the cost
side and the benefit side cancel each other out (and are not taken into account).
C.8. Fragility decrease
The research team assumes that overall fragility of the house decreases over time due to increased
density of housing structures. As population increases so does housing density in urban areas. The new
houses create a denser environment (more structures) and reduce the potential damage experienced
by each household. On average total assets of households increase over time (resulting in an exposure
increase) while density of houses increase resulting in a fragility decrease. These two assumptions
cancel each other out and are not taken into consideration in the calculations.
15
Household expenditure includes the cost of food and education, housing expenses, and the purchase of durable goods (assets).
T.H. Tuan et al. /Urban Climate 12 (2015) 85–103
101
C.9. Year of typhoon occurrence
Due to limited certainty of climate models to predict future typhoon frequency and intensity, the
research team identified three options for when the typhoons will most likely occur. The Base Case
options adopts a monte carlo simulation by assuming that both the 2006 and 2009 typhoons have
equal probability of occurrence over the lifetime of the house, therefore resulting in the damages to
be evenly distributed over the next 25 years. The Best Case option reproduces both typhoons at the
beginning of the lifetime of the house, while the Worst Case option reproduces the typhoons at the
end of the house lifetime.
C.10. Climate scenario
Two climate scenarios are presented: the climate stays the same and climate change increases. In the
first scenario, we assume that climate stays the same over the next 25 years. In the second scenario, we
assume annual increases in exposure and losses due to increases in population and housing in the city.
C.11. Sensitivity analysis
Several discount rates are used for sensitivity analysis, including a low discount rate of 5% (as used
by social housing programs) and a high discount rate of 15% (as used by local banks). Using a range of
5–15% is useful to understand the implications of the chosen rate.
C.12. Net present value (NPV)
Costs and benefits arising over time are discounted and the difference taken, which is the net dis-
counted benefit in a given year. The sum of the net benefits is the NPV. A fixed discount rate is used to
represent the opportunity cost of using public funds for a given project. If the NPV is positive, then a
project is considered desirable.
C.13. Benefit-cost ratio (BCR)
The BCR is a variant of the NPV, with the benefits divided by the costs. If the ratio is greater than 1, a
project is considered to add value to society.
C.14. Internal rate of return (IRR)
Whereas NPV and BCR use a fixed discount rate, this criterion calculates the interest rate internally.
This represents the return on investment in the project. A project is rated desirable if the IRR surpasses
the average return of public capital as determined beforehand (e.g., 10%, using the market rate in 2012).
References
Asian Cities Climate Change Resilience Network (ACCCRN), 2010 . Summary of Da Nang City Climate Change Resilience Action
Plan (2011–2020). < />Anh, T.T., Phong, T., 2013. Potentials to build disaster resilience for housing: lessons learnt from a design competition. Sheltering
from a Gathering Storm Discussion Paper 5. ISET-International, Boulder, CO
.
Boardman, A., Greenberg, D., Vining, A., Weimer, D., 2011. Cost-benefit Analysis: Concepts and Practice, fourth ed. Prentice-Hall,
Upper Saddle River, NJ.
Centre for International Studies and Cooperation (CECI), 2003. Community adaptation fund operational manual. Capacity
Building for Adaptation to Climate Change Project. CECI, Hanoi, Vietnam
.
CIA World Fact Book, 2011. Inflation Rate for Vietnam, January 2011. < />(accessed 20.12.13).
Cu, N.H., 2008. Da Nang’s economic growth is stable or not? J. Sci. Technol. 5, 125–134.
Da Nang City’s Committee of Floods and Storms Control (CFSC), 2012. Summation Report on Floods and Storms: Search and
Rescue in 2011, Directions and Tasks in 2012. Da Nang CFSC, Vietnam.
Da Nang Hydro-Meteorological Station, 2012. Typhoon and Wind Speed Data for the Period 1976 to 2011 in Da Nang City. The
Dataset Provided by National Center for Hydro-Meteorological Forecasting for South Central Vietnam. Da Nang, Vietnam.
102 T.H. Tuan et al. /Urban Climate 12 (2015) 85–103
Da Nang People’s Committee (PC), 2011. Action Plan for Climate Change Adaptation and Sea Level Rise: for the Period of 2010–
2015, Vision to 2020 (Synthesis Report). Da Nang PC, Vietnam.
Da Nang Urban Planning Institute (UPI), 2012. Modification of Urban Master Plan for Da Nang City to 2030 and Vision to 2050.
Da Nang City’s Urban Planning Institute, Vietnam.
Dobes, L., 2010. Notes on Applying Real Options to Climate Change Adaptation Measures, with Examples from Vietnam
(Research Report No. 75). Australian National University, Environmental Economics Research Hub. <.
edu.au/research_units/eerh/pdf/EERH_RR75.pdf>.
Hochrainer, S.D., Kunreuther, H., Bayeris, J.L., Mechler, R., Kerjan, E.M., Wood, R.M., Young, M., 2011. The Costs and Benefits of
Reducing Risk from Natural Hazards to Residential Structures in Developing Countries (Working Paper No. 2011-01).
< />International Finance Corporation (IFC), 2013. International Finance Corporation and Partners to Launch Typhoon Insurance for
Filipino Farmers. < />financial+markets/news/ifc+and+partners+to+launch+typhoon+insurance+for+filipino+farmers>.
Institute of Meteorology, Hydrology, and Environment (IMHEN), 2013. High-resolution Climate Projections for Vietnam
(Regional Summary). Author, South Central Vietnam
.
Jones, N., Anh, T.T.V., 2010. Gendered Risks, Poverty and Vulnerability in Viet Nam: A Case Study of the National Targeted
Programme for Poverty Reduction. Overseas Development Institute (ODI), London, UK
.
Khan, F., Moench, M., Reed, S.O., Dixit, A., Shrestha, S., Dixit, K., 2012. Understanding the Costs and Benefits of Disaster Risk
Reduction Under Changing Climate Conditions: Case Study Results and Underlying Principles. ISET-International, Bangkok,
Thailand
.
Kull, D., Mechler, R., Hochrainer-Stigler, S., 2013. Probabilistic cost-benefit analysis of disaster risk management in a
development context. Disasters 37, 374–400. />Kunreuther, H., Meyer, M.J., Michel-Kerjan, E., 2010. Strategies for Better Protection Against Catastrophic Risks (Working Paper
No. 2007-09-14). < />Linnerooth-Bayer, J., Bals, C., Mechler, R., 2012. Insurance as part of a climate adaptation strategy. In: Hulme, M., Neufeldt, H.
(Eds.), Making Climate Change Work for US: European Perspectives on Adaptation and Mitigation Strategies. Cambridge
University Press, Cambridge, pp. 340–366
.
McEntire, D., 2011. Understanding and reducing vulnerability from the approach of liabilities and capabilities. Disaster Prevent.
Manage. 20 (3), 294–313
.
Mechler, R., 2005. Cost-benefit Analysis of Natural Disaster Risk Management in Developing Countries. <http://www.
mekonginfo.org/assets/midocs/0003131-environment-cost-benefit-analysis-of-natural-disaster-risk-management-in-
developing-countries-manual.pdf>.
Moench, M., Hochrainer, S., Mechler, R., Kull, D., Linnerooth-Bayer, J., Patnaik, U., Singh, G., 2009. Rethinking the costs and
benefits of disaster risk reduction under changing climate conditions. In: Moench, M., Fajber, E., Dixit, A., Caspari, E., Pokhrel,
A. (Eds.), Catalyzing Climate and Disaster Resilience. ISET-Nepal, Kathmandu, Nepal
.
MONRE, 2008. National Target Program for Climate Change Response. Ministry of Natural Resources and Environment,
Vietnamese Government, Hanoi, Vietnam
.
Nhu, O.L., Thuy, N.T.T., Wilderspin, I., Coulier, M., 2011. A Preliminary Analysis of Flood and Storm Disaster Data in Vietnam.
United Nations Development Programme, Vietnam
.
Norton, J., Chantry, G., 2008. Vaccinate your home against the Storm-Reducing Vulnerability in Vietnam. Open House Int. 33,
26–31
.
Opitz-Stapleton, S., Hawley, K., 2013. Da Nang’s Extreme Rainfall and Climate Change by the 2020s & 2050s. ISET-International,
Boulder, CO
.
Pearce, D., Atkinson, G., Mourato, S., 2006. Cost-benefit Analysis and the Environment: Recent Developments. Organization for
Economic Co-operation and Development, Paris, France
.
Phong, T., Tinh, B.D., 2010. Housing sector considerations in disaster risk reduction and climate change adaptation. In: Shaw, R.,
Pulhin, J.M., Pereira, Joy Jacqueline (Eds.), Community, Environment and Disaster Risk Management, vol. 4. Emerald Group
Publishing Limited, Bingley, UK, pp. 291–302
.
Pompe, J.J., Rinehart, J.R., 2008. Mitigating damage costs from hurricane strikes along the southeastern U.S. coast: a role for
insurance markets. Ocean Coast. Manage. 51 (12), 782–788
.
Sutter, D., Desilva, D., Kruse, J., 2009. An economic analysis of wind resistant construction. J. Wind Eng. Ind. Aerodynam. 97,
113–119
.
Thang, L.T., Tue, T.N., Tung, N.T., Yen, V.V.H., Hien, N.T.T., Dat, P.V.Q., Thai, T.V., 2013. Design proposal for climate-change
resilient housing in the context of urbanisation. Vietnamese J. Archit. 6, 38–41
.
Thomas, T., Christiansen, L., Do, Q.T., Trung, L.D., 2010. Natural Disasters and Household Welfare: Evidence from Vietnam. The
World Bank, Development Research Group, Poverty and Inequality Team.
Tinh, B.D., Tuan, T.H., Phong, T., The, B.D., Tam, B.T., 2011. Local vulnerability and adaptation to extreme climate events along the
central coast of Vietnam. In: Shaw, Rajib, Pulhin, J.M., Pereira, J.J. (Eds.), Community, Environment and Disaster Risk
Management, vol. 5. Emerald Group Publishing Limited, Bingley, UK, pp. 393–421
.
Truong, D.D., 2011. Valuing the Total Economic Values of Wetlands in Ba Lat Estuaries, Nam Dinh province (Doctoral
Dissertation). National Economics University, Hanoi, Vietnam
.
Tuan, T.H., Navrud, S., 2008. Capturing the benefits of preserving cultural heritage. J. Cult. Heritage 9 (3), 326–337.
Wisner, B., Blaikie, P., Cannon, T., Davis, I., 2004. At Risk: Natural Hazards, People’s Vulnerability and Disasters. Routledge,
London and New York
.
World Bank, 2012. ASEAN: Advancing Disaster Risk Financing and Insurance in Asean Member States: Framework and Options
for Implementation, vol. 1. Author, Washington, DC, Main report
.
T.H. Tuan et al. /Urban Climate 12 (2015) 85–103
103