Field measurements of CPT and pile base resistance in sand
Bạn đang xem bản rút gọn của tài liệu. Xem và tải ngay bản đầy đủ của tài liệu tại đây (425.84 KB, 26 trang )
Field measurements of CPT and
pile base resistance in sand
D.J. White
1
CUED/D-SOILS/TR327
(March 2003)
1
Research Fellow, St John’s College, University of Cambridge
Field measurements of CPT and pile base resistance in sand
D.J. White
March 2003
Abstract
A comprehensive database of load tests on closed-ended piles in sand has been assembled to
examine the relationship between CPT resistance, q
c
, and ultimate base capacity, q
b
. The aim
is to establish the origin of low reported values of q
b
/q
c
which contrast with continuum
models that suggest q
b
= q
c
for steady deep penetration. Partial embedment of the pile tip into
a hard layer underlying weak material has been accounted for by weighting q
c
. Partial
mobilisation has been accounted for by defining failure according to a plunging criterion.
When these two mechanisms are considered, the resulting values of q
b
/q
c
have a mean value
of 0.90 and show no trend with pile diameter. The remaining slight underprediction of the
‘continuum’ model (q
b
= q
c
) could be attributed to the underestimation of plunging load in pile
tests for which steady penetration is not reached. This conclusion challenges the diameter-
based reduction factor on the ultimate end bearing capacity of closed-ended piles in sand
recommended in the MTD design method proposed by Jardine & Chow (1996).
Introduction and background
A number of alternative methods exist to predict the unit base resistance, q
b
, of a
displacement pile in sand based on the results of a cone penetration test (CPT). The geometric
similarity of piles and CPT instruments suggests that during steady penetration (or at the
‘plunging’ load
1
in a maintained load test), q
b
should equal q
c
, as is predicted by continuum
analysis methods such as cavity expansion solutions (Randolph et al., 1994) and the strain
path method (Baligh, 1986). However, a number of authors have suggested that reduction
factors should be applied to cone resistance, q
c
, such that q
b
=
α
q
c
where
α
< 1. These
reduction factors can be linked to:
• Partial embedment (L/D)
Since a pile has a greater diameter than a CPT instrument, a deeper embedment from the
ground surface, or into a hard layer, is required to mobilise the ‘full’ strength of that
layer. Prior to sufficient penetration, q
b
will be less than q
c
since the previous layer will
still be ‘felt’ by the pile tip (eg. Meyerhof, 1976; Valsangkar & Meyerhof, 1977) This
mechanism is illustrated in Figure 1.
Also, since the L/D ratio of a CPT exceeds that of a pile, the ratio of shaft to base area is
higher, and hence the ratio of Q
s
/Q
b
. Analysis of the interaction between the shaft and
base offers a mechanism by which the surcharge on the soil surrounding the base of a
CPT is higher than around the base of a pile, leading to a corresponding decrease in q
b
/q
c
(Winterkorn & Fang, 1975; Borghi et al, 2001).
• Local inhomogeneity
Kraft (1990) proposes that a reduction factor should be applied to account for local
inhomogeneities. It is argued that the probability of pile base resistance being reduced by
a local region of weak soil is higher than that of a CPT due to the larger volume of soil
1
‘Plunging’ capacity is defined as the load at which continued penetration occurs without any further
increase in resistance. Although not always reached in maintained load tests, this is a more fundamental
measure of capacity than the load at a chosen a settlement criterion, of which there are many, and
which are influenced by pile stiffness as well as strength.
under consideration. However, this argument could be reversed by considering the
influence of local regions of hard soil.
• Absolute pile diameter
Jardine & Chow (1996), in the MTD (Marine Technology Directorate) design method for
offshore piles, recommend a reduction factor on pile diameter. This was selected to
provide a good fit with the database of load test results assembled by Chow (1996)
(Figure 2). The origin of this scale effect is not linked to any mechanism, although it is
suggested that shear bands may have an influence. The Chow (1996) database is
reassembled in this paper and alternative conclusions are reached.
• Partial mobilisation
Lee & Salgado (1999) present reduction factors on CPT resistance to account for partial
mobilisation of q
b
by noting that the definition of q
b
normally relates to a given
settlement, rather than the ‘plunging’ load required for continued penetration. Finite
element analysis is used to compare the proportion of ultimate pile capacity (which equals
q
c
, and is found by a cavity expansion method) mobilised at typical working settlements.
• Residual stresses
In addition, low apparent values of q
b
arise if residual stresses are ignored. After the final
blow or jacking stroke of installation the pile head rebounds. A larger displacement is
required to unload the pile base than to reverse the shaft friction. Therefore, when the pile
head reaches a state of equilibrium with the (zero) applied head load, the lower part of the
pile remains in compression. A proportion of the base load is ‘locked in’, and balanced by
negative shaft friction on the lower part of the shaft. It is common practice to re-zero pile
instrumentation prior to a load test, to remove the influence of any instrument drift during
driving. This leads to an under-prediction of base resistance and an over-prediction of
shaft friction. Load tests on a jacked instrumented pile reported by Chow (1996) showed
that approximately 50% of the ultimate base capacity was present as residual stress prior
to load testing (Figure A.2). Load test results for displacement piles in which an initial
base load of zero is reported should be treated with caution; a significant underestimate of
q
b
is likely.
In order to shed light on these possible differences between q
c
and q
b
, the database of
compression load test results from closed-ended displacement piles in sand assembled by
Chow (1996) has been re-evaluated from the original sources. The Chow database comprises
open and closed-ended displacement piles in clay and sand. It has been selected as the basis
for this paper since it represents the largest database of high quality pile load tests in the
literature. This paper is concerned only with closed-ended piles in sand, for which field load
test data from 28 pile tests at 12 sites was collated by Chow. For this paper, the original
sources have been used to examine more closely the relationship between CPT and base
resistance. The CPT soundings and load tests results are reproduced in Appendix 1.
Unit base resistance, q
b
, has been evaluated according to two failure criteria: D/10 pile head
settlement, and ‘plunging’ failure. ‘Plunging’ capacity is clearly defined in some tests, for
which a constant penetration resistance was clearly reached. In other cases, where near-
constant penetration resistance is reached, the maximum applied load has been chosen. This
represents an under-estimate, which in most cases is by only a few percent if compared to an
extrapolated curve. For each site the method of evaluating plunging capacity has been stated.
CPT resistance, q
c
, has been evaluated following Chow (1996) by averaging q
c
over 1.5 pile
diameters above and below the pile tip, with the exception of q
c
at the Kallo and Lower
Arrow Lake sites, for which a correction for partial embedment has been applied.
Site 1: Dunkirk (Chow, 1996) [DK]
Two compression tests on the Imperial College jacked instrumented pile are summarised in
Table 1. It should be noted that q
c
varies sharply (5-16 MPa) within +/- 0.2 metres of the level
of test DK2/L1C (Appendix 1, Figure A.1), hindering selection of an appropriate value.
Test DK1/L1C DK2/L1C Source/notes
Diameter (m) 0.1016 0.1016 D/10 = 10.16 mm
Pile tip depth (m) 7.40 5.96 Chow (1996)
q
c
(av. +/- 1.5D) (MPa) 15.03 11.68 Chow (1996) Figure 7.4
Q
b
(D/10 failure) (kN) 96 88 Chow (1996) Figure 7.30
q
b
(D/10 failure) (MPa) 11.85 10.85 (DK2/L1C) and personal comm.
q
b
/q
c
(D/10 failure) 0.788 0.929 from Chow (2002) (DK1/L1C).
Q
b
(plunging failure) (kN) 96 88 Q
b
constant (+/- 5%) beyond
q
b
(plunging failure) (MPa) 11.85 10.85 settlement of 4 mm
q
b
/q
c
(plunging failure) 0.788 0.929
Chow (1996) interpretation
q
c
(av. +/- 1.5D) (MPa) 14.25 15
Q
b
(kN) 92 (s= 4.3mm) 79 (s= 3.0mm) Failure defined as settlement, s,
q
b
(MPa) 11.3 9.7
at
τ
=
τ
max
(i.e. D/35-D/20).
q
b
/q
c
0.793 0.647 Q
b
not fully mobilised.
Table 1. Dunkirk data.
Site 2: Labenne (Lehane, 1992) [LB]
Two compression tests on the Imperial College jacked instrumented pile are summarised in
Table 2. Test LB2/L1C was conducted close to the base of a dense layer (Appendix 1, Figure
A.3). Q
b
was reducing sharply during installation to this depth. The load test became unstable
after a settlement of 3.5 mm.
Test LB1/L1C LB2/L1C Source/notes
Diameter (m) 0.1016 0.1016 D/10 = 10.16 mm
Pile tip depth (m) 5.95 1.83 Lehane (1992)
q
c
(av. +/- 1.5D) (MPa) 4.1 6.2 Measured: Lehane (1992) Figure 6.2
Q
b
(D/10 failure) (kN) - - Values from Lehane (1992) Table
q
b
(D/10 failure) (MPa) 4.7 4.3 6.2 for settlement of 20 mm.
q
b
/q
c
(D/10 failure) 1.15 0.69 Figure 6.16 indicates Q
b
remained
constant beyond s= 7 mm during
Q
b
(plunging failure) (kN) - - LB1/L1C; same Q
b
used for D/10
q
b
(plunging failure) (MPa) 4.7 4.3 and plunging failure.
q
b
/q
c
(plunging failure) 1.15 0.69
Chow (1996) interpretation
q
c
(av. +/- 1.5D) (MPa) 4.7 6.2
Q
b
(kN) 36 37 Values differ from Lehane (1992)
q
b
(MPa) 4.4 4.52
q
b
/q
c
0.936 0.729
Table 2. Labenne data.
Site 3: Kallo (De Beer et al. 1979) [K]
6 compression load tests on Franki-piles with expanded concrete bases are reported, plus a
large (250 mm diameter) CPT probe (Table 3). All tests were conducted at a shallow
embedment (<1.6 m) into dense sand underlying soft clay and peat. The interface between
these strata lies at a depth of approximately 8.2 m, and is characterised by a ≈50-fold change
in CPT resistance.
De Beer et al.’s paper focuses on the effect of such shallow embedment into a bearing
stratum. This point is not considered by Chow (1996), who uses the Kallo data to validate the
Jardine & Chow (1996) design approach which alternatively features a scale effect on
absolute diameter (not normalised by embedment). The ‘full’ q
b
available in the dense sand is
not mobilised in the case of shallow embedment, since the overlying soft soil is still ‘felt’ by
the pile base. The local q
c
must be scaled down accordingly.
In this paper a scaling procedure for two-layer soil based on the approach described by
Meyerhof (1976) and Valsangkar & Meyerhof (1977) has been used to select an appropriate
average q
c
based on the two strata for a pile embedded at depth z
b
into a hard stratum. The
strata at Kallo have been idealised as having uniform q
c
of 0.5 MPa and 25 MPa respectively,
to allow this simple calculation method to be used (Appendix 1, Figure A.5). A linear
variation in corrected q
c
over 10 pile diameters beginning two diameters above the hard layer
has been chosen, based on Meyerhof (1976) and Valsangkar & Meyerhof (1977) which
indicate that the zone of influence extends between zero and four diameters above the strata
interface (Equation 1, Figure 1).
It should be noted that the resulting values of mean q
c
in Table 3 are very sensitive to the level
at which the influence of the hard layer is first felt (taken as 2D in this case), due to the high
strength differential at this site. Further discussion of this effect is included in the proceedings
of the 1979 conference “Recent developments in the design and construction of piles”, pp253-
256.
()
()
10
2
,,
,,
+−
+=
D
z
weakchardc
weakccorrectedc
b
for 82 <<−
D
z
b
Equation 1
Test
CPT250 I II III IV V VII
Source/notes
Diameter (m)
0.25
0.908 0.539 0.615 0.815 0.406 0.609
De Beer et al. (1979)
Pile tip depth (m)
9.69 9.71 9.82 9.80 9.33 9.37 Tables 1,2.
Embedment, z
b
/D
5 (fig. 11) 1.41 1.97 2.06 1.60 3.22 2.25 De Beer et al. (1979)
Tables 2,3
q
c
(MPa)
17.65 8.68 10.0 10.2 9.14 13.0 10.7 Equation 1
Q
b
(D/10 failure) (kN)
618.5 5800 2440 2890 4810 1390 2490 De Beer et al. (1979)
q
b
(D/10 failure) (MPa)
12.6 8.96 10.7 9.73 9.22 10.7 8.55 Table 5. CPT250
q
b
/q
c
(D/10 failure)
0.71 1.03 1.07 0.95 1.01 0.82 0.80 from Figure 11
Q
b
(plunging failure) (kN)
618.5 5800 2440 2890 4810 1390 2490 Extrapolation of
load- settlement
q
b
(plunging failure) (MPa)
12.6 8.96 10.7 9.73 9.22 10.7 8.55 curve indicates
q
b
/q
c
(plunging failure)
0.71 1.03 1.07 0.95 1.01 0.82 0.80 <10% additional
capacity. D/10
values adopted
(conservative)
Chow (1996) interpretation
Local q
c
at pile tip
q
c
(NOT av. +/- 1.5D) (MPa)
21* 24.1 30 24.5 22.1 24.5 25.5 from De Beer Figure
Q
b
(kN)
618.5 5800 2440 2890 4810 1390 2490 11. No averaging.
q
b
(MPa)
12.6 8.96 10.7 9.73 9.22 10.7 8.55 *CPT250 q
c
misread:
q
b
/q
c
0.6 0.37 0.36 0.40 0.42 0.44 0.34 Original ref: q
c
=
20.2 MPa
Table 3. Kallo data.
Site 4: Hunter’s Point (Briaud et al. 1989) [HP]
The maintained load test on a single closed-ended steel tubular pile hammer driven into sand
reported by Briaud et al. (1989) is summarised in Table 4. The response is notably soft, with
the D/10 capacity differing from the plunging load by 24% (Appendix A1, Figure A.8).
Test HP1 Source/notes
Diameter (m) 0.273 D/10 = 27.3 mm
Pile tip depth (m) 7.78
q
c
(av. +/- 1.5D) (MPa) 7.2 Briaud et al. (1989) Figure 2.
Q
b
(D/10 failure) (kN) 289 Briaud et al. (1989) Figures. 5, 7, 9.
q
b
(D/10 failure) (MPa) 4.94
q
b
/q
c
(D/10 failure) 0.69
Q
b
(plunging failure) (kN) 359 Briaud et al. (1989) p1123.
q
b
(plunging failure) (MPa) 6.13
q
b
/q
c
(plunging failure) 0.85
Chow (1996) interpretation
q
c
(av. +/- 1.5D) (MPa) 7.2
Q
b
(kN) 289
q
b
(MPa) 4.94
q
b
/q
c
0.69
Table 4. Hunter’s Point data.
Site 5: Baghdad (Altaee et al. 1992, 1993) [BG]
Table 5 summarises compression tests on two driven square precast concrete piles. Correction
for residual stresses was carried out in the original references following Fellenius (1989).
Test Pile 1 Pile 2 Source/notes
Equivalent diameter (m) 0.285 0.285 D/10 = 28.5 mm
Pile tip depth (m) 11.0 15.0
q
c
(av. +/- 1.5D) (MPa) 6 6.6 Altaee et al. (1992), Figure 3a.
Q
b
(D/10 failure) (kN) 342 465 Altaee et al. (1993), Table 5 gives Q
tot
, Q
b
for
q
b
(D/10 failure) (MPa) 5.36 7.29 Q
tot
= 1000, 1600kN on pile 1 & 2 respectively.
q
b
/q
c
(D/10 failure) 0.89 1.10 From Figure 5, at s= D/10, Q
tot
= 950, 1550 kN
respectively. Q
b
has been factored accordingly.
Q
b
(plunging failure) (kN) 396 480 Altaee et al. (1992), Figure 4: Q
tot
=1100 kN at
q
b
(plunging failure) (MPa) 6.21 7.52 s= 120 mm for pile 1. Q
b
found by factoring as
q
b
/q
c
(plunging failure) 1.04 1.14 above. Pile 2 max load: 1600kN: (s= 33.2 mm)
this (conservative) value used as plunging load.
Chow (1996) interpretation
q
c
(av. +/- 1.5D) (MPa) 7 7.4
Q
b
(kN) 370 400
q
b
(MPa) 5.8 6.27
q
b
/q
c
0.83 0.85
Table 5. Baghdad data.
Site 6: Akasaka (BCP Committee 1971) [AK]
Three load tests on instrumented steel closed-ended piles from the research programme
reported by the BCP Committee (1971) are included in the Chow (1996) database (Table 6).
In tests 1C and 6B the pile was installed by jacking. Test 6C was hammer driven. The tests
were conducted with the tip of the pile at a shallow embedment into a hard layer, although a
clear transition into this stratum is not clear from the CPT profile (Appendix 1, Figure A.10).
SPT N-values of 30 and >60 were recorded at depths of 10.5 and 12.5 m respectively. CPT
probes ended (or reached refusal) at a depth of 11.5 m. Selection of an appropriate mean q
c
is
difficult, due to the high variation in q
c
in the region 10-12 m depth. The values quoted in
Table 6 were found by digitising the original reference and averaging over +/- 1.5 D.
A non-standard 43.7 mm diameter CPT probe was used. If this value is to be used in the
Chow (1996) correlation for base resistance, the measured value of q
c
should possibly be
factored up by 1.05 in order to represent an appropriate value for a standard 35.7 mm
diameter cone. This correction arises since the reduction factor in the Jardine & Chow (1996)
design method for base resistance is calculated as 1-0.5 log (d
CPT
/D), where d
CPT
is the
diameter of a standard cone. This adjustment is not explicitly made in the Chow (1996)
database.
Test 1C 6B 6C Source/notes
Diameter (m) 0.20 0.20 0.20 D/10 = 20 mm
Pile tip depth (m) 11.0 4.0 11.0
q
c
(av. +/- 1.5D) (MPa) 29.8 8.06 29.8 BCP committee (1971), Figure 2
Q
b
(D/10 failure) (kN) 560 135 590 BCP committee (1971), Figures 8,9
q
b
(D/10 failure) (MPa) 17.83 4.3 18.78
q
b
/q
c
(D/10 failure) 0.60 0.53 0.63
Q
b
(plunging failure) (kN) 830 200 640 Pile head load continues to increase as pile
q
b
(plunging failure) (MPa) 26.08 6.37 20.37 enters denser material. Unloading cycles
q
b
/q
c
(plunging failure) 0.87 0.81 0.68 hide trend. Plunging load taken at s= D.
Chow (1996) interpretation
q
c
(av. +/- 1.5D) (MPa) 30 7.85 30
Q
b
(kN) 525 125 561
q
b
(MPa) 16.71 3.98 17.86
q
b
/q
c
0.56 0.51 0.60
Table 6. Akasaka data.
Site 7. Drammen (Gregersen et al. 1973) [D]
Two compression tests on an instrumented pre-cast cylindrical concrete pile are reported by
Gregersen et al. (1973) (Table 7). Strain gauges were used to measure residual loads directly,
although zero-drift was observed. During load testing, Q
s
in compression appears to be 50-
100% greater than in tension (Gregersen et al., 1973, Figure 5), indicating that residual
stresses may be present, leading to an underestimate of Q
b
(and an over-estimate of Q
s
in
compression), as noted by Chow (1996). In addition, during each stage of the load test, shaft
friction does not reach a limiting value even at high settlement. This suggests that some
component of base resistance is included in the recorded shaft friction.
In this analysis, a simple attempt has been made to correct for residual stresses, by assuming
that Q
s
is equal in compression and tension. The small difference between Q
s
in compression
and tension attributed by De Nicola & Randolph (1993) to Poisson’s strains in the pile has
been ignored in this simple analysis. The plunging capacity is difficult to establish since
regular unload-reload loops interrupt the development of ultimate load. The capacity is
increasing at the end of each test. The maximum applied load has been used as plunging
capacity, which is likely to be a 5-15% under-prediction of correct value.
Site 8. Arkansas (Mansur & Hunter, 1970; Coyle & Castello, 1981) [A]
Four of the compression load tests reported by Mansur & Hunter (1970) are included in the
Chow (1996) database, using the corrections made for residual stresses by Coyle & Castello
(1981) (Table 8). Borehole logs in Mansur & Hunter (1970) indicate SPT values in the range
N= 32 to N= 50 for 0.8 feet penetration in the vicinity of the test piles. Considering this wide
variation in SPT value, the Coyle & Castello (1981) values of relative density, D
r
have been
used to infer CPT resistance following Lunne & Christoffersen (1983), on the assumption that
Coyle & Castello’s inferred D
r
values are based on additional site investigation data.
Load-settlement curves are not available for tests 1 & 3. The load-settlement curve for test 2
indicates a continuing increase in capacity beyond s= D/10, preventing reliable estimation of
the ‘plunging’ load. Test 10 was halted prior to settlement of D/10 (Coyle & Castello
extrapolate this curve to estimate D/10 capacity). Therefore, plunging load has not been
estimated for this paper.
It should be noted that the instrumentation channels comprise 30% of the base area of piles 2
and 10. These channels were tapered close to the base, over a distance of 600 mm. The lowest
strain gauges, which were used to estimate base resistance, lie half-way up this taper (Mansur
& Hunter 1970, Figure 6). Therefore, an effective cross-sectional area comprising half of the
instrumentation channel area in addition to the pile circular area has been used to calculate q
b
in Table 8.
Test Pile A Pile D/A Source/notes
Diameter (m) 0.28 0.28
Pile tip depth (m) 8 16
q
c
(av. +/- 1.5D) (MPa) 2.80 5.10 Gregersen et al (1973) Figure 2
Q
b
(D/10 failure) (kN) 161 211
Pile A tension test: Q
t
= 92 kN @ s= 18 mm (end of test)
q
b
(D/10 failure) (MPa) 2.61 3.43
Pile A compression test: Q= 253 kN @ s= D/10 (Figure 5)
q
b
/q
c
(D/10 failure) 0.93 0.67
Pile D/A tension test: Q
t
= 240 kN @ s= D/10 (Figure 5)
Pile D/A compression test: Q= 451 kN @ s= D/10 (Figure 5)
Q
b
(plunging failure) (kN) 175 222
Pile A maximum applied load: Q= 267 kN (Figure 5)
q
b
(plunging failure) (MPa) 2.84 3.61
Pile D/A maximum applied load: Q= 462 kN (Figure 5)
q
b
/q
c
(plunging failure) 1.01 0.71
Chow (1996) interpretation
q
c
(av. +/- 1.5D) (MPa) 2.75 5
Q
b
(kN) 69 118
q
b
(MPa) 1.12 1.92
q
b
/q
c
0.41 0.38
Table 7. Drammen data.
Test Pile 1 Pile 2 Pile 3 Pile 10 Source/notes
Diameter (m) 0.324 0.406 0.508 0.406 Mansur & Hunter 1970
Pile circular area (m
2
) 0.0824 0.1295 0.2027 0.1295 Table 2
Inst. channels area (m
2
) 0.0221 0.0616 0.0353 0.0616
Pile area (m
2
) 0.0935 0.1603 0.2204 0.1603 Including 50% of the
instrumentation channels
Pile tip depth (m) 16.18 16.09 16.15 16.15 Coyle & Castello
(1981), Table 3
Relative density, D
r
(%) 70 60 70 60 Ditto
Vert. eff. stress,
σ
’
vo
(kPa)
151.4 147.5 150.9 147.8 Ditto
q
c
(av. +/- 1.5D) (MPa) 16.47 12.51 16.45 12.52
From D
r
and
σ
’
vo
, Lunne
& Christofferson (1983)
Q
b
(D/10 failure) (kN) 757 1068 1424 712 Coyle & Castello
(1981), Table 3
q
b
(D/10 failure) (MPa) 8.01 6.66 6.46 4.44
q
b
/q
c
(D/10 failure) 0.49 0.53 0.39 0.35
Chow (1996) interpretation
Pile area (m
2
) 0.090 0.146 0.211 0.146
q
c
(av. +/- 1.5D) (MPa) 16.89 16.89 16.89 16.89
Q
b
(kN) 757 1068 1424 712
q
b
(MPa) 8.39 7.32 6.76 4.88
q
b
/q
c
0.50 0.43 0.40 0.29
Table 8. Arkansas data.
Site 9: Hoogzand (Beringen et al. 1979) [G]
A single load test on a closed-ended pipe pile reported by Beringen et al. (1979) is
summarised in Table 9. Chow (1996) notes that in the conference discussion, the authors state
that residual loads were corrected for, even though the shapes of the shear stress distributions
suggest otherwise. The compression shaft capacity is approx. 25% greater than the tension
capacity, indicating that base resistance could be underestimated. Furthermore, a base load
measurement of zero is recorded at the start of the compression load test, indicating that any
residual load has been ignored (Appendix 1, Figure A.14). The base load increased beyond a
value of 13.3 MPa at D/10 tip settlement to a load of 15.2 MPa at a settlement of D/7, when
the test was halted. The value of q
b
was continuing to increase steadily, so no plunging
capacity has been inferred.
Test Closed-ended pile Source/notes
Diameter (m) 0.356
Pile tip depth (m) 6.75
q
c
(av. +/- 1.5D) (MPa) 28.7 Digitised from Beringen et al. (1979)
Figure 4.
Q
b
(D/10 failure) (kN) 1330 (inferred from q
b
)
q
b
(D/10 failure) (MPa) 13.3 Beringen et al. (1979) Figure 18
q
b
/q
c
(D/10 failure) 0.46 (tip settlement, not head settlement)
Chow (1996) interpretation
q
c
(av. +/- 1.5D) (MPa) 28.7
Q
b
(kN) 1324
q
b
(MPa) 13.3
q
b
/q
c
0.46
Table 9. Hoogzand data.
Site 10: Hsin Ta (Yen et al. 1989) [HT]
Three load tests are reported on 609 mm diameter closed-ended pipe piles (Table 10). One
test pile, designated TP4, was loaded in compression to failure. A borehole log at the location
of TP4 indicates that the pile base was located within a 1.5 m thick layer of clay (Yen et al.,
Figure 1). Boreholes corresponding to the other test pile locations (55 – 70 m distant) show
that the depths at which clay is present vary across the site. CPT probes conducted for other
test piles show a reduction in q
c
to 2-3 MPa within the clay layers. However, the CPT probe
closest to pile TP4 does not capture a reduction in q
c
at the level of the pile base (despite the
presence of a clay layer in the borehole log at TP4) and so may not give an appropriate value
(Appendix 1, Figure A.15). The exact location of the CPT probe compared to pile TP4 and
the borehole is not stated. The shape of the pile head load-settlement curve for TP4 shows the
load at D/10 settlement to be comparable to plunging capacity.
Site 11: Seattle (Gurtowski et al. 1984) [S]
Two compression tests on octagonal concrete precast piles of nominal 24 inch (608 mm)
diameter are reported (Table 11). Residual stresses are estimated from base load
measurements of a nearby identical pile. This residual base load is approximately 12% of the
back-analysed shaft capacity of the test piles. This is a surprisingly small proportion of shaft
friction to have been retained after driving as a residual base load, suggesting this value is an
underestimate. The piles were tested to a settlement of 2.5% of D, which could account for
the low measured base resistance; D/40 has been used as the settlement criterion. CPT
resistance was estimated following Burland & Burbidge (1985) (in Meigh, 1987). A mean
value of N= 40 is found below 9 m depth (Gurtowki & Wu, 1984). Both piles are founded in
silt and sand, for which Burland & Burbidge suggest q
c
/N= 0.33, giving an estimate of q
c
=
13.3 MPa (Table 11).
Test TP4 Source/notes
Diameter (m) 0.609
Pile tip depth (m) 34.25
q
c
(av. +/- 1.5D) (MPa) 7.9 q
c
measured from Yen et al. Figure 1. Note: clay layer
indicated
in borehole log, but not evident in CPT record. Clay layers
Q
b
(D/10 failure) (kN) 850 in nearby boreholes correspond to values of q
c
= 2-3 MPa
q
b
(D/10 failure) (MPa) 2.92 => q
c
may be 3-4 times over-estimated for test pile TP4.
q
b
/q
c
(D/10 failure) 0.37
Q
b
(plunging failure) (kN) 850 A Chin plot for pile TP5 (identical to TP4 but not in clay
q
b
(plunging failure) (MPa) 2.92 layer and tested to only 20 mm settlement) indicates 27%
q
b
/q
c
(plunging failure) 0.37 greater capacity for TP5, suggesting that TP4 is influenced by
a nearby clay layer (Yen et al., Table 3).
Chow (1996) interpretation
q
c
(av. +/- 1.5D) (MPa) 8.03
Q
b
(kN) 890
q
b
(MPa) 3.06
q
b
/q
c
0.37
Table 10. Hsin Ta data.
Test Pile A Pile B Source/notes
Effective diameter (m) 0.61 0.61 Gurtowski & Wu (1984)
Pile tip depth (m) 29.9 25.6
q
c
(av. +/- 1.5D) (MPa) 13.3 13.3 SPT values converted following Burland &
Burbidge (1985)
Q
b
(D/40 failure) (kN) - -
q
b
(D/40 failure) (MPa) 3.83 3.21 Gurtowski & Wu (1984) table 1
q
b
/q
c
(D/40 failure) 0.29 0.24
Chow (1996) interpretation
q
c
(av. +/- 1.5D) (MPa) 10.4 9.6
Q
b
(kN)
q
b
(MPa) 3.81 3.85
q
b
/q
c
0.37 0.40
Table 11. Seattle data.
Site 12: Lower Arrow Lake (McCammon & Golder 1970) [E]
A compression load test was conducted on a steel pipe pile driven open-ended with regular
coring of the soil plug (Table 12). The pile was filled with a concrete plug after first being
loaded to measure shaft friction alone. The tip of the pile was embedded a short distance into
a layer of fine dense silty sand (SPT N-value 49) overlain by clayey silt (SPT N-value 8)
(McCammon & Golder, Figure 2).
The borehole log indicates that the dense sand layer begins at a depth of 144 feet, although
the driving record of the pile does not show a significant increase in resistance at this point.
Instead, a sharp increase in driving resistance is apparent at around 149 feet, although it is not
clear whether this is prior or subsequent to construction of the concrete plug. During further
driving of the now closed-ended pile a sharp increase in driving resistance commensurate
with the transition into dense sand is apparent at a depth of 153 feet.
The site cross-section shows the top of the dense layer to be sloping at a gradient of 1:8, but
the borehole location is not shown. Were the borehole to lie 50 feet ‘uphill’ of the test pile,
the sand layer could lie at a depth of 149 feet at the pile location rather than the 144 feet
shown in the borehole log, as could be tentatively assumed from the driving record. This
would place the pile tip at an embedment of 6 feet, or 3 pile diameters, into the dense sand
layer, for which some correction due to partial embedment into the bearing stratum should be
applied (Equation 1, Figure 1).
CPT data is not available, so SPT values have been converted following Burland & Burbidge
(1985). For the clayey silt layer, N= 8 and q
c
/N = 0.2, giving an estimate of q
c
= 1.6 MPa. For
the fine dense silty sand, N= 50 and q
c
/N= 0.4, giving q
c
= 20 MPa. Using Equation 1, an
appropriate mean value of q
c
at an embedment of 3 pile diameters into the dense sand is 10.8
MPa.
Base capacity is derived by subtracting the shaft capacity measured in the initial open-ended
test from the total load measured after construction of the concrete plug. The 500 ton capacity
of the loading rig was reached at a pile head settlement of 2.5 inches (D/10 = 2.4 inches).
Extrapolation of the load-settlement curve suggests plunging load was almost reached; D/10
values have been used as a conservative estimate.
Test Closed-ended pile Source/notes
Diameter (m) 0.61 2 feet (McCammon & Golder, 1970)
Pile tip depth (m) 47.24 155 feet (McCammon & Golder, 1970)
q
c
(MPa) 10.8 SPT values converted following Burland &
Burbidge (1985) and averaged for partial
embedment following Equation 1.
Q
b
(D/10 failure) (kN) 2781 From q
b
q
b
(D/10 failure) (MPa) 9.58 McCammon & Golder (1970) Table 3
q
b
/q
c
(D/10 failure) 0.89 (1 tsf = 95.8 kN/m
2
)
Q
b
(plunging failure) (kN) 2781 From q
b
q
b
(plunging failure) (MPa) 9.58 McCammon & Golder (1970) Table 3
q
b
/q
c
(plunging failure) 0.89 (1 tsf = 95.8 kN/m
2
)
Chow (1996) interpretation
q
c
(av. +/- 1.5D) (MPa) 20.62
Q
b
(kN) 2750
q
b
(MPa) 9.41
q
b
/q
c
0.46
Table 12. Lower Arrow Lake data.
Discussion
The load test data of q
b
/q
c
as interpreted by Chow (1996) to validate the Jardine & Chow
(1996) design method for base resistance on closed-ended piles in sand is shown in Figure 2.
The same data interpreted as described in this paper is shown in Figures 3 and 4, for which
D/10 settlement and ‘plunging’ have been used to define failure respectively. The scale effect
on absolute diameter is not apparent when the data are interpreted as described in this paper.
Instead, q
b
is typically slightly lower than q
c
, but no trend with diameter is evident.
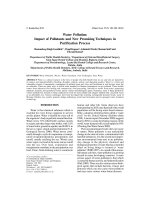
The outlying points on Figure 2, for which q
b
/q
c
< 0.5, comprise data from sites for which q
c
has been estimated from SPT data, with the exception of the data point for Drammen for
which residual loads are not fully accounted for. The selection of alternative empirical SPT-
CPT correlations can alter the position of these points by a factor 2 in either direction. A more
stringent acceptance criterion for pile tests to be included in this database would be to exclude
sites for which actual CPT data is not available.
When considering only the load tests for which a ‘plunging’ capacity can be identified, the
only data point for which q
b
/q
c
< 0.6 is from Hsin Ta. However, this test pile was located in a
clay layer which is not captured in the CPT profile. If this result is ignored, a mean value of
q
b
/q
c
= 0.90 is found from the data set of 20 piles. If this relationship were used as a basis for
the prediction of q
b
at plunging failure, a mean ratio of predicted to measured capacity of 1.02
is found, with a standard deviation of 0.17 and a coefficient of variation (COV) of 0.17. This
fit to the database in this paper is comparable with the fit between the Chow (1996) database
and the Jardine & Chow (1996) design method for the base resistance of closed-ended piles in
sand, using q
b
/q
c
= 1 – 0.5 log (D/d
cpt
), for which COV= 0.18.
This exercise demonstrates that databases of pile load test data should be treated with caution,
and care should be taken to establish the methods used to extract the underlying load test data
and ground conditions. However, the differences between Figures 2, 3 and 4 are not random,
and cannot be entirely attributed to ambiguous historical field records. The majority of field
records of low q
b
/q
c
which form the basis of the apparent scale effect on diameter evident in
Figure 2 can be attributed to other factors:
• Partial embedment
The load tests conducted at Kallo, Lower Arrow Lake and Akasaka comprise piles which
are shallowly embedded in dense sand. At this shallow embedment the ‘full’ capacity of
the dense stratum is not mobilised, and the pile tip ‘feels’ the overlying weak soil.
Laboratory tests have shown that this effect can extend to an embedment of several pile
diameters and can be accounted for using a correction of the form of Equation 1,
illustrated in Figure 1 (Meyerhof, 1976; Valsankar & Meyerhof, 1977).
Partial embedment is probably responsible for many further examples of recorded low
values of q
b
/q
c
during pile load tests beyond the data assembled in this paper. Piles
bearing in dense sand are usually installed only to a shallow embedment to prevent pile
tip damage and driveability problems.
Noting that several diameters of penetration are required to fully mobilise the strength of
the hard layer, engineers are correct to design with q
b
/q
c,local
< 1 in these cases, and will
observe the same in load tests. However, this should not be mistaken for a scale effect on
absolute diameter, but relates to partial embedment. Installing the pile deeper into the
bearing stratum would yield increased q
b
/q
c,local
and higher capacity.
• Residual stresses
The load test data from Seattle, Hoogzand, Drammen and Baghdad are influenced by
residual stresses, in that the measurement of base resistance began from a zero value at
the start of the load test (i.e. zero head load), even though some base resistance would
have remained locked in by negative shaft friction.
o The Baghdad data was corrected for residual base load by the original
authors, and shows values of q
b
/q
c
close to unity.
o The Drammen data has been corrected in this paper using a simple method
yielding values of q
b
/q
c
between 0.7 and 1 compared to an uncorrected value
of 0.4.
o Chow (1996) notes that the Hoogzand data shows slight evidence of residual
stress errors. Although the original authors discuss zero drift and residual
stresses, since the base load is recorded as zero at the start of the load test,
any residual base load has been ignored. Plunging failure was not reached
during this test.
o The Seattle data is corrected for residual base load by the original authors
using measurements from a nearby identical pile. However, the recorded
value of 12% of the shaft friction appears low, casting doubt upon their
degree of correction.
• Partial mobilisation
Plunging capacity was reached prior to a settlement of D/10 for 60% of the piles. The
piles at Baghdad, Drammen, Hunter’s Point and Akasaka showed differences between
D/10 and plunging capacity. For a D/10 failure criterion, these sites show a mean q
b
/q
c
of
0.75, which rises to 0.89 for a plunging failure criterion. When assessing pile capacity
according to the D/10 displacement failure criterion, the value is influenced by pile
stiffness for this subset of 40% of the piles, with the chosen figure depending on the
degree of partial mobilisation. For the remaining 60% of the database, the pile stiffness is
sufficiently high to have no influence on the chosen value since the plunging capacity is
reached prior to D/10 settlement.
In this paper, these three mechanisms have been accounted for by:
• Calculating appropriate values of q
b
/q
c
when the pile tip is at a shallow embedment in
a bearing stratum by using Equation 1 to include the weakening contribution of the
overlying layer when selecting q
c
(Kallo and Lower Arrow Lake sites)
• Accounting for residual base load by using tension tests to estimate the compressive
shaft capacity (Drammen site)
• Assessing pile capacity based on plunging load. Although this value is often not
reached during load tests and requires a larger safety factor in design, it is a clear
definition, and prevents pile stiffness clouding the measurement of ultimate pile
strength, as is the case with a settlement criterion.
Following this methodology, it has been found from the database of field load tests assembled
by Chow (1996), that no scale effect on q
b
/q
c
with absolute pile diameter is evident. Instead,
plunging base resistance for this set of pile load test results is best estimated as 90% of q
c
(corrected for partial embedment), and is independent of diameter.
This conclusion indicates that the ratio q
b
/q
c
is influenced by two of the mechanisms
described in the introduction to this paper: partial embedment and partial mobilisation. An
appropriate value of q
c
at the pile tip to account for partial embedment can be selected by
suitable consideration of the low values of q
c
in the overlying weak layer. It should be noted
that the strength differential between soft and hard layers is typically high, making the
corrected value of q
c
very sensitive to the weighting technique. Partial mobilisation can be
accounted for by defining q
b
as the plunging capacity, and selecting design safety factors (or
more correctly mobilisation factors) appropriately. After removing these two effects, q
b
is on
average 10% lower than q
c
. This effect could be attributed to local inhomogeneity, base-shaft
interaction, or more probably to the conservative definition of plunging capacity as the
maximum applied load in the load tests for which steady penetration under constant load was
not reached.
Conclusions
The comprehensive database of load tests on closed-ended piles in sand presented by Chow
(1996) has been reassembled from the original sources to examine the relationship between
CPT resistance, q
c
, and base capacity, q
b
. In contrast to continuum analyses which predict that
q
b
= q
c
during steady penetration, reduction factors are often recommended such that q
b
/q
c
< 1
for design.
Two mechanisms to explain these reduction factors are partial embedment of the pile into the
bearing stratum and partial mobilisation of base resistance. In this analysis, partial
embedment has been accounted for by weighting q
c
to account for overlying weak layers in
the case of piles shallowly embedded into a bearing stratum. Partial mobilisation has been
accounted for by defining failure according to a plunging criterion.
The resulting values of q
b
/q
c
have a mean value of 0.90 and show no trend with pile diameter,
for the 20 load tests in which plunging load was identified and reliable values of q
c
were
available. This slight underprediction of the ‘continuum’ model (q
b
= q
c
) could be attributed to
the underestimation of plunging load in pile tests for which steady penetration was not
reached. This outcome challenges the advice in the MTD design method (Jardine & Chow,
1996) which proposes a reduction in ultimate end bearing capacity in sand based on pile
diameter.
Notation
D Pile diameter
N SPT value
Q
s
Total shaft friction
Q
b
Total base resistance
q
b
Unit base resistance
q
c
(Unit) CPT tip resistance
q
c,local
(Unit) CPT tip resistance at pile base level (no weighting with depth)
s Pile head settlement
z Depth
z
b
Depth of embedment into hard layer
References
Altaee A., Fellenius B.H., Evgin E. 1992. Axial load transfer for piles in sand. I. Tests on an
instrumented precast pile. Canadian Geotechnical Journal 29:11-20
Altaee A., Fellenius B.H., Evgin E. 1993. Load transfer for piles in sand and the critical
depth. Canadian Geotechnical Journal 30:455-463
Baligh M.M. 1985 Strain path method. ASCE Journal of Geotechnical Engineering
111(9):1108-1136
BCP Committee 1971. Field tests on piles in sand. Soils and Foundations. 11(2):29-49
Beringen F.L., Windle D. & Van Hooydonk W.R. 1979. Results of loading tests on driven
piles in sand. Proc. Conference on Recent Developments in the Design and Construction of
Piles. ICE, London 213-225
Borghi X., White D.J., Bolton M.D. & Springman S. (2001) Empirical pile design based on
CPT results: an explanation for the reduction of unit base resistance between CPTs and piles.
Proc. 5th Int. Conf. on Deep Foundation Practice, Singapore. pp 125-132
Briaud J-L. 1988. Evaluation of cone penetration test methods using 98 pile load tests. Proc.
Int. Symposium on Penetration Testing, ISOPT-1, Orlando. 2:687-697
Briaud J-L, Tucker L.M. & Ng E. 1989. Axially loaded 5 pile group and a single pile in sand.
Proc. 12
th
International Conference on Soil Mechanics and Foundations Engineering, Rio de
Janeiro. (2):1121-1124
Burland J.B. & Burbidge M.C. 1985. Settlement of foundations on sand and gravel. Proc.
Institution of Civil Engineers. 78(1):1325-1381
Chow F.C. 1996. Investigations into the behaviour of displacement piles for offshore
foundations. PhD dissertation, University of London (Imperial College)
Chow F.C. 2002. Personal communication.
Coyle H.M. & Castello R.R. 1981. New design correlations for piles in sand. ASCE Journal
of Geotechnical Engineering. 197(GT7) 965-985
De Beer E.E., Lousberg D., De Jonghe A., Carpentier R. & Wallays M. 1979. Analysis of the
results of loading tests performaed on displacement piles of different types and sizes
penetrating at a relatively small depth into a very dense layer. Proc. Conf. on Recent
Developments in the Design and Construction of Piles, ICE, London. 199-211.
De Nicola A. & Randolph M.F. 1993. Tensile and compressive shaft capacity of piles in
sand. ASCE. Journal of Geotechnical Engineering 119(12): 1952-1973
Fellenius B.H. 1989. Prediction of pile capacity. Proc. Symposium on Predicted and Observed
Behaviour of Piles. ASCE Special Geotechnical Publication 23:293-302
Gregersen O.S., Aas G. & Dibiagio E. 1973. Load tests on friction piles in loose sand. Proc.
8
th
Int. Conf. Soil Mechanics & Foundation Engineering, Moscow (2):109-117
Gurtowski T.M. & Wu M-J. 1984. Compression load tests on concrete piles in alluvium.
Proc. Symposium on the Analysis and Design of Pile Foundations, San Francisco, ASCE. pp.
138-153.
Jardine R.J. & Chow F.C. 1996. New design methods for offshore piles MTD Publication
96/103, Marine Technology Directorate, London
Kraft L.M. 1990. Computing axial pile capacity in sands for offshore conditions. Marine
Geotechnology 9:61-72
Lehane B.M. 1992. Experimental investigations of pile behaviour using instrumented field
piles. PhD dissertation, Imperial College, University of London.
Lunne T. & Christofferson H.P. 1983. Interpretation of cone penetrometer data for offshore
sands. Proc. Offshore Technology Conference, OTC4464, Houston 181-192.
Mansur C.I. & Hunter A.H. 1970. Pile tests- Arkansas River project. ASCE J. Soil Mechanics
& Foundations Division. 96(SM5):1545-1582
McCammon N.R. & Golder H.Q. 1970. Some loading tests on long pipe piles. Geotechnique
20(2):171-184
Meyerhof G.G. 1976. Bearing capacity and settlement of pile foundations. ASCE Journal of
Geotechnical Engineering. 102(GT3)197-228
Randolph M.F., Dolwin J. & Beck R. 1994. Design of driven piles in sand Géotechnique
44(3):427-448
Valsangkar A.J. & Meyerhof G.G. 1977. Bearing capacity of piles in layered soils. Proc. 8
th
Int. Conf. Soil Mechanics & Foundation Engineering, Moscow. (1):645-650
Winterkorn, A.F. & Fang, S.Y. 1975. Foundation Engineering Handbook, Van Nostrand
Reinhold Co. New York.
Yen T.L, Lin H, Chin C-T & Wang R-F. 1989. Interpretation of instrumented driven steel
pipe piles'. In: Proc. Congress on Foundation Engineering- Current Principles and Practice,
Illinois, ASCE. pp1293-1308.
Figure 1. Partial embedment reduction factor on base resistance.
Figure 2. Normalised pile base resistance vs. pile diameter (Chow, 1996; Failure: D /10 settlement)
Figure 3. Normalised pile base resistance vs. pile diameter (White, 2003; Failure: D /10 settlement)
Figure 4. Normalised pile base resistance vs. pile diameter (White, 2003; Failure: plunging load)
0
0.2
0.4
0.6
0.8
1
1.2
00.20.40.60.81
Pile diameter,
D
(m)
q
b
/
q
c
DK
LB
K
HP
BG
AK
D
A
G
S
E
HT
MTD
0
0.2
0.4
0.6
0.8
1
1.2
1.4
0 0.2 0.4 0.6 0.8 1
Pile diameter,
D
(m)
q
b/
q
c
DK
LB
K
HP
BG
AK
D
A
G
S
E
HT
0
0.2
0.4
0.6
0.8
1
1.2
1.4
0 0.2 0.4 0.6 0.8 1
Pile diameter,
D
(m)
q
b
/q
c
DK
LB
K
HP
BG
AK
D
E
HT
CPT values derived from SPT data.
Residual
load ignored
Clay layer at pile base
Clay layer at
pile base.
MTD design method (Jardine & Chow, 1996)
q
b
=
q
c
(1 - 0.5 log (
D/d
CPT
)
Test to 2.5%
D
settlement
Appendix 1: Cone penetration data and load test results
If available in the original reference, the cone penetration data and base load-settlement
results from each site are reproduced in this Appendix. The ‘design’ cone resistance, q
c
, taken
as a local average (+/- 1.5 D) or using Equation 1 for partial embedment as described
previously, is indicated on each load-settlement curve.
Site CPT profile, q
c
Base load –settlement curves, q
b
-s
Dunkirk (Chow (1996) Figure A.1 Figure A.2
Labenne (Lehane, 1992) Figure A.3 Figure A.4
Kallo (De Beer et al., 1979) Figure A.5 Figure A.6
Hunter’s Point (Briaud et al., 1989) Figure A.7 Figure A.8
Baghdad (Altaee et al., 1992, 1993) Figure A.9 Not given in original reference
Akasaka (BCP Committee, 1971) Figure A.10 Figure A.11
Drammen (Gregersen et al., 1973) Figure A.12
Failure load corrected for residual load in this
paper. Original uncorrected data not shown.
Arkansas (Mansur & Hunter, 1970) SPT
Original data uncorrected for residual load- not
shown.
Hoogzand (Beringen et al., 1979) Figure A.13 Figure A.14
Hsin Ta (Yen et al., 1989) Figure A.15 Not given in original reference
Seattle (Gurtowski et al., 1984) SPT Not given in original reference
Lower Arrow Lake (McCammon &
Golder, 1970)
SPT Base capacity estimated in original reference
by comparing open and close-ended tests
Table A.1. List of CPT profiles and base load-settlement figures.
0
1
2
3
4
5
6
7
8
9
0 5 10 15 20 25 30
CPT resistance, q
c
(MPa)
Depth (m)
DK2/L1C
DK1/L1C
Figure A.1. Dunkirk CPT profile (after Chow, 1996)
0
5
10
15
20
25
0 2 4 6 8 10121416
Base resistance, q
b
(MPa)
Settlement, s (mm)
DK1/L1C
DK2/L1C
q
c
, DK1/L1Cq
c
, DK2/L1C
Figure A.2. Dunkirk base load-settlement response (after Chow, 1996; Chow 2002)
0
1
2
3
4
5
6
7
024681012
CPT resistance, q
c
(MPa)
Depth (m)
LB2/L1C
LB1/L1C
Figure A.3. Labenne CPT profile (after Lehane, 1992)
0
5
10
15
20
25
01234567
Base resistance, q
b
(MPa)
Settlement, s (mm)
LB2/L1C
LB1/L1C
q
c
, LB2/L1Cq
c
, LB1/L1C
Figure A.4. Labenne load-settlement response (after Lehane, 1992)
0
2
4
6
8
10
12
14
16
18
20
0 1020304050
CPT resistance, q
c
(MPa)
Depth (m)
Tests I-V II
CPT250
Standard CPT
Figure A.5. Kallo CPT profile (after De Beer et al., 1979)
0
20
40
60
80
100
120
0246810121416
Base resistance, q
b
(MPa)
Settlement, s (mm)
Pile I
Pile II
Pile III
Pile IV
Pile V
Pile V II
q
c
: I IV II III V II V
Figure A.6. Kallo base load-settlement response (after De Beer et al., 1979)
0
2
4
6
8
10
12
14
16
0 2.5 5 7.5 10 12.5 15 17.5
CPT resistance, q
c
(MPa)
Depth (m)
HP1
Figure A.7. Hunter’s Point CPT profile (after Briaud et al., 1989)
0
10
20
30
40
50
60
70
80
90
100
012345678
Base resistance, q
b
(MPa)
Settlement, s (mm)
q
c
HP1
Figure A.8. Hunter’s Point base load-settlement response (after Briaud et al., 1989)
0
2
4
6
8
10
12
14
16
18
0 2.5 5 7.5 10 12.5 15
CPT resistance, q
c
(MPa)
Depth (m)
Pile 1
Pile 2
Figure A.9. Baghdad CPT profile (after Altaee et al., 1992)
0
2
4
6
8
10
12
14
0 102030405060
CPT resistance, q
c
(MPa)
Depth (m)
Range from 7 CPT soundings
6B
1C, 6C
Figure A.10. Akasaka CPT profile (after BCP Committee, 1971)
0
100
200
300
400
500
600
0 10203040
Base resistance, q
b
(MPa)
Settlement, s (mm)
1C
q
c
, 6B
6C
6B
q
c
, 1C, 6C
Figure A.11. Akasaka base load-settlement response (after BCP Committee, 1971)
0
5
10
15
20
25
0 2.5 5 7.5 10 12.5 15
CPT resistance, q
c
(MPa)
Depth (m)
D/A
D
Figure A.12. Drammen CPT profile (after Gregersen et al., 1973)
0
2
4
6
8
10
12
14
16
18
20
0 1020304050
CPT resistance, q
c
(MPa)
Depth (m)
Test pile
Figure A.13. Hoogzand CPT profile (after Beringen et al., 1979)
0
10
20
30
40
50
60
70
0 5 10 15 20 25 30
Base resistance, q
b
(MPa)
Settlement, s (mm)
q
c
Residual base load ignored
Figure A.14. Hoogzand base load-settlement response (after Beringen et al., 1979)