VinchyCapital if not now then when
Bạn đang xem bản rút gọn của tài liệu. Xem và tải ngay bản đầy đủ của tài liệu tại đây (392.02 KB, 20 trang )
IF NOT NOW,
THEN WHEN?
"Thoughts lead on to purpose, purpose leads on to actions, actions form habits, habits decide
character and character fixes our destiny"
Tryon Edwards
Addressing the confidence crisis in Vietnam’s capital markets
If not now then When? Page 2
EXECUTIVE SUMMARY
(A) CONTENTS OF THIS PAPER
1. How Perceptions change – The Then (2007) and the Now (2008)
2. Analysis of various aspects of Economy - Fundamentals Remain Strong –
Export, FDI, industrial production, agriculture production, consumer
spending, remittance and tourism
3. Analysis of various aspects of Economy - On currency scares and NDF and
Government Response
4. Analysis of Measures put in place so far to gain confidence
5. Investor’s Perspective and Proposal - The Now and Possible Measure for
regaining confidence – Equity Performance
6. The time is NOW.
(B) SUMMARY OF PAPER AND RECOMMENDATIONS
The crisis, if it is a crisis, is a crisis in confidence. In other words, it is the perception
of the market or consumers which is driving this crisis.
Vietnam’s fundamentals remain strong. In order to restore confidence, several
measures are proposed:-
(a) Establishing central buying agri-bodies and implement domestic subsidy
mechanisms for basic essential goods for Vietnam.
(b) Use of administrative measures rather than monetary policies e.g. to control
inflation.
(c) Use of other measures to improve confidence and participation in capital
markets to jump-start confidence in a crucial funding platform for Vietnam.
(C) CONCLUSION
Vietnam’s fundamentals are strong. It is just a perception issue which needs to be
addressed. Some proposals are contained in this paper, for consideration. Chief
among the proposals is the formation of a fund which due to it being a joint
investment with others will cost less but will potentially reap significant rewards for
the government, if the investment is timed properly.
If not now then When? Page 3
I. PERCEPTIONS – THE THEN AND THE NOW (HOW THINGS DON’T CHANGE BUT
PERCEPTIONS DO)
1.1 THE THEN - Success story of Vietnam in 2003 - 2007, focusing on 2007:
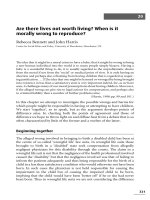
Vietnam is considered as the fastest growing economy of ASEAN. GDP achieved
growth at 8.48% in 2007, and considered to continue at least 8% for the next 5 years
2008-2012.
In 2007, export jumped 21% to US$48.4 bil with import growth 35% to US$57.8 bil.
This made Vietnam as one of most open trading countries in the world. No. of foreign
tourists exceed 4.2 mil, up by 16% compared to 2006’s.
FDI continued to make a record with actual disbursed amount of US$6.5 bil in 2007,
more than 3 times higher than 2006’s US$1.8 bil, mostly for industrials and real
estate. FDI commitments also reach new height with US$20.3 bil at the end of 2007,
compared to only US$12.0 bil of 2006.
Real GDP growth (% change)
2
3
4
5
6
7
8
9
2003 2004 2005 2006 2007 2008 2009
Vietnam Asia (excl Japan) World
Source: Economist Intelligence Unit.
All the analysis about perspectives of Vietnam economy, except for rising inflation of
12.63% in 2007, has made the world view Vietnam as the next Asian Tiger. Vietnam
became the dream destination for investments, tourism development, and all sources
of capital inflow were trying to get a piece of the action.
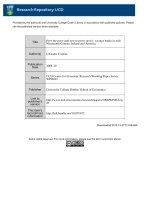
Stock market continued to develop strongly with market cap about 44% of GDP at
over US$30 bil. Interest in Vietnam was so strong, asset managers’ assets under
management increased multiple times! Even the pace of stock market development
was unable to catch up with the asset managers Assets under Management (AUM).
If not now then When? Page 4
These asset managers, given the shortage of free float in the stock market, became
the market.
Market Capitalization / Nominal GDP
0%
50%
100%
150%
200%
250%
300%
350%
400%
1991 1992 1993 1994 1995 1996 1997 1998 1999 2000 2001 2002 2003 2004 2005 2006 2007
Malaysia Thailand Indonesia China Vietnam
Source: Economist Intelligence Unit.
If not now then When? Page 5
1.2 THE NOW - Vietnam in controversy in 2008:
GDP growth slowed down to 7.4% in Q.1 2008. Inflation jumped 25% in May 2008,
caused primarily by food prices which increased over 42%. Oil prices are now above
US$130 per barrel, even when Vietnam is a net exporter of energy products.
Sharply tightening policies, focusing on monetary and later on public finance, has
been implemented to curb inflation. In Feb 08, interest rates rose above 40%!
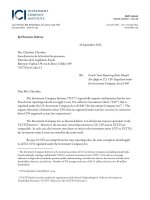
As a result, Vietnam stock market continued to fall sharply from Jan-08 at 924 to
May-08 at 414 or loss 55%, the heaviest loss in Asia. Vietnam’s first asset bubble has
burst and now it is cascading to land and house prices, with high end real estate
developments’ prices decreasing 50%-60% in many areas.
Trade deficit of US$14.4 bil (16% of GDP – up till May 2008) has caused serious
concerns about a possible balanced of payments crisis. These factors resulted in
fluctuations of USD/VND forex rate, shortage of USD in commercial banks, high yield
in bond market up to 24% in late May 2008. Anecdotal evidence is that the trading or
purchases of gold and foreign currencies has reached alarming proportions. Many
foreign commentators draw parallels to the current Vietnam crisis of confidence with
that of Thailand’s 97 crisis. The Thailand crisis more than 10 years ago snow-balled
into the Asian Financial Crisis, affecting many, many countries of Asia.
The questions have been raised about whether Vietnam has strong economic
fundamentals to sustain its high rate of economic development or will fall into same
crisis as Thailand did in 1997-98?
If not now then When? Page 6
The equity market stumbles
0
200
400
600
800
1000
1200
2004 2005 2006 2007 2008
HCMC Stock INDEX
Source: CEIC, Merrill Lynch calculation.
II. ANALYSIS OF VARIOUS ASPECTS OF ECONOMY – FUNDAMENTALS REMAIN
STRONG
But who is watching the positives?
However, positive developments in last 5 months are recorded as (i) export growth of
27.2% is amongst the best in Asia, (ii) industrial production expanded 16.7%, (ii)
consumer spending reached growth at 29.7%, (iv) FDI approval of US$23 bil until
now, more than the entire 2007’s, and (v) no. of foreign tourists up by 16%.
If it is a crisis, it is a crisis in confidence, no more
Vietnam in 2008 is still the same Vietnam as the Vietnam in 2007.
The fundamentals have not changed with further development of export, FDI,
industrial production, agriculture production, consumer spending, remittance and
tourism.
Stock Markets and signals about the economy
Many retail observers around the world use the stock market indicators as a
representation or proxy of economic growth. Whilst that may be somewhat
appropriate in the developed markets/economies context, this is inappropriate in
an emerging market like Vietnam. The relevance between GDP growth and stock
market share index is one of little or low correlation. Please see the charts and
correlation figures on emerging markets in general and how they contrast with
S&P, the stock indicator for the US in Appendix I. In our view, the stock market is
a sentiment indicator for Vietnam, nothing more.
If not now then When? Page 7
Sources: ADB, Bloomberg, GSO
Data from the Vietnamese capital market’s short history also shows a weak
relationship between share price volatility and real economic performance as
stated in GDP growth and Industrial production growth.
Conflicting Advice from Reputed Economists
Although many say that Vietnamese policy makers were instrumental in creating
the current worrisome situation, our sympathies go out to them. It is very difficult
to identify the appropriate macro-economic policy responses when leading
observers (such as global economists, global institutions and NGOs) continue to
make (in our view) erroneous pronouncements on what should and should not be
done. This is because their analysis is often made in an environment of incomplete
and/or inadequate analysis. When reputed economists/analysts make comments
and seemingly provide knowledgeable advice, has anyone closely analysed if those
comments are well informed, relevant, or appropriate? Who should the
government of Vietnam listen to? There is such a sea of noise!
Policy Measures to manage inflation - Need for subsidy mechanisms
Take for instance the policy measures to manage inflation. So far, many people
talk about using monetary policy. In our view, the instruments of monetary policy
do not yet function well in Vietnam. Thus, we are worrying that even if the
interest rate rises to 50% pa that would not stop inflation from reaching 30% pa
(especially when more than 60% of CPI is accounted for by food and energy prices’
sharp inflation).
-
50%
0%
50%
100%
150%
0%
5%
10%
15%
20%
2001
2002
2003
2004
2005
2006
2007
Q1 2008
Growth in GDP vs. Equity Market Performance
Nominal GDP Growth
Real GDP Growth
Change in VNINDEX
If not now then When? Page 8
Indeed, if there is a 50% pa interest rate, there will probably be a run on the
banks and all Vietnamese people will take money out and shift to hard assets, e.g.
rice, gold, petrol and cause an even more dangerous spiral in inflation in domestic
Vietnam.
We thus highlight the urgent need to set up central buying agri-bodies, and
implement domestic subsidy mechanisms for these basic essential goods for
Vietnam. We encourage all to review our Research Paper, “Recommendations from
a Friend”.
CONFIDENCE MY FRIENDS, IS SO LACKING
The only thing that differs from 2007 and 2008 is confidence, or to be precise, a
lack of confidence. No confidence that this time, Vietnam is not a Thailand, no
confidence that the government can manage inflation, no confidence that Vietnam
will not collapse as a result of inaction by its people.
Unfortunately, policies need time to be more effective, and inflation needs time to
be curbed; that means, this crisis of confidence from both local and foreigners is
not going away so soon.
Why Vietnam’s situation is different from Thailand – Please learn from history
There is little evidence that Vietnam’s situation is bad like the Thailand of 1997, or
in anyway similar.
Even whilst Vietnam’s state budget has remained in high deficit, foreign debts
have decreased to the current 33% of GDP (as compared to Vietnam’s 40% in
2000 or 73% in Thailand in 1997). Most of Vietnam’s debts are from ODA which if
need be can be rescheduled by long term decision makers. For Thailand and the
rest of Asia’s affected countries during the Asian financial crisis, the key issue was
the dominance of short term capital flows to fund their current account deficits.
These significant current account deficits were in turn driven by a combination of
high investment growth, and wasteful investments into speculative activity like
real estate and large state backed projects. E.g. Thailand created a monster
petrochemical and refinery complex which was meant to produce more than was
required for domestic usage. They wanted to be a petrochemical giant for
Indochina and Asia. When the providers of short term funding got nervous, the
pulled out, and left a sea of destruction and anguish for Asian countries involved.
Here, these providers of short term capital were primarily behaving a little like
“retail investors”.
As referred to in the paper “Vietnam and its Myths”, there is no balance of
payment issues for Vietnam. Indeed, Vietnam is in a very enviable position with
much of its infrastructure projects supported by very long term funding flow,
including significant FDIs. This is very positive for Vietnam.
If not now then When? Page 9
III. ANALYSIS OF VARIOUS ASPECTS OF ECONOMY – ON CURRENCY SCARES
3.1 On Currency scares
In addition, the VND is not a freely convertible currency. However, everyone
believes in market forces, and this obviously applies to exchange rates: From the
non-deliverable forwards (NDF) market, where 12m contracts are at above
21,900VND/$ against an official rate of 16,200, recently adjusted to 16,459;
people translate it into devaluation of nearly 30% in next 12 months. But the NDF
market is very illiquid and it does not reflect the true demand against supply in
Vietnam. So when observers review this attention grabbing figures of the
extremely illiquid Non-Deliverable Forwards (NDFs) played by foreign speculators,
they immediately draw the conclusion that VND is going through a nose dive.
“Vietnam is going to have a currency crisis!” goes the newspaper headlines!
Nothing can be further from the truth! Why did the Malaysia move towards M$
currency capital controls during the 97-98 crisis? Vietnam is already there,
whereas because M$ was under attack during the 97-98 crisis, Malaysia had to
move to a model similar to Vietnam’s, and consequently, none of the speculators
managed to speculate against Malaysia M$.
3.2 Recent government response
After speaking publicly that there are no plans to devalue the currency, the
Vietnam government/SBV 2 days later adjusted the VND by a 2% devaluation and
raised interest rates! This has seemingly stabilized the markets and received
positive feedback in both Vietnam and overseas.
We however, feel that the flip-flop nature of official communication may damage
the credibility of the anyone in its resolve to manage the current confidence crisis.
In other words, investors may lose confidence in the institution if they think that
what the institution says may not be what it means. Who will believe the
announcements again? Explanations of actions are required and communication of
not carrying out the same mis-management of expectations must be made to all,
domestic and foreigners.
And in succumbing to the inappropriate pressures to raise interest rates further,
and depreciating the currency, this may signal a lack of understanding of the key
issues involved and that Vietnam does not have the appropriate solutions to
handle this confidence crisis. It is our view that Vietnam does not need high
interest rates, it is high enough now. Many businesses, even good, will fail and be
in trouble in this high interest rates environment. Furthermore, Vietnam needs an
appreciating currency to manage imported inflation as well as control domestic
liquidity growth.
IV. ANALYSIS OF VARIOUS MEASURES PUT IN SO FAR
Measures put in place so far to gain back confidence:
- During the last 4 months, the management of inflation has been implemented
with monetary policies such as central bank rate increases, compulsory rate
If not now then When? Page 10
increase, strong control on credit growth at 30%, revitalising the basic central
bank rate to monitor closely market moves; public finance policies as 10%
decrease in government regular spending; and VND4 trillion has been cut from
investment spending.
- Fiscal administrative action has become one of the tools for the State to control
inflation of certain key economic sectors such as fuel, cement, power and to
delay price increases. But are the market participants adhering to these price
controls? We think not. The issue is not so much strategy, but implementation,
and adherence to the measures. Just like managing the SOEs, the government
needs to implement very, very stern measures.
V. INVESTORS PERSPECTIVE AND PROPOSAL – PROPOSALS FOR REGAINING
CONFIDENCE
5.1 Summary
5.1.1 In this paper we have set out the background noting that the key issue is
change in perception or market sentiment as the fundamentals for Vietnam’s
economy in key sectors has not changed or in fact has even improved. In this
section we also include prognosis of how these sectors will perform and what
may need to be done.
5.1.2 Thus to address the issue of confidence or market perception, a very fast
means could be to “jump-start” the capital markets. In the nature of markets,
we can encourage greed to replace fear as the driving force and participants
will then again jump into the market and carry on the momentum. The timing
of this activity should be carefully timed and preferably take place soon.
5.1.3 We produced papers titled “Actions required for Vietnam Capital Markets”, and
“Q&A: Can Market Stabilisation Funds work? Yes, if there is total
commitment”. We highlighted a possible avenue to address the confidence
issues in the capital markets may be done through a fund
5.1.4 The details of a plan which we consider workable is summarised below.
5.2 Prognosis – “Focus and be steady”
5.2.1 With detailed analysis, we expect that the economy will improve and continue
to perform well from Q.3, forecast of GDP at over 7.0%-7.5%, export over
US$60 bil (up 25%), import over US$80 bil (up 40%), record FDI approval of
aprox. US$40 bil (up 100%). Balance of Payment at surplus in excess of US$1
bil.
5.2.2 Strong FDI, remittance (expected over US$8 bil in 2008), and continued
inflows of capital will be the key factors to support the economy to overcome
current difficulties and make it stable from 2009.
5.2.3 The government is slowly but surely coming round to see that they need to
implement administrative measures to control inflation. CPI will in the short
term slow down to 22%-24%. When the administrative central buying bodies
If not now then When? Page 11
are put in place and functioning well, inflation figures will effectively be decided
by the government, with reference to regional inflation figures to ensure that
they are not too out of line. Cannot stand out too much, and need to just be
better than China, to generate confidence among investors. Vietnam does not
have food security issues, just lack of adequate price control!
5.3 Opportunity of a lifetime! – Our view of the Marketplace and Why we propose
the “Jump Start” Solution focusing on Capital Markets
5.3.1 History has shown that whenever a market falls significantly as a result of the
loss of confidence, it represents the best buying opportunity.
5.3.2 Long term investors, who understand the key issues involved, use these
opportunities to pick up attractive assets and sit pretty and wait for all the
other followers to join.
5.3.3 To elaborate on this point, there are different perspectives/ behaviours of
major market participants which we set out below. Because of this it is
necessary for a substantial fund to make the first decisive move and then
trigger the “herd mentality” of other market participants. The following are
different types of investors:-
(a) Retail Investors. They are generally clueless, they need to invest by watching
momentum. Retail investors invest based on their friends' recommendations.
and their friends are usually equally clueless.
(b) Institutional Investors. Many institutional investors also behave like retail
investors. The decision makers usually have none of their own money on the
table. They are salary men, meaning, they cannot be expected to do risky
things. They want to keep their jobs. So, when their own national
newspapers are saying Vietnam is going to have a financial crisis, and should
they allocate funds to Vietnam, and if things do not turn out well – then they
will be accused …."it is already in the newspapers, did you not read the risks
involved? You did something stupid, you will be sacked". The institutional
investors thus tend to be very, very conservative although they carry out
better due diligence than the retail investors.
(c) The really smart investors are the ones who can differentiate noise from facts.
Successful investors such as George Soros and Warren Buffet are credited with
being smart investors. For instance, Warren Buffet did not invest during the
internet mania when everyone did, and when he started buying companies,
other retail investors thought that it was contrarian (against the market
sentiment).
(d) We at Vinchi try to be the really smart investor and to guide the really smart,
sophisticated, and dedicated investors to understand the things which VinChi
herself draws comfort from, in an independent, unbiased fashion and to focus
on the key issues.
5.3.4 Our philosophy and confidence draws from our study of history. History shows
us that investors make a lot of money, in times of crisis, and especially when
there is a loss of confidence. In those times, long term investors who have a
If not now then When? Page 12
steady hand and have vision and courage to act when no one else does,
usually emerge as the overall winner.
5.3.5 Here are examples of how those with a steady hand emerged during
the following crises:-
(a) Winners of the Asian financial crisis
The 1997 Asian financial crisis started in Thailand with the financial collapse of
the Thai baht caused by the decision of the Thai government to float the baht,
cutting its peg to the USD, after exhaustive efforts to support it in the face of
a severe financial overextension that was in part real estate driven. The crisis
had significant macro-level effects, including sharp reductions in values of
currencies, stock markets, and other asset prices of several Asian countries.
Many businesses collapsed, and as a consequence, millions of people fell below
the poverty line in 1997-1998. Indonesia, South Korea and Thailand were the
countries most affected by the crisis.
HANG SENG INDEX
6000
8000
10000
12000
14000
16000
18000
Jan-97
Feb-97
Mar-97
Apr-97
May-97
Jun-97
Jul-97
Aug-97
Sep-97
Oct-97
Nov-97
Dec-97
Jan-98
Feb-98
Mar-98
Apr-98
May-98
Jun-98
Jul-98
Aug-98
Sep-98
Oct-98
Nov-98
Dec-98
Jan-99
Feb-99
Mar-99
Apr-99
May-99
Jun-99
Jul-99
Aug-99
Sep-99
Oct-99
Nov-99
Dec-99
Source: Bloomberg
(b) Winners of the Long term capital management crisis
The Long-Term Capital Management (LTCM) crisis in late 1998 caused the U.S.
stock market drop of 20% and the European markets to drop 35%. Since
many banks and pension funds were investors of LTCM. To save the U.S.
banking system, then-Federal Reserve Chairman Alan Greenspan personally
convinced 14 banks to remain invested in the hedge fund, averting disaster. In
addition, the Fed started lowering the Fed Funds rate as a reassurance to
investors that the Fed would do whatever it took to support the U.S. economy.
Without such direct intervention, the entire financial system was threatened
with a collapse.
If not now then When? Page 13
“What is an investor to do in these circumstances?” A research paper by Brian
Gendreau, Ph.D., Investment Strategist, provided us a look at how stock
markets in the United States and abroad fared before and after such a
financial crisis. The three episodes in which the Fed has provided liquidity to
stem a financial crisis included: The 1987 crash, the 1998 Russia/LTCM crisis
and September 11, 2001. In all three episodes the Fed flooded the markets
with liquidity and cut the Federal funds rate.
The table below shows the Average Returns Before and After the 1987 crash,
1998 Russia/LTCM crisis, and September 11, 2001.
12 months
before crisis
3 months before
crisis
3 months after
crisis
12 months after
crisis
S&P 500
1987
18.4%
11.7%
10.9%
23.2%
1998
12.9%
-5.9%
17.4%
25.4%
2001
-26.6%
-12.9%
9.4%
-12.4%
EAFE
1987
49.2%
8.5%
-9.9%
6.1%
1998
-7.1%
-10.2%
15.0%
20.8%
2001
-28.5%
-33.4%
5.0%
-8.8%
Emerging Market
1998
-47.3%
-22.8%
12.9%
50.3%
2001
-30.6%
-13.5%
12.2%
7.0%
Source: Standard & Poor’s, Morgan Stanley Capital International and ING IM estimates. EAFE is
MSCI’s index of stock returns in Europe, Australasia, and the Far East.
NASDAG 100 INDEX
0
2000
4000
6000
8000
10000
12000
14000
16000
18000
Jan-97
Feb-97
Mar-97
Apr-97
May-97
Jun-97
Jul-97
Aug-97
Sep-97
Oct-97
Nov-97
Dec-97
Jan-98
Feb-98
Mar-98
Apr-98
May-98
Jun-98
Jul-98
Aug-98
Sep-98
Oct-98
Nov-98
Dec-98
Jan-99
Feb-99
Mar-99
Apr-99
May-99
Jun-99
Jul-99
Aug-99
Sep-99
Oct-99
Nov-99
Source: Bloomberg
If not now then When? Page 14
The above chart and table could apparently shows the answer to our mentioned
question.
(c) Winners of the SARS debacle
Severe acute respiratory syndrome (SARS) is a respiratory disease in humans
which is caused by the SARS coronavirus (SARS-CoV).
[1]
There has been one
near pandemic to date, between November 2002 and July 2003, with 8,096
known infected cases and 774 deaths.
The Hang Seng Index dropped from 10.2227 at the outbreak of SARS in Dec-
02 to 8.435 in late Apr-03, then bounced back to 12.575 as at Dec-03. A Profit
margin of nearly 50% was recorded for investors who dared to invest in April
and May 2003 when SARS was nearly controlled.
HANG SENG INDEX
8000
8500
9000
9500
10000
10500
11000
11500
12000
12500
13000
Jan-02
Feb-02
Mar-02
Apr-02
May-02
Jun-02
Jul-02
Aug-02
Sep-02
Oct-02
Nov-02
Dec-02
Jan-03
Feb-03
Mar-03
Apr-03
May-03
Jun-03
Jul-03
Aug-03
Sep-03
Oct-03
Nov-03
Dec-03
Source: Bloomberg
5.3.6 The time is now! Be confident in Investing in Vietnam Market
(a) Based on the above philosophy and our view of the market, Vinchi feels very
confident now to prepare for investing into the Vietnam market when the
indicators showing that the current situation will improve soon.
(b) This opportunity represents the second chance of the decade in Vietnam. The
first chance happened in early 2006 when the shares are understated with the
companies’ assets not properly pricing in fair valuations.
(c) In our view, the current state of the capital markets represents a very
attractive opportunity for every investor to buy up inexpensively priced assets
(e.g. the Vietnamese equity market is trading at PE11x) and short term bonds
are trading above 20% pa. In buying the market, investors can also take
pride in promoting the efficient functioning of its capital markets.
If not now then When? Page 15
(d) When the capital markets improve, other currently sceptical retail and
institutional participants who are all sitting on the sidelines now, will then
jump in with “greed” as the driving force again. Given how illiquid the
markets are, it doesn’t take very large funds to move the prices and thus
improve sentiment. The other private participants will then carry on the
momentum after the early investors have invested. But someone needs to
start the process decisively
If not now, then when?
VinChi Capital will be investing into the
markets in the very near future.
If not now then When? Page 16
0
100
200
300
400
500
600
Dec-96
Dec-98
Dec-00
Dec-02
Dec-04
Dec-06
MGUEBZ INDEX
44.63
530.06
113.507
210.22
154%
152%
BRAZIL - MGUEBZ INDEX
APPENDIX 1
0
200
400
600
800
1000
1200
1400
1600
1800
Jan-95
Jan-97
Jan-99
Jan-01
Jan-03
Jan-05
Jan-07
MXRU INDEX
38.25
1164.52
432.07
274.05
616%
169%
RUSSIA - MXRU INDEX
0
20
40
60
80
100
120
Dec-96
Dec-98
Dec-00
Dec-02
Dec-04
Dec-06
MGUACF INDEX
23.944
50.031
20.282
39.563
109%
CHINA - MGUACF INDEX
Source: Bloomberg
Source: Bloomberg
Source: Bloomberg
If not now then When? Page 17
0
100
200
300
400
500
600
700
Dec-96
Dec-98
Dec-00
Dec-02
Dec-04
Dec-06
MSEUSIA INDEX
74.20
668.88
194.48
281.47
137%
162%
INDIA - MSEUSIA INDEX
0
20
40
60
80
100
120
140
160
180
Dec-96
Dec-98
Dec-00
Dec-02
Dec-04
Dec-06
MSAR INDEX
14.257
150.83
46.59
103.87
227%
45%
ARGENTINA - MSAR INDEX
ASIA EMERGING MARKET - MXMS INDEX
0
100
200
300
400
500
600
Dec-87
Jan-90
Jan-92
Jan-94
Jan-96
Jan-98
Jan-00
Jan-02
Jan-04
Jan-06
Jan-08
MXMS Index
106.65
127.34
224.13
76%
119%
Source: Bloomberg
Source: Bloomberg
Source: Bloomberg
If not now then When? Page 18
KOREA - The correlation between GDP Growth and Stock Market Index
-12%
-8%
-4%
0%
4%
8%
12%
1997 1998 1999 2000 2001 2002 2003 2004 2005 2006 2007
-60%
-10%
40%
90%
140%
Nominal GDP Growth Real GDP Growth KOREACTU INDEX
CHINA - The correlation between GDP Growth and Stock Market Index
0
5
10
15
20
25
30
35
40
1997 1998 1999 2000 2001 2002 2003 2004 2005 2006 2007
-40
-20
0
20
40
60
80
100
Nominal GDP Growth Real GDP Growth Change in Shenshen Index
APPENDIX 2 – THE CORRELATION BETWEEN GDP GROWTH AND STOCK MARKET
INDEX:
KOREA, CHINA, PHILIPPINES, MALAYSIA AND INDONESIA
Source: Bloomberg
Source: Bloomberg
KOREA
CHINA
Correlation: 0.477
Correlation: 0.186
If not now then When? Page 19
PHILIPPINES - The correlation between GDP Growth and Stock Market Index
-5
0
5
10
15
20
1997 1998 1999 2000 2001 2002 2003 2004 2005 2006 2007
-60
-40
-20
0
20
40
60
80
Nominal GDP Growth Real GDP Growth MSEUSPHF INDEX
Source: Bloomberg
Source: Bloomberg
PHILIPPINES
MALAYSIA - The correlation between GDP Growth and Stock Market Index
-10
-5
0
5
10
15
20
25
1997 1998 1999 2000 2001 2002 2003 2004 2005 2006 2007
-40
-20
0
20
40
60
80
100
120
Nominal GDP Growth Real GDP Growth MSDUMAP INDEX
MALAYSIA
Correlation: 0.222
Correlation: 0.426
If not now then When? Page 20
Source: Bloomberg
INDONESIA - The correlation between GDP Growth and Stock Market Index
0
5
10
15
20
25
30
2001 2002 2003 2004 2005 2006 2007
-40
-20
0
20
40
60
80
Nominal GDP Growth Real GDP Growth MSDUMAP INDEX
INDONESIA
Correlation: 0.831