Flow injection analysis of some oxidants using spectrophotometric detection
Bạn đang xem bản rút gọn của tài liệu. Xem và tải ngay bản đầy đủ của tài liệu tại đây (1.57 MB, 10 trang )
REVIEW
Flow injection analysis of some oxidants
using spectrophotometric detection
Ibrahim Z. AL-Zamil
*
, Mohamed A. Abdalla, Turki S. AL-Khulaiwi
Chemistry Department, College of Science, King Saud University, P.O. Box 2455, Riyadh 11451, Saudi Arabia
Received 25 October 2011; accepted 27 October 2011
Available online 3 December 2011
KEYWORDS
Flow injection;
Spectrophotometry;
Iodate;
Periodate;
Permanganate;
Hydrogen peroxide
Abstract A spectrophotometric flow-injection method has been devised for the determination of
nanomole quantities of some oxidants i.e. iodate, periodate, permanganate and hydrogen peroxide.
The method is based on the oxidation of iron(II) to iron(III) and the measurement of the absor-
bance of the red iron(III)–thiocyanate complex at 485 nm. The optimal oxidation pH and the lin-
earity ranges of the calibration curves have been investigated. The analytical aspects of the method
including the statistical evaluation of the results are discussed. The analysis of some authentic sam-
ples showed an average percentage recovery of 99%.
ª 2011 Production and hosting by Elsevier B.V. on behalf of King Saud University.
Contents
1. Introduction . . . . . . . . . . . . . . . . . . . . . . . . . . . . . . . . . . . . . . . . . . . . . . . . . . . . . . . . . . . . . . . . . . . . . . . . . . . 600
2. Experimental. . . . . . . . . . . . . . . . . . . . . . . . . . . . . . . . . . . . . . . . . . . . . . . . . . . . . . . . . . . . . . . . . . . . . . . . . . . 602
2.1. Reagents and chemicals . . . . . . . . . . . . . . . . . . . . . . . . . . . . . . . . . . . . . . . . . . . . . . . . . . . . . . . . . . . . . . 602
2.2. Instrumentation . . . . . . . . . . . . . . . . . . . . . . . . . . . . . . . . . . . . . . . . . . . . . . . . . . . . . . . . . . . . . . . . . . . . 603
2.3. General procedures . . . . . . . . . . . . . . . . . . . . . . . . . . . . . . . . . . . . . . . . . . . . . . . . . . . . . . . . . . . . . . . . . 603
3. Preliminary investigations. . . . . . . . . . . . . . . . . . . . . . . . . . . . . . . . . . . . . . . . . . . . . . . . . . . . . . . . . . . . . . . . . . 603
4. Results and discussion . . . . . . . . . . . . . . . . . . . . . . . . . . . . . . . . . . . . . . . . . . . . . . . . . . . . . . . . . . . . . . . . . . . . 604
4.1. Determination of iodate or periodate. . . . . . . . . . . . . . . . . . . . . . . . . . . . . . . . . . . . . . . . . . . . . . . . . . . . . 604
4.2. Determination of hydrogen peroxide . . . . . . . . . . . . . . . . . . . . . . . . . . . . . . . . . . . . . . . . . . . . . . . . . . . . . 605
4.3. Determination of permanganate . . . . . . . . . . . . . . . . . . . . . . . . . . . . . . . . . . . . . . . . . . . . . . . . . . . . . . . . 606
*
Corresponding author.
E-mail address: (I.Z. AL-Zamil).
Peer review under responsibility of King Saud University.
Production and hosting by Elsevier
Arabian Journal of Chemistry (2015) 8, 599–608
King Saud University
Arabian Journal of Chemistry
www.ksu.edu.sa
www.sciencedirect.com
1878-5352 ª 2011 Production and hosting by Elsevier B.V. on behalf of King Saud University.
/>5. Conclusion . . . . . . . . . . . . . . . . . . . . . . . . . . . . . . . . . . . . . . . . . . . . . . . . . . . . . . . . . . . . . . . . . . . . . . . . . . . . 606
References . . . . . . . . . . . . . . . . . . . . . . . . . . . . . . . . . . . . . . . . . . . . . . . . . . . . . . . . . . . . . . . . . . . . . . . . . . . . 608
1. Introduction
Numerous conventional methods for the determination of io-
date, periodate, permanganate and hydrogen peroxide have
been reported (Abdul Hug and Rao, 1984; Al-Zamil, 1984; Ra-
him and Bashir, 1984; Garrido et al., 1986). Iodate and perio-
date were spectrophotometrically determined by methods
based on the oxidation of iron(II) in the presence of dipyridyl-
glyoxal dithisemicarbazone as a spectrophotometric reagent
(Garrido et al., 1986)orFeðCNÞ
4À
6
to form prussian blue (Ra-
him and Bashir, 1984). AL-Zamil consecutively determined
periodate and iodate by indirect titration with EDTA at differ-
ent acidic media (Al-Zamil, 1984). Permanganate, iodate and
periodate have been determined by their oxidation of iron(II)
and the formation of iron(III)–resacetophenone oxime red
complex (Abdul Hug and Rao, 1984). However, the published
flow-injection methods for the determinations of iodate (Chen
et al., 1991; Oguma et al., 1993; Yagoob et al., 1991; Xie and
Jingchan, 2004), periodate (Berzas-Nevado and Valiente-
Gonzalez, 1989; Evmiridis, 1989) and permanganate (Al muai-
Injection port (oxidant)
Fe(II)
SCN
Pump
Spectrophotometer
Recorder
Waste
a
R1
2R
b
a: Oxidation Coil.
b: Complexing Coil
Valve
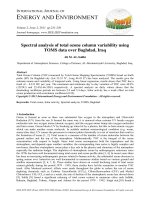
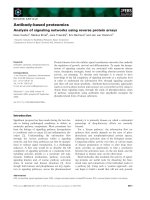
Figure 1 A schematic diagram of the manifold used for the presented work.
Table 2 The oxidation of 0.1 M iron(II), prepared in different
concentrations of hydrochloric acid, by either iodate or
periodate (4 · 10
À5
M each).
HCl (pH) Absorbance of iron(III)–thiocyanate complex (mv)
IO
À
3
IO
À
4
4.00 No response 40
3.50 No response 70
2.50 No response 95
1.95 75 140
1.50 184 285
1.00 190 279
Table 1 The oxidation of 0.1 M iron(II) by various oxidants
(4 · 10
À5
M each) in different sulfuric acid media.
Oxidant 4 · 10
À5
M Absorbance of iron(III)–thiocyanate
complex (mv)
in 0.01 M H
2
SO
4
in 2 M H
2
SO
4
Cr
2
O
2À
7
181 261
MnO
À
4
183 194
NO
À
3
No response –
NO
À
3
a
– 555
NO
À
2
20 242
IO
À
4
59 242
IO
À
3
10 180
I
À
No response No response
H
2
O
2
80 90
a
4 · 10
À4
MNO
À
3
600 I.Z. AL-Zamil et al.
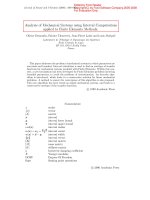
Figure 2 Calibration measurements of 2–10 · 10
À5
MIO
À
4
at pH 3.5 including some authentic samples.
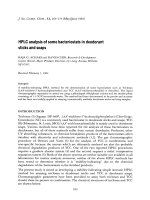
Figure 3 Calibration graphs for the determination of IO
À
3
and IO
À
4
in the range 3–14 · 10
À5
M each at pH = 1.5 and for IO
À
4
in the
range 4–10 · 10
À5
at pH 3.5.
Flow injection analysis of some oxidants using spectrophotometric detection 601
bed and Townshend, 1995; Thorburn-Burns et al., 1992) are
few. The oxidation of tris 1,10-phenanthroline–iron(II) com-
plex by permanganate was used for the determination of the lat-
ter by spectrophotometric flow injection analysis (Al muaibed
and Townshend, 1995). Few flow injection analysis methods
have been suggested for the determination of hydrogen perox-
ide (Olsson, 1982; Vieira and Fatibello-Filho, 1998; Mifune
et al., 1998; Almuaibed and Townshend, 1994; Ishibashi
et al., 1992; Chen et al., 2011; Roselyn et al., 2009) most of
which are based on either the formation of a colored compound
or a chemiluminescence reaction involving luminal. Hydrogen
peroxide and other oxidants have been determined by potenti-
ometric flow injection analysis methods based on a redox reac-
tion with an iron(II)–iron(III) couple (Ishibashi et al., 1992).
The proposed work for the flow injection spectrophotomet-
ric determination of some oxidants i.e. iodate, periodate, per-
manganate and hydrogen peroxide is based on the oxidation
of iron(II) to iron(III) and the measurement of the absorbance
of the red iron(III)–thiocyanate complex at 485 nm (Al-Khu-
laiwi et al., 2001; AL-Zamil et al., 2001).
2. Experimental
2.1. Reagents and chemicals
All reagents used were of analytical grade. Distilled/deionized
water was used throughout this work. The hydrochloric acid
stock solution was prepared using HCl (AR), BDH from
England. Iron(II) stock solution of 0.2 M (NH
4
)
2
Fe(SO
4
)
2
,
crystals extrapure, Merck, Germany, was prepared every
day in 0.5 M hydrochloric acid. The working solution was
prepared just before use and passed over a Jones Reductor
to eliminate air-oxidation. 1 M Thiocyanate stock solution
was prepared using potassium thiocyanate crystal pure,
Merck, Germany. Iodate (KIO
3
), periodate (KIO
4
), iodide
(K), permanganate (KMnO
4
), nitrate (NaNO
3
) and nitrite
(NaNO
2
) stock solutions (0.1 M of each) were all AR from
BDH, England). Hydrogen peroxide stock solution was pre-
pared using H
2
O
2
win lab 3% and sulfuric acid stock solu-
tion was prepared from 98.0% H
2
SO
4
(AR) BDH from
England.
Table 3 The analysis of some authentic samples of IO
À
4
at pH
3.5 (in the low range) in the presence of 10 · 10
À5
MIO
À
3
.
Taken (M) Taken (M) Found (M) Recovery (%)
Sample 1 5 · 10
À5
4.7 · 10
À5
94
Sample 2 7 · 10
À5
7 · 10
À5
100
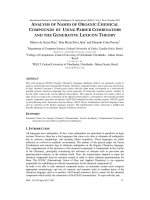
Figure 4 Calibration measurements of 3–14 · 10
À5
MIO
À
4
at pH 1.5.
602 I.Z. AL-Zamil et al.
2.2. Instrumentation
The manifold used is illustrated in Fig. 1. The flow was produced
with a Gilson Minipulse 3 peristaltic 4 channel pump and injec-
tions were made with Rheodyne 5020 injection port. The system
was connected to a Helma flow cell by Teflon tubing of 0.58 mm.
The absorbance was measured using LKB Biochem Ultraspec
(II) 4045 single beam ultraviolet-visible spectrophotometer
which was connected to a Perkin Elmer recorded 56.
2.3. General procedures
Channel R
1
in Fig. 1 was used to deliver the 0.1 M iron(II) at the
required pH. The analyte (i.e. IO
À
3
: IO
À
4
; MnO
À
4
or H
2
O
2
) was
injected at the injection port. A reaction coil of 150 cm long Tef-
lon tubing (coil a in Fig. 1) was used to complete the oxidation of
iron(II) by the analyte to iron(III). Then the stream R1 was
merged with R2 stream which is carrying 1 M thiocyanate solu-
tion in water. The blood red thiocyanate–iron(III) complex was
formed in coil b of Fig. 1 which was 70 cm long. The absorbance
of this complex which was directly proportional to the analyte
concentration was measured at 485 nm as a peak. Each result
was an average of three replicate measurements.
3. Preliminary investigations
All the conditions that were previously optimized [17–18] were
used in this work i.e. thiocyanate = 1 M in 0.5 M HCl, flow
rate = 1.3 ml/min, oxidation coil length = 150 cm, iron(III)–
thiocyanate complex coil length = 70 cm and sample vol-
ume = 0.41 ml. The solution of an oxidant (4 · 10
À5
M) was
injected into a stream of 0.1 M iron(II) prepared in different
sulfuric acid solutions and the absorbance of the iron(III)–
thiocyanate complex was measured at 485 nm. The results
are shown in Table 1. These results indicate that 4 · 10
À5
M
of Cr
2
O
2
7
, MnO
À
4
; IO
À
4
or H
2
O
2
oxidized iron(II) to iron(III)
in both acidic media (i.e. 0.01 M and 2 M H
2
SO
4
), but the oxi-
dation was more complete and probably faster in 2 M H
2
SO
4
compared to that in 0.0 M H
2
SO
4
, while iodide did not show
any response in both acidic media. Nitrite produced only little
iron(III) in both media while 4 · 10
À5
MNO
À
3
did not oxidize
iron(II) in 0.01 M H
2
SO
4
and only 4 · 10
À4
MNO
À
3
show oxi-
dation of iron(II) in 2 M H
2
SO
4
. This is probably due to the
low standard potentials for both NO
À
2
and NO
3
. Therefore,
NO
À
2
can be determined in the presence of low concentration
of NO
À
3
<4· 10
À5
M in 0.01 M H
2
SO
4
by this method.
Cr
2
O
2À
7
þ 6Fe
2þ
þ 14H
þ
2Cr
3þ
þ 6Fe
3þ
þ 7H
2
O
NO
À
2
þ 2Fe
2þ
þ 2H
þ
NOðgÞþ2Fe
3þ
þ H
2
O
Figure 5 Calibration measurements of 3–14 · 10
À5
MIO
À
3
at pH 1.5 and some authentic samples.
Table 4 Analysis of some authentic samples of IO
À
3
at pH 1.5.
Sample Taken (M) Found (M) Recovery (%)
Sample a 5 · 10
À5
5.2 · 10
À5
104
Sample b 13 · 10
À5
12.9 · 10
À5
99.2
Flow injection analysis of some oxidants using spectrophotometric detection 603
NO
À
3
þ 2Fe
2þ
þ 3H
þ
2Fe
3þ
þ HNO
2
þ H
2
O
The results in Table 1 prove that this method can be applied
to the indirect determination of Cr
2
O
2À
7
; MnO
À
4
; IO
À
4
;
IO
À
3
; NO
À
2
and H
2
O
2
in the 1 · 10
À5
M range or may be lower
and NO
À
3
in the 1 · 10
À4
M range. In this paper, the determi-
nation of some of these oxidants will be investigated.
4. Results and discussion
4.1. Determination of iodate or periodate
The results in Table 1 show that IO
À
3
produced only small
amount of iron(III) in the 0.01 M H
2
SO
4
medium. Therefore,
the effect of acidity on the oxidation of 0.1 M iron(II), pre-
pared in different hydrochloric acid concentrations, by either
IO
À
3
or IO
À
4
was further investigated.
IO
À
4
þ 7Fe
2þ
þ 8H
þ
1=2I
2
þ 7Fe
3þ
þ 4H
2
O
IO
À
4
þ 2Fe
2þ
þ 2H
þ
IO
À
3
þ 2Fe
3þ
þ H
2
O
IO
À
3
þ 5Fe
2þ
þ 6H
þ
1=2I
2
þ 5Fe
3þ
þ 3H
2
O
The results in Table 2 indicate that the oxidation efficiency
of iron(II) to iron(III) by IO
À
4
was increased by increasing the
acidity up to pH 1.5 while IO
À
3
did not oxidize iron(II) at
pH P 2.5, but it did at lower pH.
Figure 7 Calibration graph for the determination of 2–10 · 10
À4
MIO
À
4
at pH 3.5.
Figure 6 Calibration measurements of 2–10 · 10
À4
MIO
À
4
in the presence of 10 · 10
À4
MIO
À
3
at pH 3.5, and some authentic samples.
604 I.Z. AL-Zamil et al.
This fact enables the determination of IO
À
4
in presence of
IO
À
3
at pH P 2.5 and the determination of either ions (IO
À
3
or IO
À
4
) at pH < 1.5.
Calibration measurements for the determination of IO
À
4
in
the 4–10 · 10
À5
M range and in the presence of 10 · 10
À5
M
IO
À
3
using 0.1 M Fe(II) prepared in pH 3.5 (HCl) are shown
in Fig. 2 and are plotted in Fig. 3.
This calibration graph is linear in the examined range and
the best straight line has a slope of 2.01 and a correlation coef-
ficient of 0.999. The results of the analysis of some IO
À
4
authen-
tic samples are shown in Table 3 and Fig. 2. The found results
agree reasonably well with those expected showing an average
percentage recovery of 97%.
The results for the calibration measurements for the deter-
mination of 3–14 · 10
À5
MIO
À
4
at pH 1.5 are shown in Fig. 4
and are plotted in Fig. 3 with a correlation coefficient of 0.998.
These results and statistical evaluations show that IO
À
4
can be
determined more sensitively at pH 1.5 compared with that at
pH 3.5, but, unfortunately IO
À
3
interfered at pH 1.5.
The calibration measurements for the determination of 3–
14 · 10
À5
MIO
À
3
at pH 1.5 (HCl) are shown in Fig. 5 and are
plotted in Fig. 3. The best straight line has a slope of 3.78, an
intercept of 35 and a correlation coefficient of 0.999 which indi-
cate that this method is more sensitive for periodate compared
with iodate. The results for the analysis of IO
À
3
authentic sam-
ples (Table 4 and Fig. 6) agree reasonably well with those ex-
pected showing an average percentage recovery of 101.6%.
The results for the determination of IO
À
4
in higher concen-
tration range (i.e. 2–10 · 10
À4
M) and at pH 3.5 are shown in
Fig. 6 and are plotted in Fig. 7. The statistical evaluation gave
a best straight line with a slope of 1.91, an intercept of 0.128
and a correlation coefficient of 0.998. The results of the
analysis of some authentic samples (Table 5 and Fig. 6) show
a reasonable agreement between the expected results and those
found with an average percentage recovery of 96.5%.
4.2. Determination of hydrogen peroxide
The effect of acidity on the oxidation of iron(II) by hydrogen
peroxide was found to be not critical.
H
2
O
2
þ 2Fe
2þ
þ 2H
þ
2F
3þ
þ 2H
2
O
Table 5 Analysis of some authentic samples of IO
À
4
at pH 3.5
(in the high range).
Sample Taken (M) Found (M) Recovery (%)
Sample C 6 · 10
À4
5.8 · 10
À4
96.7
Sample D 8 · 10
À4
7.7 · 10
À4
96.3
Figure 8 Calibration measurements of 2–8 · 10
À5
MH
2
O
2
and some authentic samples.
Flow injection analysis of some oxidants using spectrophotometric detection 605
The calibration measurements for the determination of
hydrogen peroxide in the range 2–8 · 10
À
M using 0.1 M
iron(II) in 0.25 M HCl and 1 M SCN
À
are shown in Fig. 8
and are plotted in Fig. 9. This calibration graph is linear in
the examined range with a best straight line slope of 2.56, an
intercept of 28.54 and a correlation coefficient of 0.996. The re-
sults of the analysis of some authentic samples of hydrogen
peroxide are shown in Table 6 and in Fig. 8. The found results
agree reasonably will with those expected showing an average
recovery of 98.3%.
The precision of the method was examined by carrying out
10 replicate measurements of 6 · 10
À5
MH
2
O
2
. The calculated
statistical values were, standard deviation = 2.54 and the coef-
ficient of variation = 1.97%.
4.3. Determination of permanganate
The investigation showed that there is no critical difference be-
tween the oxidation of iron(II) by permanganate either in
0.01 M or in 2 M H
2
SO
4
:
MnO
À
4
þ 5Fe
2þ
þ 8H
þ
Mn
2þ
þ 5Fe
3þ
þ 4H
2
O
Therefore, permanganate was determined using 0.1 M iro-
n(II) prepared in 2 M H
2
SO
4
. The calibration measurements
for the determination of MnO
À
4
in the range 1–8 · 10
À5
M
are shown in Fig. 1) and are plotted in Fig. 11. The calibration
graph is linear in the investigated range with a best straight line
equation of (Y = 4.91X À 24.19), a slope of 4.91 and a corre-
lation coefficient of 0.999.
The analysis of some authentic samples of permanganate by
this new method gave an average percentage recovery of
99.3% (Table 7 and Fig. 10) which is analytically good and
acceptable.
This new method has been compared with the conven-
tional method that is based on the measurement of the well
known permanganate color at 525 nm (Fig. 10). The calibra-
tion graph of the conventional method results shows a slope
of 2.09 and a correlation coefficient of 0.999 which indicates
that the proposed method is far more sensitive than the con-
ventional method.
5. Conclusion
The statistical evaluation of the obtained results, for the
calibration graphs and for the analysis of some authentic sam-
ples, proves that this proposed method is reasonably accurate,
precise, simple and cheap.
Figure 9 Calibration graph for the determination of 2–10 · 10
À4
MH
2
O
2
at pH 3.5.
Table 6 Analysis of some authentic samples of H
2
O
2
.
Sample Taken (M) Found (M) Recovery (%)
Sample 1 3 · 10
À5
3 · 10
À5
100
Sample 2 4 · 10
À5
3.95 · 10
À5
98.8
Sample 3 5 · 10
À5
4.8 · 10
À5
96
Table 7 Analysis of some authentic samples of MnO
À
4
.
Sample Taken (M) Found (M) Recovery (%)
Sample 1 2.50 · 10
À5
2.45 · 10
À5
98
Sample 2 3.75 · 10
À5
3.65 · 10
À5
97.3
Sample 3 5.5 · 10
À5
5.65 · 10
À5
102.7
606 I.Z. AL-Zamil et al.
Although the main disadvantage of this method, as with all
oxidation methods, is the lack of selectivity, it has been shown
that periodate can be determined in the presence of iodate, and
nitrite in the presence of nitrate.
Figure 10 Calibration measurements of 1–8 · 10
À5
MMnO
À
4
and some authentic samples.
Figure 11 Calibration graphs for the determination of MnO
À
4
in the range 1–8 · 10
À5
M by the proposed and the conventional methods.
Flow injection analysis of some oxidants using spectrophotometric detection 607
The sensitivity of this method, which is in the nanomole
range, is better than some of the published methods that are
used for the same purpose. The sampling rate was 60 injections
per one hour.
References
Abdul Hug, G., Rao, S.B., 1984. J. Inst. Chem. (India) 54 (4), 167–168.
AL-Khulaiwi, Turki S., AL-Zamil, Ibrahim Z., Abdalla, Mohamed A.,
2001. J. Saudi Chem. Soc. 5 (3), 295–302.
Almuaibed, A.M., Townshend, A., 1994. Anal. Chim. Acta 295 (1),
159–163.
Al Muaibed, A.M., Townshend, A., 1995. Microchem. J. 52 (1), 77–80.
Al-Zamil, I.Z., 1984. Anal. Chim. Acta 158 (2), 383–387.
AL-Zamil, Ibrahim Z., AL-Khulaiwi, Turki S., Abdalla, Mohamed A.,
2001. J. Saudi Chem. Soc. 5 (2), 139–150.
Berzas-Nevado, J.J., Valiente-Gonzalez, P., 1989. Analyst (London)
114 (8), 989–990.
Chen, Hui, Lin, Ling, Lin, Zhen, Lu, Chao, Guo, Guangsheng, Lin,
Jinming, 2011. Analyst 136, 1957–1964.
Chen, X., Zhao, X., Kou, Z., Hu, Z., 1991. Microchim. Acta I (5),
279–283.
Evmiridis, N.P., 1989. Talanta 36 (3), 357–362.
Garrido, A., Silva, M., Perez-Bndito, D., 1986. Anal. Chim. Acta 184,
227–234.
Haji Ali, M., Ellis Peter, S., Mckelvie Ian, D., 2011. Food Chem. 129
(2), 704–707.
Ishibashi, N., Imato, T., Yamasaki, S., Ohura, H., 1992. Anal. Chim.
Acta 261 (1), 404–410.
Mifune, M., Mukuno, T., Tani, M., Iwado, A., Odo, J., Motohashi,
N., Saito, Y., 1998. Anal. Sci. 14 (3), 519–522.
Oguma, K., Kitada, K., Kuroda, R., 1993. Mikrochim. Acta 110 (1–3),
71–77.
Olsson, B.O., 1982. Anal. Chim. Acta 136, 113–119.
Rahim, S.A., Bashir, W.A., 1984. Microchem. J. 29 (1), 87–91.
Roselyn, C. Pen
˜
a, Gamboa, Juan C.M., Paixa
˜
o, R.L.C., Bertotti,
Mauro, 2009. Mikrochim. Acta 166 (3–4), 277–281.
Thorburn-Burns, D., Barakat, S.A., El-Shahawi, M.S., Harriott, M.,
1992. Fresenius J. Anal. Chem. 344 (3), 131–132.
Da-Cruz, Vieira Iolanda, Orlando, Fatibello-Filho, 1998. Analyst 123
(9), 1809–1812.
Yagoob, M., Masoom, M., Townshend, A., 1991. Anal. Chim. Acta
248 (1), 219–224.
Xie, Zhihai, Jingchan, Zhao, 2004. Talanta 53 (2), 339–343.
608 I.Z. AL-Zamil et al.