The effect of noble metals on catalytic methanation reaction over supported mn ni oxide based catalysts
Bạn đang xem bản rút gọn của tài liệu. Xem và tải ngay bản đầy đủ của tài liệu tại đây (1.75 MB, 12 trang )
ORIGINAL ARTICLE
The effect of noble metals on catalytic methanation
reaction over supported Mn/Ni oxide based
catalysts
Wan Azelee Wan Abu Bakar
*
, Rusmidah Ali, Nurul Shafeeqa Mohammad
Department of Chemistry, Faculty of Science, Universiti Teknologi Malaysia, 81310 Skudai, Johor, Malaysia
Received 7 December 2012; accepted 9 June 2013
Available online 17 June 2013
KEYWORDS
Carbon dioxide;
Manganese–nickel oxide;
Noble metal;
Methanation;
Natural gas
Abstract Carbon dioxide (CO
2
) in sour natural gas can be removed using green technology via
catalytic methanation reaction by converting CO
2
to methane (CH
4
) gas. Using waste to wealth
concept, production of CH
4
would increase as well as creating environmental friendly approach
for the purification of natural gas. In this research, a series of alumina supported manganese–nickel
oxide based catalysts doped with noble metals such as ruthenium and palladium were prepared by
wetness impregnation method. The prepared catalysts were run catalytic screening process using in-
house built micro reactor coupled with Fourier Transform Infra Red (FTIR) spectroscopy to study
the percentage CO
2
conversion and CH
4
formation analyzed by GC. Ru/Mn/Ni(5:35:60)/Al
2
O
3
cal-
cined at 1000 °C was found to be the potential catalyst which gave 99.74% of CO
2
conversion and
72.36% of CH
4
formation at 400 °C reaction temperature. XRD diffractogram illustrated that the
supported catalyst was in polycrystalline with some amorphous state at 1000 °C calcination temper-
ature with the presence of NiO as active site. According to FESEM micrographs, both fresh and
used catalysts displayed spherical shape with small particle sizes in agglomerated and aggregated
mixture. Nitrogen Adsorption analysis revealed that both catalysts were in mesoporous structures
with BET surface area in the range of 46–60 m
2
/g. All the impurities have been removed at 1000 °C
calcination temperature as presented by FTIR, TGA–DTA and EDX data.
ª 2013 Production and hosting by Elsevier B.V. on behalf of King Saud University.
1. Introduction
To date, methanation reaction has been widely used as a meth-
od of removal carbon dioxide from gas mixtures in hydrogen
or ammonia plants, for purification of hydrogen stream in
refineries and ethylene plants. Nickel is a well established cat-
alyst decades ago since they are known to be active in hydro-
genation, dehydrogenation, hydrotreating and steam
reforming reaction and thus have gained great attention
(Richardson, 1982 and Azadi et al., 2001). Nickel oxide has
*
Corresponding author. Tel.: +60 13 7466213.
E-mail addresses: ,
(W.A. Wan Abu Bakar).
Peer review under responsibility of King Saud University.
Production and hosting by Elsevier
Arabian Journal of Chemistry (2015) 8, 632–643
King Saud University
Arabian Journal of Chemistry
www.ksu.edu.sa
www.sciencedirect.com
1878-5352 ª 2013 Production and hosting by Elsevier B.V. on behalf of King Saud University.
/>been widely used due to high activity and low cost (Mok et al.,
2010). However, most nickel-based catalysts undergo deactiva-
tion due to sintering and carbon deposition during reaction.
Thus, nickel based catalysts are needed to be modified in order
to produce a catalyst resistant towards deactivation. Combina-
tion of nickel catalyst with other transition metal oxides and
other promoters has been reported to be active in many reac-
tions such as catalytic oxidation and steam reforming. Addi-
tion of manganese oxides are effective in decreasing the coke
formation in the dry reforming of methane over Ni/Al
2
O
3
(Park et al., 2010 and Ouaguenouni et al., 2009). Although no-
ble metals such as Ru, Rh, Pd and Pt, are known to give high
activity and selectivity, but because of limited availability and
high cost of them have restricted their applications. In this
work, we modified the nickel oxide based catalyst by incorpo-
rating manganese and noble metals into the system throughout
the impregnation method and applied them in catalytic metha-
nation reaction. Then, the potential catalyst was characterized
using different techniques and tested in the flow of CO
2
and
H
2
.
2. Experimental
2.1. Preparation of catalysts
Impregnation method was used in the production of all cata-
lysts according to the previous work (Wan Abu Bakar et al.,
2010). 5 g Ni(NO
3
)
2
Æ6H
2
O purchased from GCE Laboratory
Lab was dissolved in little amount of distilled water. Mixed
solution was prepared by mixing appropriate amount of
MnCl
2
Æ2H
2
O and noble metal salts (Pd(NO
3
)
2
ÆxH
2
O and
RuCl
3
ÆxH
2
O) according to the desired ratio (40:60, 20:80,
5:35:60, 5:15:80). The solution was stirred continuously for
20 min. Alumina beads with a diameter of 3 mm were im-
mersed in the solution for 20 min as support material in this
study. It was then aged in the oven at 80–90 °C for 24 h. It
was then followed by calcination in the furnace at preferred
calcination temperatures (400, 700 and 1000 °C) for 5 h using
a ramp rate of 5 °C/min in order to remove all the metal pre-
cursors, impurities and excessive of water .
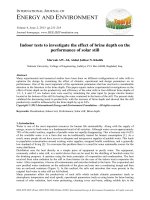
2.2. Catalytic performance test
All the prepared catalysts underwent catalytic screening test to
study their catalytic activity towards CO
2
/H
2
methanation
reaction using in house built micro reactor coupled with FTIR
Nicolet Avatar 370 DTGS as illustrated in Fig. 1. The analysis
was carried out using simulated natural gas comprising of con-
tinuous flow of CO
2
and H
2
in 1:4 ratio with the flow rate of
50 cm
3
/min. The weight hourly space velocity was fixed at
500 mL g
À1
h
À1
.The prepared catalyst was put in the mid of
the glass tube with diameter 10 mm and length of 360 mm.
Glass wool was used at both ends of the Pyrex glass tube
and positioned in the micro reactor furnace for catalytic test-
ing. Heating of the reactor was supplied by a programmable
controller which was connected via a thermocouple placed in
the centre of the furnace. A mass flow controller was used to
adjust the feed of gas flow. The catalytic testing was performed
from 80 °C up to the maximum reaction temperature studied
(400 °C) with the increment of 5 °C/min. The FTIR spectra
were recorded in the range of 4000–450 cm
À1
with 8 scans at
4cm
À1
resolution to maximize the signal to noise (S/N) ratio.
Methane formation was detected by Hewlett Packard 6890
Series GC System (Ultra 1) with 25.0 m · 200 lm · 0.11 lm
nominal columns, with helium (He) gas as the carrier gas with
a flow rate of 20 mL/min at 75 kPa, and Flame Ionization
Detector (FID).
2.3. Characterization of catalysts
XRD analysis was conducted using a Siemens D5000 Crystal-
loflex X-ray Diffractometer equipped with Cu target (k Cu-
Ka = 1.54 A
˚
) radiation between 20° to 80° (2h) running at
40 kV and 40 A. The morphology of catalysts was visualized
using a Field Emission Scanning Electron Microscope (FES-
EM) coupled with EDX analyzer for semi quantitative compo-
sition. The Nitrogen Adsorption analysis was obtained
throughout Micromeritics ASAP 2010. Functional group pres-
ent was detected by Fourier Transform Infra-Red (FTIR).
Thermal stability of desired catalyst was carried out by
TGA–DTA analysis.
3. Results and discussion
3.1. Catalytic performance on CO
2
/H
2
methanation reaction
3.1.1. Catalytic activity screening of alumina supported nickel
oxide based calcined at 400 °C for 5 h
The supported monometallic oxide catalyst (Ni/Al
2
O
3
, Mn/
Al
2
O
3,
Ru/Al
2
O
3
and Pd/Al
2
O
3
) calcined at 400 °C showed
very low catalytic activity towards CO
2
/H
2
methanation reac-
tion. Ni/Al
2
O
3
catalyst gave a high CO
2
conversion of 13.30%
at maximum reaction temperature studied compared to the
other oxides catalysts (Table 1). These catalysts did not able
to achieve high conversion at low reaction temperature how-
ever they showed the capability to be used in methanation
reaction. Thus by incorporating manganese and noble metals
into system, they would enhance the catalytic activity.
Referring to Table 1, it can be observed that the addition of
Mn slightly increased the catalytic performance compared to
the monometallic oxide (Ni/Al
2
O
3
) catalyst. At 400 °C reaction
temperature, Mn/Ni(20:80)/Al
2
O
3
catalyst gave 17.50% of CO
2
conversion while Mn/Ni(40:60)/Al
2
O
3
catalyst was able to ob-
tain 15.30% conversion only. It is probably due to the largest
amount of dopant blocking the pores structure of the catalyst
and thus decreasing the activity. Besides, the catalytic perfor-
mance of both Ru/Ni(20:80)/Al
2
O
3
and Pd/Ni(20:80)/Al
2
O
3
catalysts also increased in a little amount. As can be noticed
in Table 1, these bimetallic oxide catalysts have a low percent-
age of CO
2
conversion (<18%). Thus, alumina supported
manganese–nickel oxide based catalyst was modified by incor-
porating with noble metal, ruthenium and palladium to study
their effect towards the catalytic activity.
Incorporating palladium (Pd) into this catalyst (Pd/Mn/
Ni(5:35:60)/Al
2
O
3
) slightly increased the catalytic performance
towards CO
2
conversion up to 25.30%. Meanwhile, when
ruthenium (Ru/Mn/Ni(5:35:60)/Al
2
O
3
) was added as a co-dop-
ant further reduction of catalytic performance was observed
which only gives 14.00% CO
2
conversion. The decreasing per-
formance of this catalyst could be due to the Ru precursor,
RuCl
3
.xH
2
O used in this research. A small amount of chloride
ion present in Ru/Al
2
O
3
catalyst could give poisoning effect to
The effect of noble metals on catalytic methanation reaction over supported Mn/Ni oxide based catalysts 633
the catalyst and thus lead to decrease active sites on the surface
of Ru catalyst. A similar finding was concluded by Nurunnabi
et al. (2008). The residual chloride ions formed partition be-
tween the support and metal and thus, inhibits both CO and
hydrogen chemisorption phenomena on the catalyst surface.
Chloride precursor can be observed in the as-synthesis of
Ru/Mn/Ni(5:35:60)/Al
2
O
3
catalyst as shown in EDX data
(Table 5).
When nickel loading was increased up to 80 wt%, the per-
formance of the catalyst also increased with the increasing
temperature reaction. The addition of palladium into this cat-
alyst which is Pd/Mn/Ni(5:15:80)/Al
2
O
3
, coincidentally en-
hanced the catalytic activity of CO
2
conversion. Only 5.20%
of CO
2
conversion at 100 °C reaction temperature increased
to 49.00% at 400 °C reaction temperature. This suggests that
a small amount of Pd can play important role in enhancing
the catalytic activity. A study by Baylet et al. (2008) found that
addition of palladium to the alumina support material gives
sufficient absorption for CO
2
dissociation process which is
due to the increasing active sites on catalyst surface. As ex-
pected, the addition of ruthenium into the catalyst also would
increase the catalytic performance but slightly lower than the
addition of palladium. Only 32.50% of CO
2
conversion was
achieved at maximum studied temperature of 400 °C.
3.1.2. Catalytic activity screening of alumina supported nickel
oxide based catalysts calcined at 700 °C for 5 h
The potential catalysts were further studied at 700 °C calcina-
tion temperature and the results are summarized in Table 2.At
this stage, Ni(1 0 0)/Al
2
O
3
catalyst displayed a slight increase in
activity compare to the similar catalyst calcined at 400 °C. The
addition of manganese into the system (Mn/Ni/Al
2
O
3
cata-
lyst), only 20% of CO
2
had been converted.
It can be observed that Pd/Mn/Ni(5:15:80)/Al
2
O
3
shows
the highest catalytic activity at the maximum reaction temper-
ature of 400 °C. However, Pd/Mn/Ni(5:35:60)/Al
2
O
3
showed
lower activity (24.40%) compared to the other catalyst (Pd/
Mn/Ni(5:15:80)/Al
2
O
3
). When ruthenium was used as co-dop-
ant in Ru/Mn/Ni(5:35:60)/Al
2
O
3
catalyst, it presented an
Figure 1 Schematic diagram of home-built micro reactor coupled with FTIR.
Table 1 Percentage CO
2
conversion over alumina supported
NiO based catalysts calcined at 400 °C for 5 h.
Catalysts Reaction temperature (°C)
100 200 300 400
%CO
2
conversion
Monometallic oxide
Ni(100)/Al
2
O
3
4.60 6.20 9.50 13.30
Mn(100)/Al
2
O
3
1.01 1.40 2.08 3.50
Ru(100)/Al
2
O
3
1.40 1.62 2.30 4.42
Pd(100)/Al
2
O
3
2.10 3.34 4.70 7.50
Bimetallic oxide
Mn/Ni(40:60)/Al
2
O
3
4.70 6.80 10.21 15.30
Mn/Ni(20:80)/Al
2
O
3
6.10 8.30 13.40 17.50
Ru/Ni(20:80)/Al
2
O
3
2.30 4.90 5.94 7.21
Pd/Ni(20:80)/Al
2
O
3
2.80 3.30 6.20 9.10
Trimetallic oxide
Pd/Mn/Ni(5:35:60)/Al
2
O
3
3.50 9.30 16.20 25.30
Ru/Mn/Ni(5:35:60)/Al
2
O
3
3.30 5.50 11.00 14.00
Pd/Mn/Ni(5:15:80)/Al
2
O
3
5.20 10.40 22.00 49.00
Ru/Mn/Ni(5:15:80) Al
2
O
3
9.00 17.30 22.70 32.50
Table 2 Percentage CO
2
conversion over alumina supported
nickel oxide based catalysts calcined at 700 °C for 5 h.
Catalysts Reaction temperature (°C)
100 200 300 400
%CO
2
conversion
Monometallic oxide
Ni(100)/Al
2
O
3
2.70 3.42 9.43 15.60
Bimetallic oxide
Mn/Ni(40:60)/Al
2
O
3
2.10 3.40 7.40 18.30
Mn/Ni(20:80)/Al
2
O
3
2.90 3.70 8.42 20.34
Trimetallic oxide
Pd/Mn/Ni(5:35:60)/Al
2
O
3
4.90 12.20 21.20 24.40
Ru/Mn/Ni(5:35:60)/Al
2
O
3
1.60 4.30 10.50 34.00
Pd/Mn/Ni(5:15:80)/Al
2
O
3
7.00 11.00 20.00 36.00
Ru/Mn/Ni(5:15:80)/Al
2
O
3
1.20 4.70 8.90 13.60
634 W.A. Wan Abu Bakar et al.
increase of catalytic performance from 14.00% to 34.00% of
CO
2
conversion when calcined at 400 °C and 700 °C, respec-
tively. In contrast, at similar reaction temperature studied,
the performance of Ru/Mn/Ni(5:15:80)/Al
2
O
3
catalyst was
slightly decreased from 32.50% at calcination temperature of
400 °C to 13.60% at calcination temperature of 700 °C.
This finding was supported by Murata and co-workers
(2009) who studied the effect of Ru and Mn concentration
on the Fischer–Tropsch reaction. They claimed that by
increasing/decreasing Ru or Mn content it will affect the
CO
2
conversion. The results showed that the CO
2
conversion
and selectivity towards CH
4
were 42.9% and 9.10%, respec-
tively using Ru to Mn ratio of 5:10. They also stated that the
high CO
2
conversion was probably due to the Mn species
which causes the removal of Cl ions from RuCl
3
precursor
and increases the density of active Ru oxide species on the
catalyst which resulted in a high catalytic activity. In con-
trast, Ru/Mn/Ni(5:15:80)/Al
2
O
3
catalyst showed a low cata-
lytic performance. It might be due to the calcination
temperature applied on this catalyst cannot prevent the coke
deposition onto the active site of the catalyst. Branford and
Vannice (1998), suggested that reduction temperature more
than 1000 °C is necessary to remove most residual Cl from
supported catalysts.
3.1.3. Catalytic activity screening of alumina supported nickel
based catalysts calcined at 1000 °C for 5 h
Table 3 exhibits the variation of catalytic performance over
alumina supported nickel oxide based catalysts which were cal-
cined at 1000 °C. Monometallic and bimetallic oxide catalysts
exhibit a similar trend with increasing calcination temperature.
The addition of noble metals resulted in decreasing catalytic
activity in both Pd/Mn/Ni(5:35:60)/Al
2
O
3
and Pd/Mn/
Ni(5:15:80)/Al
2
O
3
catalysts. Further reduction might be be-
cause of Mn and Pd was not good oxide combination in
methanation process and it will retard the process. This is in
agreement with Panagiotopoulou et al. (2008) who found that
Pd was found to be the least active catalyst which only gave
less than 5% CO
2
conversion at 450 °C. The atomic size of
Pd (137 pm) is much higher than that of Mn (127 pm). This
may cause pore blockage because of the bigger size of Pd
which retarded the methanation reaction.
Surprisingly, Ru/Mn/Ni(5:35:60)/Al
2
O
3
catalyst showed
the highest catalytic activity among the catalysts. The catalytic
performance of this catalyst keeps on increasing until it reaches
the maximum reaction temperature studied (400 °C). At the
reaction temperature of 100 °C, only 7.50% CO
2
was con-
verted but the performance turns to increase drastically until
it reached 300 °C of reaction temperature. About 99.30% of
CO
2
conversion was observed. At the maximum reaction tem-
perature studied (400 °C), the catalytic activity was increased
to 99.70% of CO
2
conversion. A similar catalytic behaviour
has been observed on the other ratio of Ru/Mn/Ni(5:15:80)/
Al
2
O
3
catalyst calcined at 1000 °C, whereby the conversion is
continuously increasing compared to the performance of sim-
ilar catalyst calcined at 700 °C.
A research done by Samparthar et al. (2006) claimed that
the total pore volume of the calcined samples will decrease
as the loading of the transition metal oxides increases. The
decreasing behaviour of both surface area and total pore vol-
ume with the increasing loading of metal oxides is consistent
due to possible blockage of the inner pores especially the smal-
ler ones. However, this finding cannot be proved in our re-
search due to insufficient data. Similar reason can be applied
to the Pd/Mn/Ni(5:15:80)/Al
2
O
3
catalyst which displays a
decreasing trend with the addition of nickel loading.
The above results suggested that the high calcination tem-
perature activates the catalytic centres of the catalyst, thus
enhancing the activity. The calcination temperatures are criti-
cal for controlling the size of the metal particles and their inter-
action with Al
2
O
3
as suggested by Chen et al. (2009) who
investigated the effect of calcination temperatures on nickel
catalyst for methane decomposition. It was found that when
the calcination temperature increases, the average size of the
crystallites increases and it will help to increase the catalytic
activity towards CO
2
conversion. In conclusion, Ru/Mn/
Ni(5:35:60)/Al
2
O
3
catalyst was selected as potential catalysts
and was further investigated to seek the optimum condition
for this catalyst.
3.2. Optimization of potential catalyst
Using Tables 1–3 as references, Ru/Mn/Ni(5:35:60)/Al
2
O
3
cat-
alyst calcined at 1000 °C was found to be the potential catalyst
Table 3 Percentage CO
2
conversion over alumina supported nickel oxide based catalysts calcined at 1000 °C for 5 h.
Catalysts Reaction temperature (°C)
100 200 300 400
%CO
2
conversion
Monometallic oxide
Ni(100)/Al
2
O
3
8.24 10.10 12.63 17.80
Bimetallic oxide
Mn/Ni(40:60)/Al
2
O
3
9.30 13.80 17.24 20.10
Mn/Ni(20:80)/Al
2
O
3
11.60 15.70 19.40 21.30
Trimetallic oxide
Pd/Mn/Ni(5:35:60)/Al
2
O
3
5.00 4.80 12.00 21.00
Ru/Mn/Ni(5:35:60)/Al
2
O
3
7.50 25.00 99.30 99.70
Pd/Mn/Ni(5:15:80)/Al
2
O
3
6.00 7.60 9.30 13.00
Ru/Mn/Ni(5:15:80)/Al
2
O
3
9.10 13.60 21.50 51.00
The effect of noble metals on catalytic methanation reaction over supported Mn/Ni oxide based catalysts 635
for CO
2
/H
2
methanation reaction. Several optimization
parameters were conducted on this catalyst including the effect
of various compositions of catalyst, various calcination tem-
peratures, effect of H
2
S gas, reproducibility and stability
testing.
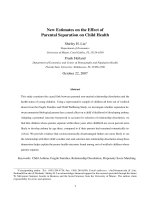
3.2.1. Effect of various compositions of prepared catalyst
In order to determine the effect of various compositions to-
wards the catalytic activity, 55–70 wt% of nickel loadings have
been used in this research. The detailed trend plot of catalytic
performance over Ru/Mn/Ni(5:35:60)/Al
2
O
3
catalyst towards
the percentage CO
2
conversion is displayed in Fig. 2. Gener-
ally, all the catalysts prepared showed lower performance of
CO
2
conversion at low reaction temperature but started to in-
crease drastically from 200 °C until maximum studied reaction
temperature of 400 °C.
It can be seen that Ru/Mn/Ni(5:40:55)/Al
2
O
3
catalyst only
gave 15.54% CO
2
conversion at 200 °C reaction temperature.
By raising the nickel content to 60 wt%, the conversion of
CO
2
increased to 25.00%. However, the catalytic performance
was reduced to 18.33% with the increasing of Ni loading to
70 wt% in the Ru/Mn/Ni(5:25:70)/Al
2
O
3
catalyst. Mostly,
these catalysts achieved more than 99% of CO
2
conversion
at 300 °C reaction temperature. Catalyst labelled as Ru/Mn/
Ni/Al
2
O
3
with the ratio of 5:35:60 had been preferred to be
the optimum ratio as it showed better performance at low reac-
tion temperature.
From the catalytic performance, it can be concluded that
the composition of the catalyst might cause the alteration of
catalyst structure which is highly related to the catalytic per-
formance and selectivity towards methanation reaction. Due
to the high capability of Ru/Mn/Ni(5:35:60)/Al
2
O
3
catalyst
which contributed to high performance, this catalyst was
Figure 2 Catalytic performance of CO
2
conversion for CO
2
/H
2
methanation reaction over Ru/Mn/Ni/Al
2
O
3
catalyst at different
compositions calcined at 1000 °C for 5 h.
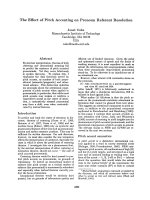
Figure 3 Catalytic performance of CO
2
conversion for CO
2
/H
2
methanation reaction over Ru/Mn/Ni(5:35:60)/Al
2
O
3
catalysts
calcined at various calcination temperatures for 5 h.
Table 4 The product and by product of CO
2
/H
2
methanation over Ru/Mn/Ni(5:35:60)/Al
2
O
3
catalyst calcined at 1000 °C for 5 h
detected by GC.
Catalysts Reaction temperature (°C) CO
2
conversion (%) Unreacted CO
2
(%)
*
Product CH
4
By-product CO + H
2
O
Ru/Mn/Ni(5:35:60)/Al
2
O
3
100 0.00 5.88 94.12
200 15.26 5.04 79.70
300 29.52 69.45 0.31
400 72.36 27.38 0.26
*
Unreacted CO
2
gas was calculated using FTIR analysis.
636 W.A. Wan Abu Bakar et al.
further studied on the next parameter; the effect of various cal-
cination temperatures.
3.2.2. Effect of different calcination temperatures
This parameter was conducted to determine the effect of var-
ious calcination temperatures on the most potential catalysts.
Ru/Mn/Ni(5:35:60)/Al
2
O
3
catalyst was prepared and coated
on alumina support and then aged for 24 h before further cal-
cined at three different temperatures of 900, 1000 and
1100 °C. Fig. 3 indicates the trend plot of catalytic activity
over Ru/Mn/Ni(5:35:60)/Al
2
O
3
catalyst at various calcination
temperatures.
All the catalysts show increasing catalytic activity with the
rise of reaction temperature. It has been revealed that the
highest CO
2
conversion was obtained by Ru/Mn/
Ni(5:35:60)/Al
2
O
3
catalyst which was calcined at 1000 °C.
From 25.00% of CO
2
conversion at 200 °C reaction temper-
ature, it increased drastically to 99.70% conversion at the
maximum reaction temperature studied (400 °C). However,
the percentage of CO
2
conversion was slightly decreased to
99.20% at 400 when the catalyst was calcined at 1100 °C.
Meanwhile, at 900 °C calcination temperature, about
96.40% of CO
2
conversion can be obtained at similar reac-
tion temperature.
The high temperature used during calcination could cause
agglomeration of catalyst particles thus forming larger crystal-
lite and decreasing the surface area, consequently producing
less active catalyst. According to Oh et al. (2007) the growth
of crystallite size and morphology of the catalyst surface have
strong relationship with calcination temperatures. This was in
a good agreement with XRD diffractogram and FESEM mor-
phology as will be discussed in characterization section after
this.
Thus, it can be concluded that 1000 °C was the optimum
calcination temperature over Ru/Mn/Ni(5:35:60)/Al
2
O
3
cata-
lyst. Both catalysts were then tested in the presence of H
2
S
gas in the gas mixtures.
3.2.3. Effect of H
2
S gas over Ru/Mn/Ni(5:35:60)/Al
2
O
3
catalyst
Durability testing of catalyst is an important factor for the
practical use of catalysts. Hence, this test was carried out in
the H
2
/CO
2
gas mixture with a small amount of poison gas
(H
2
S), which commonly leads to deactivation of the catalyst.
In this experiment, the respective catalyst was fed by 1% of
H
2
S gas during catalytic reaction. Fig. 4 indicates the compar-
ison of catalytic activity with or without the presence of H
2
S
gas over Ru/Mn/Ni(5:35:60)/Al
2
O
3
catalyst.
The Ru/Mn/Ni(5:35:60)/Al
2
O
3
catalyst was not able to
achieve 100% H
2
S desulfurization as shown in Fig. 4. It can
only convert 41% of H
2
S to elemental sulfur at 100 °C reaction
temperature and increased up to 86% at the 300 °C reaction
temperature studied. After 300 °C reaction temperature, the
catalyst started to deactivate due to the sulfur deposition on
the catalyst surface. Consequently, the CO
2
conversion over
Ru/Mn/Ni(5:35:60)/Al
2
O
3
catalyst decreased significantly in
the presence of hydrogen sulfide gas mixtures from 99.70%
(without H
2
S) to 7.5% (with H
2
S).
The deterioration of the catalyst occurred at higher reac-
tion temperature owing to sulfur formation which had cov-
ered the surface catalyst thus avoiding the next flowing H
2
S
to be converted hence retard the reduction of CO
2
during
methanation reaction (Wan Abu Bakar et al., 2011). More-
over, a research done by Dokmaingam et al. (2007) also sup-
ports our finding because similar phenomenon occurred in
their methane steam reforming reaction in which their activ-
ity rate dramatically decreased over Ni/Al
2
O
3
and Ni/CeO
2
in
the presence of H
2
S due to the sulfidation on the surface of
the catalysts.
Unexpectedly, carbon monoxide has been observed in
FTIR spectrum during reaction in the presence of H
2
S gas.
It is probably because of incomplete reaction between CO
2
and H
2
which tends to form CO as intermediate species (not
Figure 4 Effect of the presence of H
2
S gas over Ru/Mn/Ni(5:35:60)/Al
2
O
3
catalyst calcined at 1000 °C for 5 h.
Figure 5 Trend plot of reproducibility testing over Ru/Mn/
Ni(5:35:60)/Al
2
O
3
catalyst calcined at 1000 °C for 5 h toward CO
2
conversion from methanation reaction.
The effect of noble metals on catalytic methanation reaction over supported Mn/Ni oxide based catalysts 637
shown). No methane peak can be distinguished. The toxic H
2
S
gas will prevent the catalyst to convert reactant gases; CO
2
and
H
2
to produce methane.
3.2.4. Reproducibility test towards potential catalyst
The reproducibility of catalytic activity over Ru/Mn/
Ni(5:35:60)/Al
2
O
3
catalyst was tested using the similar poten-
tial catalyst for several times until the catalyst deactivated.
Fig. 5 shows the trend plot of reproducibility testing over
Ru/Mn/Ni(5:35:60)/Al
2
O
3
catalyst.
Below 200 °C of reaction temperature, it can be seen that
the percentage CO
2
conversion was slightly lower than
26.00%. Interestingly, increasing the temperature above
200 °C, a sharp inclination occurred and achieved 99%
CO
2
conversion at 280 °C reaction temperature and contin-
uously to do so until it reached the maximum reaction tem-
perature studied (400 °C). It can be distinguished that from
1st test until 7th test, the catalytic performance was almost
similar. However, after the seventh testing, catalytic activity
slightly decreased to 55% CO
2
conversion at 280 °C reac-
tion temperature but still active at high reaction tempera-
ture. It is probably due to the surface of catalyst which
was covered by CO
2
thus slightly decreasing the catalytic
performance.
3.2.5. Stability testing over the Ru/Mn/Ni(5:35:60)/Al
2
O
3
catalyst
The catalytic stability of the potential Ru/Mn/Ni(5:35:60)/
Al
2
O
3
catalyst was investigated on stream for 5 h continuously
at 250 °C reaction temperature as presented in Fig. 6. The Ru/
Mn/Ni(5:35:60)/Al
2
O
3
catalysts showed a good stability which
was maintained unaffected for 5 h of maximum monitoring
reaction time without deterioration by carbon. The CO
2
con-
version of Ru/Mn/Ni(5:35:60)/Al
2
O
3
catalyst was maintained
at almost 100% throughout the reaction time.
Even though nickel oxide catalyst is easily deactivated by
carbon deposition, the addition of manganese and ruthenium
would assist the catalyst to be stable during the reaction. This
was in good agreement with Zhao et al. (2012) who found that
modifying nickel based with manganese significantly leads to
the most stable catalyst compared to the unmodified NiO/
Al
2
O
3
catalyst. From these results, it can be concluded that
the Ru/Mn/Ni(5:35:60)/Al
2
O
3
catalyst is still active and stable
even if it was left on for 5 h under high reaction temperature.
3.2.6. Methane gas formation measurement via gas
chromatography
The reactor gas product from FTIR cell was collected and
analyzed for CH
4
formation. The methane formation was
Figure 6 Stability test over Ru/Mn/Ni(5:35:60)/Al
2
O
3
catalyst calcined at 1000 °C for 5 h at 250 °C reaction temperature.
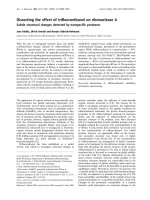
Figure 7 XRD patterns of Ru/Mn/Ni(5:35:60)/Al
2
O
3
catalysts calcined at 1000 °C for 5 h.
638 W.A. Wan Abu Bakar et al.
determined via GC because of low sensitivity of FTIR spec-
troscopy towards methane stretching region. Table 4 shows
the catalytic activity of CO
2
/H
2
methanation over the potential
Ru/Mn/Ni(5:35:60)/Al
2
O
3
catalyst.
There are three possible products obtained during CO
2
/H
2
methanation reaction namely carbon monoxide, water and
methane. A trend could be noticed that the percentage of unre-
acted CO
2
decreased as the CO
2
was converted to H
2
O, CO
and CH
4
. Besides, the formation of CH
4
also increased as reac-
tion temperature increased. In the Ru/Mn/Ni(5:35:60)/Al
2
O
3
catalyst, none of methane production has been observed at
100 °C reaction temperature but converted CO
2
tends to yield
by- products such as CO and H
2
O. The higher methane forma-
tion was reached at 400 °C with 72.36%.
These results are in a good agreement with Yaccato et al.
(2005) who found that at lower temperature, methanation
reaction tends to yield CO and at higher reaction temperature
CH
4
was formed. The higher methane formation was reached
at 250 °C with 76%. Higher methane has been produced pos-
sibly attributed to the rapid hydrogenation of intermediate CO
species resulting in higher CO
2
methanation activities at this
temperature.
3.3. Characterization of potential catalyst on methanation
reaction
3.3.1. The effect of catalytic testing over Ru/Mn/Ni(5:35:60)/
Al
2
O
3
catalyst calcined at 1000 °C for 5 h by XRD analysis
Fig. 7 shows the XRD patterns for potential Ru/Mn/
Ni(5:35:60)/Al
2
O
3
catalyst which was calcined at 1000 °C for
5 h. XRD diffractograms for used catalysts were found to be
similar with fresh catalyst in which owing polycrystalline with
some amorphous phase in nature.
The XRD pattern over Ru/Mn/Ni(5:35:60)/Al
2
O
3
catalyst
calcined at 1000 °C in fresh condition showed the presence
of several oxides on the surface catalyst. High crystallinity of
rhombohedral Al
2
O
3
can be observed at 2h of 35.10 (I
100
),
43.34 (I
94
), 57.48 (I
79
), 25.56 (I
74
), 37.70 (I
45
), 52.50 (I
42
),
68.17 (I
41
) and 66.37° (I
28
) with d values of 2.55, 2.08, 1.60,
3.47, 2.38, 1.74, 1.37 and 1.40 A
˚
(PDF d values of 2.55, 2.08,
1.60, 3.48, 2.38, 1.74, 1.37 and 1.40 A
˚
). However, there is some
amorphous character within the crystalline peak which belongs
to the alumina cubic indicating the smaller particle sizes owing
to the respective catalyst. Interestingly, new peaks attributable
to the NiO rhombohedral phase species were observed at 2h of
43.40 (I
98
) and 37.38 (I
95
) with d values of 2.08 and 2.40 A
˚
(PDF d values of 2.08 and 2.41 A
˚
). Meanwhile, RuO
2
tetrago-
nal species intensely located at 2h of 35.19 (I
100
), 28.10 (I
32
)
and 54.44 (I
19
) with d values of 2.55, 3.17 and 1.68 A
˚
d values of 2.55, 3.17 and 1.68 A
˚
)were observed. However,
the intensity for MnO
2
tetragonal was very small and hardly
distinguished from the background noise. It is probably be-
cause of MnO
2
present in low quantities and overlapped with
other species thus less sensitive towards XRD analysis. Unex-
pectedly, two peaks assigned as NiAl
2
O
4
species have been de-
tected at 2h of 37.38 (I
100
) and 65.64°(I
43
) with d values of 2.40
and 1.42 A
˚
(PDF d values of 2.42 and 1.42 A
˚
) but not obvi-
ously can be seen.
It is noteworthy that Al
2
O
3
still remains in rhombohedral
and cubic phases after catalytic testing (Fig. 7(b)). Meanwhile,
NiO species were observed in rhombohedral phase which pres-
ent in lower intensity. Unexpectedly, NiAl
2
O
4
, RuO
2
and
MnO
2
species were disappeared in both used Ru/Mn/
Ni(5:35:60)/Al
2
O
3
catalysts suggesting the well dispersion of
these species on the surface of the catalysts that below the
Figure 8 FESEM micrographs of Ru/Mn/Ni(5:35:60)/Al
2
O
3
calcined at 1000 °C for 5 h, (a) as-synthesis, (b) fresh, (c) used1x, (d)
used7x.
Table 5 EDX analysis of fresh and used catalysts Ru/Mn/
Ni(5:35:60)/Al
2
O
3
calcined at 1000 °C.
Catalyst Weight ratio (%)
Al O Ni Mn Ru Cl
As-synthesis 49.04 37.61 6.16 2.49 1.43 3.29
Fresh 56.42 29.36 5.79 4.35 4.08 –
Used1x 56.14 39.31 3.06 0.43 1.06 –
Used7x 55.42 39.23 4.51 0.27 0.58 –
The effect of noble metals on catalytic methanation reaction over supported Mn/Ni oxide based catalysts 639
XRD detection limit. Wan Abu Bakar et al. (2010) revealed
that some species collapse after undergoing catalytic testing
due to the well dispersion of these particles into the bulk ma-
trix of the catalyst. This phenomenon also can be supported by
Zhao et al. (2012) who found no manganese oxide crystalline
phase can be detected by XRD analysis after catalytic testing.
The continuous emergence of NiO in Ru/Mn/Ni(5:35:60)/
Al
2
O
3
catalyst (before and after catalytic testing) may sug-
gested that this species can be considered as active species.
The recommended active species had increased the percentage
removal of CO
2
and at the same time increase the formation of
CH
4
as had been discussed before
.
3.3.2. The effect of catalytic testing by FESEM-EDX analysis on
Ru/Mn/Ni(5:35:60)/Al
2
O
3
catalyst calcined at 1000 °C for 5 h
Fig. 8 shows the effect of catalytic testing on the Ru/Mn/
Ni(5:35:60)/Al
2
O
3
catalysts in various conditions for instance
as synthesis (before calcine), fresh (before reaction), used1x
and used7x (after reaction) catalysts.
Table 6 BET surface area and pore diameter of fresh and used catalysts Ru/Mn/Ni (5:35:60)/Al
2
O
3
calcined at 1000 °C.
Catalyst Condition S
BET
(m
2
/g) Average pore diameter (A
˚
) Isotherm plot
Ru/Mn/Ni(5:35:60)/Al
2
O
3
Alumina 192 – –
Fresh 47 140 Type IV
Used1x 60 88 Type IV
Used7x 56 94 Type IV
(a)
(b)
(c)
Figure 9 Isotherm plots of Ru/Mn/Ni (5:35:60)/Al
2
O
3
calcined at 1000 °C, fresh, (b) used1x, (c) used7x.
640 W.A. Wan Abu Bakar et al.
These catalysts display inhomogeneous mixtures of aggre-
gated and agglomerated particles in spherical shape. Addition-
ally, these catalysts have been proved to be nano categorised
since their particle sizes are in the range of 36–75 nm. Further-
more, these findings were well supported by XRD diffracto-
grams denoted as polycrystalline with some amorphous
character for all catalysts (Fig. 7). Smaller particles size lead
to higher metal dispersion and thus increase the surface area
of the catalyst as well as catalytic activity. From the micro-
graphs, it also can be noted that the average particle size of
as-synthesis, fresh and used catalysts remained unchanged sug-
gesting that no significant changes occurred under reaction
conditions.
Meanwhile, EDX analysis for all Ru/Mn/Ni(5:35:60)/
Al
2
O
3
catalysts confirmed the presence of Al, O, Ni, Mn and
Ru. As written in Table 5, the percentage of weight ratios
for each element in used catalyst was decreased compare to
the fresh catalyst except for oxygen atom (O). Al and O con-
tributed the highest percentage of weight ratio since the usage
of alumina (Al
2
O
3
) as support in this research. As-synthesis
catalyst showed the presence of 6.16 wt% of Ni, 2.49 wt% of
Mn, and 1.43 wt% of Ru as well 3.29 wt% of chloride precur-
sor has been detected.
The fresh Ru/Mn/Ni (5:35:60)/Al
2
O
3
catalyst had attained
5.79 wt% of Ni, 4.35 wt% of Mn and 4.08 wt% of Ru. After
catalytic testing, the weight ratio of each element became lower.
After seventh testing, a small amount of 0.58 wt% and
0.27 wt% of Ru and Mn, respectively, can be detected com-
pared to Ni element. These results are supported by XRD anal-
ysis (Fig. 7) in which only NiO in rhombohedral phase is
profoundly observed. In contrast, MnO
2
and RuO
2
peaks are
hard to distinguish from noise background probably due to
the lesser amount of these species as detected by EDX (Table 5).
The reduction in weight ratio of Ni, Mn and Ru of used
catalyst is probably due to the well dispersion of these particles
onto the support. This phenomenon might explain the migra-
tion of Ni, Mn and Ru into the bulk matrix of the catalyst sur-
face resulting in lesser particles that can be detected by EDX
analysis on the surface of the catalyst. Besides, this result
was in a good agreement with Nurunnabi et al. (2008), who
said that the Ru may have been adsorbed into the porous sup-
port consequently lowering the concentration of Ru on the
surface. Meanwhile, no Cl element was observed in fresh and
used catalysts indicating that calcination completely removes
chloride precursor.
3.3.3. The effect of catalytic testing on Ru/Mn/Ni(5:35:60)/
Al
2
O
3
catalyst calcined at 1000 °C for 5 h by nitrogen
adsorption analysis
The BET surface area and average pore diameter for the po-
tential Ru/Mn/Ni(5:35:60)/Al
2
O
3
catalyst are listed in Table 6.
According to Zhao et al. (2012), surface area for neat alumina
support which mainly contributed by the micro/meso-pores
and capillary effect plays the dominating role during impreg-
nation. Thus, Al
2
O
3
pores offer a space for the access of active
Ni and Mn elements.
In this research, alumina has 192 m
2
/g of surface area.
After impregnation process, some alumina pores will be
blocked which may contribute to the decreasing surface area
and pore diameter of the catalysts. From Table 6, it can be
seen that surface area of fresh Ru/Mn/Ni(5:35:60)/Al
2
O
3
cata-
lyst is smaller about 47 m
2
/g with 140 A
˚
pore diameter com-
pared to the neat alumina support.
After catalytic testing, the surface area of the catalyst in-
creased to 60 m
2
/g. This increment is probably due to the smal-
ler particle size contributing to the higher surface area.
However, after seventh testing, the surface area of used cata-
lyst was slightly decreased compare to the used1x catalyst. A
trend could be observed that by increasing the surface area,
the average pore diameter decreases. As a result, average pore
diameter became smaller after catalytic testing indicating that
some pores are blocked by the larger crystallite.
The nitrogen adsorption–desorption isotherms for both
fresh and used of Ru/Mn/Ni(5:35:60)/Al
2
O
3
catalysts are
Figure 10 FTIR spectra of Ru/Mn/Ni (5:35:60)/Al
2
O
3
calcined at 1000 °C, (a) as-synthesis, (b) fresh, (c) used1x, (d) used7x.
The effect of noble metals on catalytic methanation reaction over supported Mn/Ni oxide based catalysts 641
shown in Fig. 9. This catalyst exhibits isotherm Type IV with
hysteresis loop of type H1 indicating that the catalysts were in
mesoporous structure (20 A
˚
< W < 500 A
˚
). Moreover, hys-
teresis loop of type H1 assigned that the catalysts are in open
ended cylindrical channel with uniform shape and size as indi-
cated in FESEM analysis.
3.3.4. Fourier Transform Infra-Red (FTIR) analysis on Ru/Mn/
Ni(5:35:60)/Al
2
O
3
catalyst calcined at 1000 °C for 5 h
Fig. 10 displays the FTIR spectra of as-synthesis, fresh and
used Ru/Mn/Ni(5:35:60)/Al
2
O
3
catalysts calcined at 1000 °C
for comparison.
It can be observed that the FTIR spectra for these catalysts
in different conditions remained similar suggesting similar
functional groups present in these catalysts. The presence of
the OH group from adsorbed water molecule is revealed by
absorption peaks at 3390–3445 cm
À1
and 1631–1635 cm
À1
,
respectively as OH stretching and bending modes of vibration.
These peaks diminished after calcination process. However,
the O–H band emerged after seventh testing from water as
by-product in the methanation reaction.
The absorption below 1071 cm
À1
was assigned as the
stretching mode of metal oxide (M‚ O) groups which indi-
cated that the oxide catalysts have been obtained as all impu-
rities have been removed. Meanwhile, some nitrate precursor
residues were left in the catalyst due to the strong absorption
peak at 1384 cm
À1
for the as-synthesis catalyst (Fig. 10(a)).
However, nitrate precursor has been removed through calcina-
tion process as proven in the fresh and used catalysts. It is be-
lieved that nitrate precursor has been completely removed at
1000 °C calcination temperature.
3.3.5. Thermogravimetry Analysis–Differential Thermal
Analysis (TGA-DTA) on Ru/Mn/Ni(5:35:60)/Al
2
O
3
catalyst
The potential Ru/Mn/Ni(5:35:60)/Al
2
O
3
catalyst in as-synthe-
sis condition which was produced by impregnation method
and after aged overnight in oven at 80–90 °C was characterized
by TGA–DTA analysis in order to study thermal activity as
shown in Fig. 11.
Overall, total weight loss that was observed in this sample is
19.66%. At the starting point of temperature studied (60 °C)
until 120 °C, there was 2.79% of weight loss which equalled
to 0.1325 mg, assigned to the loss of surface free water mole-
cule. On the other hand from 120 °C until 330 °C, the decom-
position of surface hydroxyl molecule from the sample was
observed. From 330 °C onwards, nitrate compound and sur-
face hydroxyl molecule were decomposed. At 1000 °C, the
impurities from the catalyst have been removed and pure metal
oxide can be obtained.
DTA analysis supports the weight loss of sample from
TGA analysis. A small endothermic peak can be seen below
100 °C which assigned to the dehydration process where the
loss of surface water occurred. Then, a broad endothermic
peak at 200 °C until 300 °C attributed to the surface hydroxyl
was observed. A significant thermal difference can be detected
at 450 °C which is due to loss of surface hydroxyl molecule and
the decomposition of residual nitrate. This finding was sup-
ported by Wan Abu Bakar and co-workers, 2012.
It can be concluded that at 1000 °C calcination temperature
is effective in removing all impurities as has been proven by
FTIR, EDX and TGA-DTA analysis. Furthermore, a higher
activity can be achieved at the optimum 1000 °C calcination
temperature.
4. Conclusion
Overall performance from the catalytic activity studies did
not produce any catalyst that can achieve 100% of CO
2
con-
version at low reaction temperature. However, Ru/Mn/
Ni(5:35:60)/Al
2
O
3
calcined at 1000 °C was assigned as the po-
tential catalyst because of the contribution of 99.74% of CO
2
conversion and 72.36% of CH
4
formation at the maximum
reaction temperature studied (400 °C). From XRD analysis,
this supported catalyst showed in polycrystalline with some
amorphous phase suggesting NiO as active species which
was supported by FESEM analysis. This catalyst is catego-
rised as nanoparticle in spherical shape with aggregated and
agglomerated mixtures on the surface of the catalyst. More-
over, this catalyst exhibits a small surface area of 47 m
2
/g
and possesses a mesoporous structure as shown by isotherm
of Type IV. Calcination temperature of 1000 °C successfully
removed the impurities as shown by FTIR, EDX and
TGA–DTA data.
Acknowledgement
The authors would like to thank the Ministry of Higher Edu-
cation for GUP fund vote 01H79 and University Teknologi
Malaysia for financial support.
Figure 11 TGA-DTA thermogram of as-synthesis Ru/Mn/Ni(5:35:60)/Al
2
O
3
catalyst.
642 W.A. Wan Abu Bakar et al.
References
Azadi, P., Otomo, J., Hatama, H., Oshima, Y., Farnood, R., 2001.
Interactions of supported nickel and nickel oxide catalysts with
methanation and steam at high temperature. Chem. Eng. Sci. 66,
4196–4202
.
Baylet, A., Royer, S., Marecot, P., Tatibouet, J.M., Duprez, D., 2008.
High catalytic activity and stability of Pd doped hexaaluminate
catalysts for the CH
4
catalytic combustion. Appl. Catal. B 77, 237–
247.
Branford, M.J.C., Vannice, M.A., 1998. CO
2
reforming of CH
4
over
supported Ru catalysts. J. Catal. 183, 69–75.
Chen, J., Ma, Q., Rufford, T.E., Li, Y., Zhu, Z., 2009. Influence of
calcination temperatures of Feitknecht compound precursor on the
structure of Ni–Al
2
O
3
catalyst and the corresponding catalytic
activity in methane decomposition to hydrogen and carbon
nanofibers. Appl. Catal. A 362, 1–7.
Dokmaingam, P., Palikanon, T., Laosiripojana, N., 2007. Effect of
H
2
S, CO
2
, and O
2
on catalytic methane steam reforming over Ni/
CeO
2
and Ni/Al
2
O
3
catalysts. KMUTT Res. Dev. J. 30 (1), 36–47.
Mok, Y.S., Kang, H.C., Lee, H.J., Koh, D.J., Shin, D.N., 2010. Effect
of nonthermal plasma on the methanation of carbon monoxide
over nickel catalyst. Plasma Chem. Plasma Process. 30, 437–447.
Murata, K., Okabe, K., Inaba, M., Takahara, I., Liu, Y., 2009. Mn-
modified Ru catalysts supported on carbon nanotubes for Fisher
Tropsch synthesis. J. Jpn. Petrol. Inst. 52 (1), 16–20
.
Nurunnabi, M., Muruta, K., Okabe, K., Inaba, M., Takahara, I.,
2008. Performance and characterization of Ru/Al
2
O
3
and Ru/SiO
2
Catalysts modified with Mn for Fisher-Tropsch synthesis. Appl.
Catal., A 340, 203–211
.
Oh, S.W., Bang, H.Y., Bae, Y.C., Sun, Y.K., 2007 . E ffect of calcinations
temperature o n morphology, crystallinity and electrochemical proper-
ties of nano-crystalline metal oxides (Co
3
O
4
, CuO and NiO) prepared
via ultrasonic s pray pyrolysis. J. Power Sources 173, 502–509.
Ouaguenouni, M H., Benadda, A., Kiennemann, A., Barama, A.,
2009. Preparation and catalytic activity of nickel–manganese oxide
catalysts in the reaction of partial oxidation of methane. C. R.
Chim. 12, 740–747.
Panagiotopoulou, P., Kondarides, D.I., Verykios, X., 2008. Selective
Methanation of CO over supported noble metal catalysts: effects of
the nature of the metallic phase on catalytic performance. Appl.
Catal., A 344, 45–54
.
Park, J.H., Lee, D., Lee, H.C., Park, E.D., 2010. Steam reforming of
liquid petroleum gas over Mn-promoted Ni/c–Al
2
O
3
catalysts.
Korean J. Chem. Eng. 27 (4), 1132–1138.
Richardson, J.T., 1982. Principles of Catalyst Development. Plenum
Press, Houston, Texas, New York and London.
Samparthar, J.T., Xiao, H., Dou, J., Nah, T.Y., Rong, X., Kwan,
W.P., 2006. A novel oxidative desulfurization process to remove
refractory sulfur compound from diesel fuel. Appl. Catal. B 63 (1–
2), 85–93
.
Wan Abu Bakar, W.A., Ali, R., Abdul Kadir, A.K., Mat Rosid, S.M.,
Ali, R., Mohammad, N.S., 2012. Catalytic methanation reaction
over alumina supported cobalt oxide doped noble metal oxides for
the purification of simulated natural gas. J. Fuel Chem. Technol. 40
(7), 822–830
.
Wan Abu Bakar, W.A., Ali, R., Sulaiman, N., Abd Rahim, H.F.,
2010. Manganese oxide doped noble metals supported catalyst for
carbon dioxide methanation reaction. Sci. Iranica 17 (2),
115–123
.
Wan Abu Bakar, W.A., Ali, R., Toemen, S., 2011. Catalytic
methanation reaction over supported nickel–rhodium oxide for
purification of simulated natural gas. J. Nat. Gas Chem. 20, 585–
594
.
Yaccato, K., Carhart, R., Hagemeyer, A., Lesik, A., Strasser, P.,
Volpe Jr., A.F., Turner, H., Weinberg, H., Grasselli, R.K., Brooks,
C., 2005. Competitive CO and CO
2
Methanation over supported
noble metal catalysts in high throughout scanning mass spectrom-
eter. Appl. Catal. A 296, 30–48
.
Zhao, A., Ying, W., Zhang, H., Ma, H., Fang, Dingye, 2012. Ni/Al
2
O
3
catalysts for syngas methanation: effect of Mn promoter. J. Nat.
Gas Chem. 2, 170–177.
The effect of noble metals on catalytic methanation reaction over supported Mn/Ni oxide based catalysts 643