3 carbon isotope discrimination in roots and shoots of major weed species of southern u s rice fields and its potential use for analysis of rice–weed root interactions
Bạn đang xem bản rút gọn của tài liệu. Xem và tải ngay bản đầy đủ của tài liệu tại đây (729.98 KB, 15 trang )
BioOne sees sustainable scholarly publishing as an inherently collaborative enterprise connecting authors, nonprofit publishers, academic institutions, research
libraries, and research funders in the common goal of maximizing access to critical research.
13
Carbon Isotope Discrimination in Roots and Shoots of Major Weed Species of
Southern U.S. Rice Fields and Its Potential Use for Analysis of Rice–Weed Root
Interactions
Author(s): David R. Gealy and Glenn S. Gealy
Source: Weed Science, 59(4):587-600. 2011.
Published By: Weed Science Society of America
DOI: />URL: />BioOne (www.bioone.org) is a nonprofit, online aggregation of core research in the biological, ecological, and
environmental sciences. BioOne provides a sustainable online platform for over 170 journals and books published
by nonprofit societies, associations, museums, institutions, and presses.
Your use of this PDF, the BioOne Web site, and all posted and associated content indicates your acceptance of
BioOne’s Terms of Use, available at www.bioone.org/page/terms_of_use.
Usage of BioOne content is strictly limited to personal, educational, and non-commercial use. Commercial inquiries
or rights and permissions requests should be directed to the individual publisher as copyright holder.
13
Carbon Isotope Discrimination in Roots and Shoots of Major Weed Species
of Southern U.S. Rice Fields and Its Potential Use for Analysis of Rice–Weed
Root Interactions
David R. Gealy and Glenn S. Gealy*
Assessing belowground plant interference in rice has been difficult in the past because intertwined weed and crop roots
cannot be readily separated. A
13
C discrimination method has been developed to assess distribution of intermixed roots of
barnyardgrass and rice in field soils, but the suitability of this approach for other rice weeds is not known.
13
C depletion
levels in roots and leaves of rice were compared with those of 10 troublesome weed species grown in monoculture in the
greenhouse or field. Included were C
4
tropical grasses: barnyardgrass, bearded sprangletop, Amazon sprangletop, broadleaf
signalgrass, fall panicum, and large crabgrass; C
4
sedge, yellow nutsedge; and C
3
species: red rice, gooseweed, and redstem.
Rice root d
13
C levels averaged , 228%, indicating that these roots are highly
13
C-depleted. Root d
13
C levels ranged
from 212% to 217% among the tropical grasses, and were 210% in yellow nutsedge, indicating that these species were
less
13
C depleted than rice, and were C
4
plants suitable for
13
C discrimination studies with rice. Among the C
4
species,
bearded sprangletop and yellow nutsedge were most and least
13
C depleted, respectively. d
13
C levels in shoot and root
tissue of pot-grown plants averaged 6% greater for C
4
plants and 9% greater for rice in the field than in the greenhouse. In
pots, shoots of rice typically were slightly more
13
C depleted than roots. A reverse trend was seen in most C
4
species,
particularly for broadleaf signalgrass and plants sampled from field plots. Corrections derived from inputs including the
total mass, carbon mass, carbon fraction, and d
13
C levels of roots and soil increased greatly the accuracy of root mass
estimates and increased slightly the accuracy of root d
13
C estimates (, 0.6 to 0.9%) in samples containing soil. Similar
corrective equations were derived for mixtures of rice and C
4
weed roots and soil, and are proposed as a labor-saving option
in
13
C discrimination root studies.
Nomenclature: Barnyardgrass, Echinochloa crus-galli (L.) Beauv.; bearded sprangletop, Leptochloa fusca (L.) Kunth var.
fascicularis (Lam.) N. Snow; Amazon sprangletop, Leptochloa panicoides (J. Presl) A. S. Hitchc.; broadleaf signalgrass,
Urochloa platyphylla (Nash) R. D. Webster; fall panicum, Panicum dichotomiflorum Michx.; large crabgrass, Digitaria
sanguinalis (L.) Scop.; yellow nutsedge, Cyperus esculentus L.; gooseweed, Sphenoclea zeylanica Gaertn.; redstem, Ammannia
coccinea Rottb.; red rice, Oryza sativa L.; rice, Oryza sativa L.
Key words: Stable carbon isotope,
13
C/
12
C isotope ratio, d
13
C,
13
C depletion, C
3
photosynthetic pathway, C
4
photosynthetic pathway, crop–weed root interference, tropical japonica rice, indica rice.
13
C isotope discrimination analysis was recently used to
determine the levels and distribution of roots of weed-
suppressive rice and barnyardgrass in soil (Gealy and Fischer
2010). Barnyardgrass is an aggressive tropical grass that
greatly affects rice production worldwide.
13
C is a naturally
occurring, stable isotope that is present in about 1.1% of the
atmospheric CO
2
(West et al. 2006). The availability of this
technique for rice–weed root interaction studies represents a
significant step forward because of the inherent complexities
and difficulties in sampling, extricating, and quantifying
intermixed rice and weed roots under flooded field conditions.
This isotope analysis approach is feasible because barnyard-
grass uses the C
4
photosynthetic pathway (Giussani et al.
2001; Sage 2004; Smith and Brown 1973), whereas rice uses
the C
3
pathway. C
3
plants fix a lower percentage of
13
C, and
therefore are
13
C-depleted in all plant organs compared with
C
4
plants because of inherent differences in the photosynthesis
processes and anatomy of these two plant types (Ehleringer
1991; Farquhar et al. 1989). C
4
photosynthesis occurs in three
monocot families, including the Poaceae (Giussani et al.
2001; Waller and Lewis 1979) and the Cyperaceae (Muasya
et al. 2002), and in 16 dicot families including Amaranthaceae
and Portulacaceae (Sage 2004).
Factors that change stomatal conductance or photosynthetic
capacity (e.g., light, water deficit, vapor pressure deficit) in
typical C
3
plants can alter the ratio of the CO
2
partial pressures
in the leaf interior substomatal cavities and the ambient air
surrounding the leaf (i.e., P
i
/P
a
), which alters discrimination
against
13
C (Badeck et al. 2005; Dingkuhn et al. 1991). Thus,
lower discrimination against
13
C can result from lower leaf
CO
2
conductance, greater CO
2
incorporation capacity, or both
(Farquhar et al. 1982). Changes in leaf CO
2
conductance due
to stress typically affects
13
C discrimination differently in C
4
plants from that in C
3
plants. C
4
plants concentrate CO
2
into
bundle sheath cells even when stomata are partially closed and
shade (as well as water or nutrient stress, and genetic variation)
can induce leakiness of the bundle sheath cells to CO
2
(Clay
et al. 2009; Farquhar et al. 1982; Pansak et al. 2007).
13
C isotope discrimination analysis, often measured as
d
13
C, an expression of the
13
C/
12
C isotope ratio relative to a
fixed standard, has been used previously to determine the
proportions of roots of C
3
and C
4
species in a number of field
systems (Derner et al. 2003; Eleki et al. 2005; Gealy and
Fischer 2010; Svejcar and Boutton 1985; Svejcar et al. 1988).
In other applications,
13
C discrimination analysis has been
used in rice to improve water use efficiency or transpiration
efficiency (Dingkuhn et al. 1991; Impa et al. 2005; Kondo
et al. 2004; Scartazza et al. 1998; Xu et al. 2009) and to
explain suppression of a weed species under temporary water
stress (Fischer et al. 2010). Examination of genetic associa-
tions of d
13
C levels with crop productivity traits in mapping
populations of rice have indicated quantitative trait loci for
d
13
C on five (Xu et al. 2009) or on six (Laza et al. 2006) of
DOI: 10.1614/WS-D-10-00140.1
* Plant Physiologist, U.S. Department of Agriculture Agricultural Research
Service, Dale Bumpers National Rice Research Center, 2890 Highway 130 East,
Stuttgart, AR 72160. Second author: Principal Professional Staff, Johns Hopkins
University Applied Physics Laboratory, Laurel, MD. Corresponding author’s
E-mail:
Weed Science 2011 59:587–600
Gealy and Gealy:
13
Carbon isotope discrimination in rice–weed root interactions N 587
the 12 rice chromosomes.
13
C discrimination analysis has also
been used to explain the effects of stress on grain crop yield
loss (Clay et al. 2001, 2005).
Numerous weed species including barnyardgrass are prob-
lematic in rice fields in the southern United States. (Smith
1988), but the prospects of using
13
C isotope analysis to
evaluate their root interactions with rice have not been explored
in detail (Gealy et al. 2005; Gealy and Fischer 2010). Among
these species are other C
4
grasses (Giussani et al. 2001; Sage
2004; Smith and Brown 1973; Waller and Lewis 1979) such as
bearded sprangletop, Amazon sprangletop, broadleaf signal-
grass, fall panicum, and large crabgrass. Additional common or
troublesome weed species in rice include biotopes of red rice,
gooseweed, redstem, and yellow nutsedge. Although these
species can be controlled to some degree in rice using registered
herbicides (Scott et al. 2010), they are among the most
common and troublesome weeds in this crop in the southern
United States (Smith 1988; Webster 2008).
Simple extrapolations from standard concentration curves
can provide good estimates of intermixed rice and C
4
weed
root quantities using
13
C isotope discrimination analysis
(Gealy and Fischer 2010). Inconsistent or incomplete soil
removal from roots during processing, however, can introduce
unpredictable errors. Vigorous, extended washing/rinsing
action usually removes most of the soil residue, but potentially
increases time and resource requirements. Further, the precise
point at which soil has been adequately and uniformly
removed for optimum results is difficult to determine in real
time. Thus, even after extensive washing procedures are
completed, roots may retain unpredictable and sizeable levels
of soil. Evidence of this soil residue phenomenon is apparent
in analyses of carbon content that show that carbon fraction
(C fraction) levels in root samples tend to be much more
variable and lower than those in shoot samples (Gealy and
Fischer 2010). These observations suggest that derivations of
soil correction calculations for root mass and d
13
C values
might be developed on the basis of knowledge of the carbon
composition of the plants and soil.
With the exception of barnyardgrass, little is known of the
suitability of major weed species to
13
C isotope depletion root
interaction techniques in flooded rice systems. Thus, the
objectives of this research were to: (1) quantify d
13
C levels in
roots of numerous troublesome weed species and rice cultivars
grown as monocultures in flooded soil in field and greenhouse
environments; (2) compare d
13
C levels in roots with those in
shoots; and (3) develop mathematical corrections for d
13
C
and root mass values in soil-contaminated samples.
Materials and Methods
Pot Study in Greenhouse and Field. Barnyardgrass, bearded
sprangletop, broadleaf signalgrass, a nd fall panic um w ere c hosen
for a pot study to determine t heir d
13
C l evels and assess the
feasibility of using these grass weeds in
13
C discrimination/root
interaction studies with rice. The rice c ultivars ‘Lemont’ (Bollich
et al. 1985), a tropical japonica southern long grain, and ‘PI
312777’ (T65*2/TN 1; ‘WC 4644’), a weed-suppressive Asian
indica (Gealy et al. 2003; Gealy and Fischer 2010), were
included as standards.
Seedlings of these weed and rice species were selected from
natural stands and drilled rows, respectively, in rice research
field plots that had been planted May 24, 2007 and emerged
June 4. Plants in the four- to six-leaf stage were transplanted on
June 18 to individual pots (, 20-cm diameter and , 24-cm
depth) filled to , 83% capacity (, 4 cm below the rim) with
DeWitt silt loam soil (fine smectitic, thermic, Typic
Albaqualfs) having a pH of 5.8 and an organic matter content
of 1.2%. Pots containing individual weed species or rice cultivar
were randomly assigned to one of two groups placed under
substantially different environmental conditions: ‘‘field envi-
ronment’’ and ‘‘greenhouse environment.’’ The field pots were
placed in bar ditches on the interior perimeter of the rice
research field at the University of Arkansas Division of
Agriculture Rice Research and Extension Center (RREC)
(34u28980N, 91u259120W) near Stuttgart, AR. On June 25,
nitrogen fertilizer was applied to each pot as urea at a rate of
, 110 kg N/ha. On June 25, a permanent flood of 8- to 10-cm
depth was established and maintained for the remainder of the
growing period. The upper rim of each pot was placed at
approximately the level of the soil surface in the research plots,
allowing water to flow naturally into and submerge the pots
while plots were flooded. Unwanted weeds were removed by
hand. At harvest, the aboveground portion of each plant (the
shoots) was cut from roots at the soil surface.
The greenhouse pots were placed in a greenhouse equipped
with a multistage evaporative cooling system that was
thermostatically controlled to maintain minimum night
temperatures above 21 C and maximum daytime tempera-
tures below 35 C. Daytime temperatures, however, sometimes
exceeded 38 C during the hottest periods of the summer.
Midday irradiance levels in the greenhouse (photosynthetic
photon flux density max. , 400
mEm
22
s
21
) were only about
one-quarter to one-third of the ambient levels in the field
primarily because of deployment of ceiling shades intended to
maintain greenhouse temperatures within tolerable limits. No
supplemental lighting was used; thus, day lengths were the
same as ambient in the field. A constant flood (, 4 cm) was
maintained in pots by adding deionized water as needed. All
other aspects of plant growth, culture, and sampling were the
same as for the field pots. Similar to the methods described by
Gealy and Fischer (2010), roots from the entire soil/root mass
in each pot were extracted and cleaned thoroughly.
Expanded Species Survey in Field. In 2007 and 2008, an
expanded group of weed species was sampled from natural
stands present in drill-seeded, irrigated weed research plots at
the RREC. These areas were managed using the same general
practices described previously for weed-suppressive rice
experiments (Gealy and Fischer 2010). The species consisted
of the original C
4
tropical grass weed species used in the pot
study and six additional weed species that have typically been
among the most common and troublesome weed species in rice
in the southern United States (Webster 2008). These included
Amazon sprangletop, large crabgrass, yellow nutsedge, goose-
weed, redstem, and the red rice biotypes AR-1995-StgB
(PI653422) awned blackhull, AR-1994-8 (PI653425) awned
blackhull, AR-1994-11D (PI653417) awned, LA-1995-LA3
(PI653420) awned brownhull, and AR-1995-StgS (PI653423)
awnless strawhull (Gealy et al. 2009; GRIN 2010). Rice entries
included those from the pot study, the additional tropical
japonicas ‘Wells’ (Moldenhauer et al. 2007; long grain), ‘CL
141’ (imidazolinone-resistant, proprietary BASF cultivar; long
grain), and ‘Bengal’ (Linscombe et al. 1993; medium grain),
the indica accession ‘4593’ (PI 615031; GRIN 2010), and
588
N Weed Science 59, October–December 2011
‘XL723’ (proprietary RiceTec hybrid). Individual rice, red rice,
gooseweed, and redstem plants were obtained from areas
receiving a season-long flood, while the other species were
obtained from intermittently flooded or wet areas near levees
adjacent to these areas. Mature plants were collected, typically
after rice harvest. Although the intent was to retrieve the
complete root systems, very long or fine roots could not always
be extricated completely. Plants were divided into roots and
shoots. The roots were washed and rinsed to remove soil as
described by Gealy and Fischer (2010). After discovering that
the root-cleaning procedures used in field and pot studies in
2007 sometimes failed to remove soil completely from plants,
additional time and vigor of agitation were used to clean roots
in 2008.
Plant Tissue Analysis. Roots and shoots from all experiments
were dried to constant mass at 60 C and weighed to the
nearest 0.1 g. All shoots and the largest root masses were then
ground in a large Wiley mill
1
with 2-mm screen openings to
produce coarsely ground tissue. This material was mixed
thoroughly and a total of , 30 g of representative tissue was
removed in numerous subsamples, combined, and reground
using a smaller Wiley mill
2
with 1-mm screen openings,
resulting in powdered tissue. Root samples weighing less than
30 g were ground only in the smaller Wiley mill.
The
13
CandCfractionlevelsintheseplanttissueswere
quantified at the University o f Arkansas Stable Isotope
Laboratory using the procedure described by Gealy and Fischer
(2010). Briefly, subsamples were weighed to an accuracy of
0.0001 mg, combusted in an elemental analyzer in a stream of
helium, and resultant CO
2
gas was analyzed by an isotope ratio
mass spectrometer . Raw
13
C/
12
C i sotope ratios were acquired by
comparison with a reference gas injection and were normalized
by comparison with in-house isotope standards traceable to
international references. The C fractions of samples were
determined via instrument response to known standards. One
third to o ne half of the samples processed t hrough the
combustion/mass spectrometer procedure c onsis ted of isotope
standards t o ensure proper c alibration (Gealy and Fischer 2010).
13
C/
12
C isotope ratios were expressed relative to the
international Pee Dee Belemnite (PDB) limestone fossil
standard as d
13
C (Farquhar and Lloyd 1993; O’Leary 1993):
d
13
C
sample
(
0
=
00
)~ R
sample
{R
standard
ÀÁ
=R
standard
ÂÃ
|1,000 ½1
where d
13
C
sample
is the isotope ratio (in parts per thousand; %)
relative to the PDB standard. R
sample
and R
standard
are the
13
C/
12
C molar abundance ratios of the plant sample a nd
the P DB standard (R
pd
; 0 .0112372), respectively (Eleki et al.
2005). Average d
13
C values for C
3
and C
4
plants were reported
to be approximately 227% and 213%, respectively (Boutton
1996). The n egative value ind icates a lower
13
C/
12
C ratio in
plants than in the PDB standard. Vogel (1980) considered
d
13
C values for C
4
plants to range within 29% to 216% and
C
3
plants to range within 222% to 234%. For classification
purposes in the present study, plants with d
13
Cvalues. 217%
were included w ith the C
4
plants.
Statistical Design and Analysis. The experimental design for
the pot study was a randomized complete block with four
replications and the two experiments were considered to be
locations. d
13
C data were analyzed using the SAS Proc Mixed
procedure. The shoot–root difference in d
13
C levels in each
plant sample was compared by subtracting the root value from
the shoot value. A value , 0 indicates that the root value is
higher (less
13
C-depleted) than the shoot value. An LSmeans
test (P 5 0.05) was performed to determine which shoot
and root values were significantly different from one another
(i.e., shoot–root differences not equal to zero). Shoot–root
differences for C fraction and mass values were similarly
calculated and analyzed statistically.
The experimental design for the expanded species survey
was a randomized complete block with the 2 yr of the study
serving as blocks with four subsampled plants per block. d
13
C
data were analyzed using the SAS Proc Mixed procedure. An
LSmeans test of the root–shoot difference that yielded a value
different from zero at P 5 0.05 indicated that d
13
C values in
roots and shoots were different for a particular species. C
fraction and mass data were analyzed using the SAS Proc
GLM procedure and the mean differences were determined
using Duncan’s multiple range test at P 5 0.05.
Corrections of Root d
13
C Values and Root Mass for
Soil Contamination. A mathematical expression to correct
for the effect of soil contamination on estimated root mass of
a single plant species was derived from a mixing equation
describing the C fractions of the sample, root, and soil
components. A related expression that corrects for the effect of
soil contamination on the sample root d
13
C level was derived
independently.
Carbon Fraction Mixing Equation. Root samples obtained
from field soils contain carbon from the root tissues and from
the soil that remained after washing. These carbon masses can
be expressed as follows:
M
c
~M
c1
zM
cs
½2
where M
c
is the total carbon mass in the root sample, M
c1
is
the carbon mass of the root, and M
cs
is the carbon mass of the
soil. These carbon masses also can be expressed as the product
of (total mass of each component in the mixture) 3 (C
fraction of that component). Thus:
fM~f
1
M
1
zf
s
M
s
½3
where f, f
1
, and f
s
are the respective C fractions, and M, M
1
,
and M
s
are the respective masses of the total sample, root
component, and soil component (g) in the sample mixture.
Note that for simplicity and internal consistency with variable
names that were used in separately derived Equations 10–25,
we used the suffix ‘‘s’’ to designate soil and the number 1 or 2
to designate a plant species. A variable name without one of
these suffixes indicates that it refers to the sample mixture.
Substituting (M 2 M
1
) for M
s
and rearranging produces the
corrected value for root mass (M
1
) expressed in terms of M
and the component C fractions.
M
1
~M
f {f
s
f
1
{f
s
½4
And by definition:
M
s
~M{M
1
½5
Gealy and Gealy:
13
Carbon isotope discrimination in rice–weed root interactions N 589
Using methods described in the ‘‘Plant tissue analysis’’ section,
M and f were determined for each root sample, and the f
s
value
that was obtained from samples of root-free field soil was
determined to be 0.008335 (considered a constant in this
study). An approximation was used to determine the f
1
values.
In the context of this correction procedure, f
1
was set equal to
the value of the shoot C fraction (f
1
shoot) from the same plant.
This approximation was reasonable, because root and shoot C
fractions were nearly equal in a subset of rice and C
4
plant
samples that had been vigorously rewashed to remove soil from
roots. In the cases in which f was . f
1
shoot, the f value was
typically substituted for f
1
, forcing M 5 M
1
(via Equation 4).
An alternative approach not used here would be to define f
1
as
the largest f value for that species, assuming that well-cleaned
monoculture root samples were available for comparison.
Simple d
13
C Mixing Equation.Ad
13
C mixing equation was
derived using carbon mass inputs along the lines of those used
for C fraction mixing above (Equations 2 and 3). Thus:
d~d
1
M
c1
M
c
zd
s
M
cs
M
c
~d
1
f
1
M
1
fM
zd
s
f
s
M
s
fM
½6
where d, d
1
, and d
s
, are d
13
C levels in the carbon present in
the total sample, root component (unknown), and soil
component, respectively. Using methods from the ‘‘tissue
analysis’’ section above, d values were determined for each
sample. The d
s
of root-free soil samples was determined to be
221.27% (considered a constant in this study). Other
variables were as defined previously.
Substituting M 2 M
1
for M
s
as before, and rearranging,
yields a second expression of M
1
:
M
1
~M
df {d
s
f
s
d
1
f
1
{d
s
f
s
½7
Combine Equations 4 and 7 by factoring out M
1
, rearrange,
and solve for d1, which is the soil-corrected d
13
C value for
root tissue in the sample mixture:
d
1
~
df (f
1
{f
s
){d
s
f
s
(f
1
{f )
f
1
(f {f
s
)
½8
This expression for d
1
in Equation 8 was derived using a
simple d
13
C mixing analogy and is a close approximation to
the exact expression derived from a true mixing analogy on
the basis of actual
13
C/
12
C isotope ratios instead of the
relative d
13
C values. Over the broad range of input values
used in the present studies, this approximation yielded d
13
C
values nearly identical (to at least three decimal places) to
those calculated using a more complex exact derivation on
thebasisoftheactualcarbonisotope ratios (Supplemental
Appendix 1A). A spreadsheet containing the formulas for
these equations can be accessed from Supplemental
Appendix 2.
The approximation in Equation 8 produces soil-corrected
d
13
C values (d
1
) very close to those from the exact expression
because the value of the R
pd
standard and all other R values
used in the exact expression are very small (i.e., 0.0112372
or less). We calculated this error to be in the range of
, 0.0180 to 0.0281% (for d
1
2d
s
differences of 8 and 10%,
respectively; data not shown).
A more simplified approximation of d
1
can be derived from
Equation 8:
d
1
~dz
(d{d
s
)(f
s
)(f
1
{f )
f
1
f
½9
This equation generally yielded the same result as Equation 8
when f . 0.1 and f
s
of contaminating soil ,, f
1
. For
instance, the f
s
5 0.008335 for the low-organic-matter soil in
the present study will produce acceptable results over a wide
range of conditions. However, an f
s
5 0.05, as may occur in
higher-organic-matter soils, could result in significant errors
when using Equation 9.
Soil Supplementing Experiment. To demonstrate the effect
of soil contamination on the measured levels of d
13
C and C
fraction in roots, root samples of monoculture Wells rice or
barnyardgrass from the 2008 field study that had previously
been shown to be nearly soil-free (i.e., similar C fractions in
roots and shoots) were mixed with soil. Pure soil used for
supplementing experiments had a C fraction (f
s
) of 0.008335
and a d
13
Cof221.27%. Root samples were ground to a
powder using the small Wiley mill with a 1-mm screen (as
described above) and supplemented with pulverized, dry field
soil (described above) at planned levels of 0, 12.5, 25, 50, 75,
and 87.5% (g/g; soil/[roots+soil]). As actually prepared, the
rice mixtures contained 0, 12.2, 26.3, 49.2, 75.1, and 87.3%
soil (one subsample) and the barnyardgrass mixtures con-
tained 0, 12.5, 25.4, 50.0, 73.6, and 87.0% soil (average
of two subsamples). Samples were mixed thoroughly and
submitted to the University of Arkansas Stable Isotope
Laboratory for d
13
C and carbon content analysis as described
in the ‘‘tissue analysis’’ section above. Equations 4 and 8 were
used to compare the mathematically corrected values for
root mass and d
13
C, respectively, with those obtained for
samples via laboratory analysis. Expected d
13
C values for soil
levels higher than those measured experimentally (i.e., 88, 94,
97, 98.5, 99.25, 99.625, and 99.81% soil) were simulated by
solving Equation 8 (after rearrangement) for d
13
C of the
sample (d) at the sample C fractions (f ) equivalent to
the respective soil% values above (all other variables held
constant).
General Correction Equations for Estimation of Rice and
C
4
Weed Root Mass in Samples with Soil Contamination.
Extending the logic we had used previously to produce
corrections for the mass (Equation 4) and d
13
C (Equation 8)
values of single-species root samples containing soil, we
developed another set of mathematical expressions to correct
for soil in sample mixtures containing unknown amounts of
C
3
rice and C
4
weed roots. To ensure the highest level of
accuracy for results across the broadest range of variable
inputs, we derived the relevant equations for this C
3
–C
4
–soil
mixture from the exact expressions of the carbon isotope ratios
(i.e., not d
13
C values). In a more complex system, attempting
to simultaneously distinguish among three different species in
root mixtures, Polley et al. (1992) used a mixing approach to
account for inherent species differences in C fraction.
Definitions for the variable names are similar to those for
Equations 2–9 above: f and f
s
are the respective C fractions
and M and M
s
are the respective masses of the total sample
and soil component (g) in the sample mixture; f
1
and f
2
are
the respective C fractions and M
1
and M
2
are the respective
masses of the C
3
root component and C
4
root component
in the sample mixture. Similarly, d, d
1
, d
2
, and d
s
are d
13
C
590
N Weed Science 59, October–December 2011
levels in the carbon contained in the total sample, the C
3
and
C
4
root components, and the soil component, respectively.
We derived the appropriate expressions for M
1
and M
2
on
the basis of two basic equations. The first equation expresses
the sample C fraction in terms of its component C fractions,
similar to the approach used in Equation 3. Thus:
fM~f
1
M
1
zf
2
M
2
zf
s
M
s
½10
Expressing M
s
in terms of the other mass components:
M
s
~M{M
1
{M
2
½11
Thus:
fM~f
1
M
1
zf
2
M
2
zf
s
M{M
1
{M
2
ðÞ
½12
f ~f
1
M
1
M
zf
2
M
2
M
zf
s
M{M
1
{M
2
M
½13
Simplifying and rearranging yields:
M
1
~
Mf{f
s
ðÞzM
2
f
s
{f
2
ðÞ
f
1
{f
s
½14
This is an independent expression for M
1
based on a mixing
equation for C fraction.
The second basic equation is the expression of the ratio (R)
of
13
C/
12
C in the sample (i.e., the
13
C/
12
C mass fraction
ratio).
R~
C13
1
zC13
2
zC13
s
C12
1
zC12
2
zC12
s
½15
By definition, for any carbon-containing component of type i:
R
i
~
C13
i
C12
i
½16
where i 5 1 refers to plant type 1, i 5 2 refers to plant
type 2, and i 5 3 refers to soil. We know that
12
C and
13
C
isotopes comprise essentially 100% of the carbon mass in our
samples. Thus:
f
i
~
C12
i
zC13
i
M
i
½17
which applies to plant type 1, plant type 2, and soil.
Combining Equations 16 and 17, we obtain:
f
i
~
C13
i
1
R
i
z1
M
i
0
B
B
@
1
C
C
A
½18
Rearranging Equation 18 yields an expression for the
13
C
mass:
C13
i
~
f
i
M
i
1
R
i
z1
0
B
B
@
1
C
C
A
½19
Substituting C12
i
R
i
(as rearranged from Equation 16) for
C13
i
in Equation 19, and rearranging, yields the equivalent
expression for
12
C mass:
C12
i
~
f
i
M
i
R
i
z1
½20
Substituting expressions for
13
C components from Equation
19 into the numerator of Equation 15, and the expressions for
12
C components from Equation 20 into the denominator of
Equation 15, produces Equation 21, which is an expression of
the sample R value as a function of the component R values
(i.e., it is a mixing equation for the
13
C/
12
C ratios).
R~
f
1
M
1
1z
1
R
1
!
z
f
2
M
2
1z
1
R
2
!
z
f
s
M{M
1
{M
2
ðÞ
1z
1
R
s
!
f
1
M
1
R
1
z1
z
f
2
M
2
R
2
z1
z
f
s
M{M
1
{M
2
ðÞ
R
s
z1
0
B
B
B
B
@
1
C
C
C
C
A
½21
This can be rearranged to produce a second, independent
expression for M
1
:
M
1
~
M
2
f
2
R
2
{RðÞ
R
2
z1
z
f
s
R{R
s
ðÞ
R
s
z1
zM
f
s
R
s
{RðÞ
R
s
z1
f
s
R
s
{RðÞ
R
s
z1
z
f
1
R{R
1
ðÞ
R
1
z1
0
B
B
@
1
C
C
A
½22
The two expressions for M
1
(Equations 22 and 14) are set
equal, M
1
is factored out, and the equation solved for M
2
,
yielding the soil-corrected root mass of plant type 2 (i.e., C
4
):
M
2
~M
f
s
R
s
{RðÞ
R
s
z1
z
f
1
R{R
1
ðÞ
R
1
z1
f {f
s
ðÞ{
f
s
R
s
{RðÞ
R
s
z1
f
1
{f
s
ðÞ
f
2
R
2
{RðÞ
R
2
z1
z
f
s
R{R
s
ðÞ
R
s
z1
f
1
{f
s
ðÞ{
f
s
R
s
{RðÞ
R
s
z1
z
f
1
R{R
1
ðÞ
R
1
z1
f
s
{f
2
ÀÁ
0
@
1
A
This equation can be rearranged by grouping common terms,
and further simplified to the following form:
M
2
~M
f
s
R
s
{R
ðÞ
R
s
z1
f {f
1
ðÞ{
f
1
R
1
{R
ðÞ
R
1
z1
f {f
s
ðÞ
f
2
R
2
{RðÞ
R
2
z1
f
1
{f
s
ðÞz
f
s
R
s
{RðÞ
R
s
z1
f
2
{f
1
ðÞ{
f
1
R
1
{RðÞ
R
1
z1
f
2
{f
s
ðÞ
0
@
1
A
For any
13
C/
12
C ratio (R
i
), its d
13
C value (d
i
) can be expressed
relative to the R value of the PDB standard (R
pd
) according to
the definition:
R
i
:R
pd
1z d
i
=1,000ðÞ½½25
Note that this is a generalized rearrangement of Equation 1.
Substituting this definition for the R values in Equation 23
or Equation 24 yields equations that express
13
C/
12
C ratios in
terms of R
pd
, a fixed constant, and the familiar d
13
C term.
The mass of rice roots (M
1
) can be obtained from the
same general equations (Equation 23 or Equation 24) after
exchanging the f
i
and R
i
indices for plant 1 and plant 2 (i.e.,
the original f
1
and R
1
values become f
2
and R
2
, respectively,
whereas the original f
2
and R
2
values become f
1
and R
1
,
respectively). The f
s
and f values and the R
s
and R values are
left unchanged. This maneuver temporarily redefines plant 1
as plant 2 and vice versa, which facilitates the calculation of
the root mass of the other species (M
1
). Soil mass (M
s
) was
calculated as before using Equation 11.
Equations 10–25 were derived with R
pd
and other R values
expressed on both a molar abundance ratio basis and a mass
[23]
[24]
Gealy and Gealy:
13
Carbon isotope discrimination in rice–weed root interactions N 591
fraction basis. R
pd
molar abundance ratio 5
13
C/
12
C 5
0.0112372 (Eleki et al. 2005), and R
pd
mass fraction ratio 5
(R
pd
molar abundance ratio)(13/12). Because calculated
results were , identical to four decimal places, both models
were considered equally acceptable.
A more complete explanation of the various steps used to
derive the equations in this section is presented in Supplemental
Appendix 1B. A spreadsheet containing formulas to calculate
results for Equation 23 can be accessed from Supplemental
Appendix 2. A less cumbersome and simplified approximation
of the exact expression of soil-corrected root masses shown in
Equation 23 was developed using a simple mixing model for
d
13
C values. It is presented as Equation 14c.12 in Supplemental
Appendix 1C.
Results and Discussion
d
13
C Levels in Roots and Shoots of Rice and Weeds:
Pot Study. The d
13
C levels in roots of the tropical C
4
grass
weeds were readily distinguished from those in rice cultivars in
both the field and greenhouse (Table 1). Soil-corrected d
13
C
values for the C
4
grass roots ranged from 212.4% to 216.7%
and the uncorrected values were slightly lower, ranging from
212.9% to 216.8%. Among these four weed species, root
and shoot d
13
C levels in barnyardgrass and fall panicum were
highest, whereas those in bearded sprangletop were lowest. Soil-
corrected values for rice roots averaged , 228.5% and the
uncorrected sample averages were slightly greater at 228.1%.
Root d
13
C levels in tropical japonica Lemont rice were usually
similar to those in indica PI 312777 rice, but shoot d
13
C levels
in the greenhouse were 4% (or 1.2%) lower in PI 312777 than
in Lemont. The d
13
C levels in rice in the field and greenhouse
in the present studies generally were similar to those in
nonstressed rice described earlier (Scartazza et al. 1998; Zhao
et al. 2004). Our data clearly confirm these four grass weeds
and rice to be C
4
and C
3
plants, respectively.
Root d
13
C soil-corrected values averaged up to 2.1% higher
in C
4
grasses and 2.5% lower in C
3
rice compared with
noncorrected values (Table 1). These divergent trends for the
corrected values of C
4
grasses and rice are consistent with the
fact that the d
13
C level in our soil (, 21.27%; as described in
Materials and Methods) was between that of the two plant
types. These results for C
4
and C
3
plants were generally
consistent with those estimated previously (Gealy and Fischer
2010), where root d
13
C levels in monoculture C
4
barnyard-
grass and rice averaged 213.1% and 228.5%, respectively.
Similarly, d
13
C levels in nonstressed Leptochloa fusca (L.)
Kunth (Kallar grass), a bearded sprangletop C
4
relative, were
214.7% (Akhter et al. 2003).
d
13
C levels in both root and shoot tissues were greater (i.e.,
less
13
C-depleted) in the field than in the greenhouse,
exhibiting increases of about 6% for C
4
plants and 9% for
rice (Table 1). On calm, sunny days, air in the rice field
canopy may have become CO
2
depleted (Gealy, unpublished
data) compared with the well-mixed ambient air introduced
into the greenhouse. Plants were probably not fully light
saturated in the greenhouse where they were at O lower
irradiance levels than in the field. Corn under low light
conditions has been reported to have greater
13
C discrimina-
tion levels than if grown under full sun (Clay et al. 2009).
Therefore, low light conditions in the greenhouse may have
contributed to discrimination differences seen in our plants
when compared with field values.
In both pot environments, shoot d
13
C levels closely
mirrored those in the roots. The
13
C levels in C
4
grass
species (Table 1) generally were similar or lower (more
13
C-
Table 1. d
13
C levels in weed and rice samples from pots maintained in greenhouse or field environments, and the application of a mathematical correction for soil
contamination in roots.
a,b
Species
Growth
environment
d
13
C
Shoot Root Corrected root
c
Shoot minus
corrected root
c,d
Corrected root
c,d
(species main effect)
Shoot minus
corrected root
c,d,e
(species main effect)
( %)
Barnyardgrass Greenhouse 213.8 ab 213.8 a 213.8 0.05 213.1 a 20.23 ab
Field 213.0 a 212.9 a 212.4 20.51
Bearded sprangletop Greenhouse 215.8 c 216.8 b 216.7 0.94 215.8 c 0.58 a
Field 214.7 b 215.0 ab 214.9 0.23
Broadleaf signalgrass Greenhouse 213.8 ab 215.1 ab 215.0 1.23* 215.0 bc 1.56* a
Field 213.0 a 215.0 ab 214.9 1.90*
Fall panicum Greenhouse 213.4 a 213.7 a 213.6 0.21 213.8 ab 0.55 a
Field 213.2 a 214.3 ab 214.0 0.89
Lemont rice Greenhouse 230.9 e 228.6 c 228.8 22.12* 228.1 d 21.76* b
Field 228.8 d 226.9 c 227.4 21.40*
PI 312777 rice Greenhouse 232.1 f 228.7 c 229.0
23.02* 229.0 d 21.71* b
Field 229.4 d 228.2 c 228.9 20.39
Species 3
environment
interaction not
significant (ns)
at P 5 0.05
Species 3
environment
interaction ns
at P 5 0.05
a
Plants were grown in flooded pots in soil in the field or greenhouse during 2007.
b
Values in columns are the estimated means according to an LSmeans test. Values followed by the same letter were not different according to LSmeans (P 5 0.05).
c
Corrected root d
13
C values were calculated using Equation 8.
d
For the difference ‘‘shoot minus corrected root,’’ a value . 0 indicates that root value is lower (d
13
C is more negative; tissue is more
13
C-depleted) than shoot value.
* indicates that the ‘‘shoot-corrected root’’ difference within that species is different from zero (i.e., shoot and root values are different from one another) according to
an LSmeans test (P 5 0.05).
e
Main effect means for growth environment. ‘‘Corrected root’’; field 5 218.8% and greenhouse 5 219.5% (P ,, 0.05). ‘‘Shoot-corrected root;’’ field 5 0.12%
and greenhouse 5 20.45% (P 5 0.118).
592 N Weed Science 59, October–December 2011
depleted) in roots than in shoots, and this difference averaged
, 12% (1.6%) in broadleaf signalgrass. Data from Badeck
et al. (2005) indicated that d
13
C levels in roots were
sometimes greater and sometimes less than in shoots of C
4
species (n 5 10). In contrast to the C
4
weeds, rice d
13
C levels
averaged , 6% (1.7%) greater (less
13
C-depleted) in roots
than in shoots (Table 1). Previous reports have also indicated
that rice leaves and shoots generally were more
13
C-depleted
than roots (Badeck et al. 2005; Klumpp et al. 2005; Scartazza
et al. 1998; Zhao et al. 2004). A compilation of , 400
comparisons of
13
C depletion in numerous species showed
that roots of C
3
plants were, on average, 1.08% less
13
C-
depleted compared with leaves (Badeck et al. 2005).
The corrected root d
13
Cvaluesinricewereatleast78%
(12.3%) lower than in the four weed s pecies (on the basis of
species m ain effect mean s), whereas n oncorrected root d
13
Cvalues
in rice were at least 70% (11.8%) lower than in these weeds (on
the basis of the species 3 environment interaction means)
(Table 1). Clearly, C
3
and C
4
plant roots can be distinguished in
our rice field soils containing low levels of organic carbon.
d
13
C Levels in Roots and Shoots of Rice and Weeds:
Expanded Species Field Survey. In the species common to
both experiments, d
13
C levels in the expanded field survey
generally followed trends similar to those in the pot study. d
13
C
levels for roots of C
4
plants were lowest in bearded sprangletop
(217.1%), followed by Amazon sprangletop, intermediate in
broadleaf signalgrass, fall panicum, and barnyardgrass, and
greatest in crabgrass and yellow nutsedge (210.3%) (Table 2).
Rajagopalan et al. (1999) reported similar high d
13
C levels
(28.2% to 211.5%) in the cellulose of relatives of yellow
nutsedge (Cyperus spp.) growing in peat bogs.
In contrast to the pot study, root d
13
C levels in nearly all of
the C
4
grass species in the expanded species survey were lower
than in shoots, ranging from 8.7% (1.1%) for barnyardgrass
to 16.7% (2.5%) for bearded sprangletop. Yellow nutsedge
differed from most of the other C
4
weed species in that its
root d
13
C levels were 15.8% (1.9%) higher than in shoots,
which was similar to the trend for rice (Table 2).
Both root and shoot d
13
C levels were similar among the
four rice cultivars in the field plots (Table 2). Root d
13
C levels
Table 2. d
13
C levels in additional weed species and rice cultivars growing in or near rice field plots in 2007 and 2008, and the application of a mathematical correction
for soil contamination in roots.
a,b
Species
c
d
13
C
Shoot Root Corrected root
d
Shoot minus corrected root
d,e
(%)
Bearded sprangletop 214.7 c 217.2 d 217.1 d 2.45* a
Amazon sprangletop 213.9 bc 215.2 cd 215.1 cd 1.19* a
Barnyardgrass 212.4 a 213.5 bc 213.5 bc 1.08* ab
Broadleaf signalgrass 212.9 ab 214.2 bc 214.2 bc 1.30* ab
Fall panicum 212.5 a 213.9 bc 213.8 bc 1.29* ab
Crabgrass 212.5 a 211.9 ab 211.9 ab 20.56 bc
Yellow nutsedge
c
212.3 a 210.4 a 210.3 a 21.94* c
Redstem 228.1 d–f 228.6 e 228.7 e 0.66 ab
Gooseweed 227.2 d 226.8 e 226.9 e 20.25 bc
AR-1995-StgB awned red rice 229.1 f 228.9 e 229.0 e 20.12 bc
Wells long-grain rice 227.9 de 227.5 e 227.9 e 0.01 abc
4593 indica rice 228.3 ef 227.0 e 227.0 e 21.29* bc
Bengal medium-grain rice 227.6 de 226.8 e 227.3 e 20.31 bc
XL723 hybrid rice 228.1 d–f 228.1 e 228.4 e 0.36 abc
Additional O. sativa entries from same field location
c
AR-1995-StgS awnless red rice
(2007 only)
228.1 6 0.1
(n 5 4)
228.0 6 0.7
(n 5 4)
228.2 6 0.7
(n 5 4)
0.03 6 0.72
(n 5 4)
AR-1994-8 awned red rice
(2008 only)
229.4 6 0.8
(n 5 4)
227.8 6 0.4
(n 5 4)
227.8 6 0.4
(n 5 4)
21.63 6 0.63
(n 5 4)
AR-1994-11D awned red rice
(2008 only)
229.6 6 0.6
(n 5 4)
228.6 6 0.1
(n 5 4)
228.7 6 0.1
(n 5 4)
20.97 6 0.67
(n 5 4)
LA-1995-LA3 awned red rice
(2008 only)
229.8 6 0.9
(n 5 4)
228.7 6 0.3
(n 5 4)
228.7 6 0.3
(n 5 4)
21.15 6 1.08
Lemont rice (2008 only) 227.9 6 0.5
(n 5 4)
227.9 6 1.2
(n 5 3)
228.0 6 1.2
(n 5 3)
20.10 6 0.84
(n 5 3)
CL 141 rice (2007 only) 227.5 6 0.1
(n 5 4)
227.1 6 0.5
(n 5 4)
227.8 6 0.5
(n 5 4)
0.37 6 0.55
(n 5 4)
PI 312777 rice (2008 only) 227.9 6 0.1
(
n 5 4)
225.9 6 1.3
(n 5 4)
226.0 6 1.3
(n 5 4)
21.90 6 1.33
(n 5 4)
a
Plants were grown in or near flooded rice field plots in 2007 or 2008 (or both years).
b
Values in columns are the estimated means according to an LSmeans test in Proc Mixed. Values followed by the same letter were not different according to LSmeans
(P 5 0.05). The additional O. sativa entries (bottom section of table) that were evaluated in 1 yr only were not included in the statistical analysis with other data. Only the
means and standard deviations of subsamples were calculated.
c
The d
13
C of yellow nutsedge nutlets averaged 211.53% (data from 2008 only; not included in statistical analysis; not corrected for soil contamination). The
additional O. sativa entries were obtained from same field location as species above, evaluated 1 yr only, and were not included in statistical analysis. Plant growth
environment: rice cultivars, red rice lines, redstem, and gooseweed obtained from flooded rice fields; bearded sprangletop from flooded rice fields or area adjacent to rice
field levees; all other plant species from areas adjacent to rice field levees.
d
Corrected root d
13
C values were calculated using Equation 8.
e
For the difference, ‘‘shoot minus corrected root,’’ a value . 0 indicates that root value is lower (d
13
C is more negative; tissue is more
13
C-depleted) than shoot value.
* indicates that the shoot-corrected root difference within that species is different from zero (i.e., shoot and root values are different from one another) according to an
LSmeans test (P 5 0.05).
Gealy and Gealy:
13
Carbon isotope discrimination in rice–weed root interactions N 593
were greater than shoot d
13
C levels in 4593 indica rice only,
but a similar trend was noticed in PI 312777 indica rice (2008
only) (Table 2). This tendency toward greater d
13
C levels in
roots than in shoots of rice was even more pronounced in the
pot experiments (Table 1).
Earlier studies have also reported a tendency toward lower
shoot d
13
C levels (greater
13
C discrimination) in indica than
in japonica rices (Dingkuhn et al. 1991; Kondo et al. 2004;
Peng et al. 1998). By contrast, screening of 57 3- to 4-wk-old
rice cultivars showed that
13
C discrimination averaged about
1.7% lower in indica types compared with tropical japonica
types (Xu et al. 2009). In the present studies, d
13
C levels
differed between tropical japonica and indica rice only in
greenhouse pots where the
13
C discrimination was 3.8%
greater in shoots of PI 312777 indica compared with Lemont
(Table 1). Similar but nonsignificant trends were observed for
root d
13
C levels in pots in both greenhouse and field
environments. Under environments that may be particularly
stressful to one of these rice types and not the other (e.g., cool
early-season conditions that are more stressful to indicas than
japonicas), the d
13
C signatures of these two rice types could
change slightly. These differences would be expected to be no
more than a few percent, however, and are not likely to
contribute substantially to errors in d
13
C root analysis studies.
Separate monoculture standards of tropical japonica and
indica cultivars could be grown if greater precision for rice
d
13
C values is desired.
Overall, the d
13
C levels in rice in the field and greenhouse
environments in the present study ranged from about 227%
to 232%.Ad
13
Cof232% equates to about the greatest
13
C discrimination reported by Xu et al. (2009) in a
comparison of 116 accessions from seven different Oryza
species in well-watered greenhouse pots. The lowest
13
C
discrimination level in our test (d
13
C 5 227%) equates to
about 12% lower than the minimum reported by Xu et al.
(2009). This may be attributable to our later growth stage of
sampling (mature vs. 3- to 4-wk-old plants), and the
possibility that as plants matured in pots, they experienced
additional stress due to pot-bound roots (Comstock et al.
2005). This type of stress was apparently avoided in the Xu et
al. (2009) study. Scartazza et al. (1998) have reported
13
C
discrimination levels in potted rice plants similar to those in
the present study and showed that the discrimination
decreased by , 10% in 170-d-old plants compared with
20-d-old plants.
Corrected root d
13
C levels in C
3
plants averaged 100%
(14%) lower, and all rice cultivars were at least 58% (9.9%)
lower compared with the C
4
plants grown in field plots in
2007 and 2008 (Table 2). These contrasts between C
3
and C
4
plants are similar to those observed in the pot experiment,
again confirming our C
4
weeds to be ideal for d
13
C rice root
interaction studies in field soils. The d
13
C values for
barnyardgrass and fall panicum roots were statistically
indistinguishable in all of the environments/years evaluated
in this study (Tables 1 and 2). Thus,
13
C discrimination
methods potentially could be used to evaluate the combined/
average effects of these two common C
4
weeds in mixtures
with rice in the field. Because of their distinctively high d
13
C
levels and the resulting large d
13
C differential with rice, yellow
nutsedge, and perhaps crabgrass may be especially well suited
to
13
C discrimination studies, and potentially could yield root
mixture data that are more accurate than those of the other C
4
weed species (Table 2).
Root d
13
C l evels i n gooseweed, redstem, AR-1995-StgB red
rice, and all rice cultivars were similar, averaging , 227.9%
(Table 2). These data confirmed that these three weed species are
C
3
plants similar to rice, and thus unsuitable for
13
C
discrimination studies with rice–weed root mixtures. United
States red rice types often share key genetic traits with indica rice
(Gealy et al. 2009; Londo and Schaal 2 007; Vaughan et al. 2 001).
Generally consistent trends between d
13
C levels of roots
and shoots of key C
4
weed species and rice were observed in
these studies (Tables 1 and 2). d
13
C levels in roots of C
4
weeds (except for crabgrass and yellow nutsedge) and rice were
1.0 to 1.1 times and 0.9 to 1.0 times the respective levels in
shoots. Such trends between the d
13
C levels in these plant
organs have been observed in numerous species (Badeck et al.
2005; Klumpp et al. 2005; Scartazza et al. 1998). If
monoculture root samples were unreliable or unavailable for
some reason, shoot d
13
C values potentially could be
substituted for root d
13
C values, or used as an internal
standard check for d
13
C levels within the same plant.
Carbon Content and Mass of Roots and Shoots. The shoot
C fraction of C
4
weed species ranged from 41 to 44% in pot
studies (Table 3) and from 39 to 42% in the field survey
(Table 4). The shoot C fraction of rice in pot studies
(Table 3) ranged between 41 and 42%, and in the expanded
field survey (Table 4) was more variable and slightly lower,
ranging from 34 to 39%. These rice shoot C fraction levels are
similar to those reported for rice in an earlier study where the
foliar C fraction of an indica subgroup, aus (0.392), was lower
(P , 0.01) than for indica (0.402) or tropical japonica
(0.404) groups (Dingkuhn et al. 1991).
In the pot studies, C fraction of root samples was generally
greatest in barnyardgrass and broad-leaved signalgrass in the
greenhouse and lowest in rice in the field (Table 3). The C
fraction of root samples, particularly for rice, was often much
lower than in shoots (Tables 3 and 4), a phenomenon that has
been attributed primarily to presence of difficult-to-remove
soil residue (Gealy and Fischer 2010). In the pot and survey
studies conducted in the field in 2007, C fraction of root
samples of some rice cultivars (e.g., PI 312777 and CL 141)
averaged as much as 80% lower than the levels in shoots
(Tables 3 and 4). Implementation of a more vigorous root
cleaning/extraction process in the 2008 field study resulted in
substantially greater C fraction levels in roots that often
approached those in shoots (data not shown), and a trend
toward higher root C fraction values that year (Table 4). This
improvement was also evident in the additional rice and red
rice entries sampled from field plots in 2008 compared with
2007 (Table 4; ‘‘additional entry’’ section). In most entries
collected exclusively in 2008, C fractions were only 0 to 4%
less in root samples than in shoots, although in PI 312777 the
C fraction was 23% less in roots than shoots.
By co ntrast, t he C fraction of r oot sa mples co llected exclusivel y
in 2007 averaged 63% less t han in s hoots. The m asses of t he 2007
root samples were also unusually high, averaging fo ur times greater
than those in 2008, which further indicated heavy soil
contamination in 2007. Similar large discrepancies in C fractions
and masses between rice root and shoot samples also were observed
in the 2007 field pot study (Table 3).
Because of the variation and uncertainties in C fraction and
mass of root samples caused by soil contamination, we
performed a mathematical calculation that corrected root
594
N Weed Science 59, October–December 2011
Table 4. Carbon content and mass of additional weed species and rice cultivars growing in or near rice field plots, and the application of a mathematical correction for
soil contamination in roots.
a,b
Species
c
C content (C fraction 3 100) Mass
Shoot Root Shoot Root Corrected root
d
Soil calculated
d
% g plant
21
Bearded sprangletop 41.4 bc 29.0 b–f 89.4 bc 18.3 b–d 10.2 a–c 8.1 bc
Amazon sprangletop 41.5 bc 30.5 a–e 54.0 b–d 9.0 d 5.1 b–d 3.9 c
Barnyardgrass 39.6 c–e 37.0 a–c 66.3 b–d 9.6 d 8.7 a–d 0.9 c
Broadleaf signalgrass 39.6 c–e 34.4 a–d 54.4 b–d 4.6 d 3.1 cd 1.5 c
Fall panicum 40.6 cd 28.1 b–f 141.8 a 16.3 cd 10.9 ab 5.4 c
Crabgrass 38.8 de 41.1 a 94.6 a–c 4.3 d 4.1 b–d 0.2 c
Yellow nutsedge
c
39.4 c–e 38.9 ab 25.8 d 5.8 d 5.2 b–d 0.5 c
Redstem 43.1 ab 24.7 d–f 18.4 d 5.1 d 2.7 d 2.4 c
Gooseweed 45.0 a 27.9 b–f 26.2 d 16.0 cd 6.4 b–d 9.6 bc
AR-1995-StgB awned red rice 37.7 e 26.4 c–f 101.6 ab 21.6 a–d 13.6 a 8.0 bc
Wells long-grain rice 37.8 e 22.1 ef 67.9 b–d 47.5 a 14.0 a 33.5 a
4593 indica rice 37.3 e 21.3 ef 55.6 b–d 45.4 ab 8.6 a–d 17.5 a–c
Bengal medium-grain rice 37.9 e 18.9 f 46.3 cd 46.2 ab 8.6 a–d 37.7 a
XL723 hybrid rice 37.8 e 21.4 ef 56.7 b–d 39.6 a–c 10.7 ab 28.9 ab
Additional entries from same field location
c
AR-1995-StgS awnless
red rice (2007 only)
36.6 6 0.8
(n 5 4)
20.2 6 6.2
(n 5 4)
100.1 6 62.9
(n 5 4)
41.9 6 39.7
(n 5 4)
17.5 6 7.8
(n 5 4)
24.4 6 32.2
(n 5 4)
AR-1994-8 awned
red rice (2008 only)
36.4 6 0.6
(n 5 4)
35.3 6 2.9
(n 5 4)
69.8 6 18.4
(n 5 4)
12.0 6 5.1
(n 5 4)
11.5 6 5.4
(n 5 4)
0.5 6 0.6
(n 5 4)
AR-1994-11D awned
red rice (2008 only)
35.3 6 1.0
(n 5 4)
33.8 6 3.1
(
n 5 4)
116.8 6 53.3
(n 5 4)
16.6 6 4.2
(n 5 4)
15.6 64.1
(n 5 4)
6 1.5
(n 5 4)
LA-1995-LA3 awned
red rice (2008 only)
34.9 6 1.3
(n 5 4)
33.7 6 1.5
(n 5 4)
145.6 6 54.1
(n 5 4)
20.8 6 5.5
(n 5 4)
19.9 6 5.8
(n 5 4)
0.9 6 0.8
(n 5 4)
Lemont (2008 only) 35.7 6 0.6
(n 5 4)
35.7 6 5.3
(n 5 3)
15.8 6 4.2
(n 5 4)
6.7 6 1.8
(n 5
4)
6.4 6 2.1
(n 5 4)
0.3 6 0.6
(n 5 4)
CL 141 (2007 only) 38.9 6 0.5
(n 5 4)
7.2 6 2.2
(n 5 4)
70.4 6 44.8
(n 5 4)
70.3 6 42.8
(n 5 4)
11.6 6 7.5
(n 5 4)
58.6 6 35.8
(n 5 4)
PI 312777 (2008 only) 34.2 6 2.5
(n 5 4)
26.4 6 3.7
(n 5 4)
24.5 6 13.7
(n 5 4)
8.4 6 4.9
(n 5 4)
6.2 6 4.9
(n 5 4)
2.1 6 1.7
(n 5 4)
a
Plants were grown in or near flooded rice field plots in 2007 or 2008 (or both years).
b
Values in columns are the arithmetic means. Values followed by the same letter were not different according to Duncan’s multiple range test (P 5 0.05). The
additional O. sativa entries (bottom section of table) that were evaluated in 1 yr only were not included in the statistical analysis with other data. Only the means and
standard deviations of subsamples were calculated.
c
Carbon content of yellow nutsedge nutlets averaged 41.9% (data from 2008 only, and were not included in statistical analysis; values not corrected for soil
contamination). The additional O. sativa entries were obtained from same field location as species above, evaluated 1 yr only, and were not included in statistical analysis.
Plant growth environment: rice cultivars, red rice lines, redstem, and gooseweed obtained from flooded rice fields; bearded sprangletop from flooded rice fields or area
adjacent to rice field levees; all other plant species from areas adjacent to rice field levees.
d
Corrected root mass was calculated using Equation 4. Soil mass was calculated using Equation 5.
Table 3. Carbon content and mass of weed and rice samples from pots maintained in greenhouse or field environments, and the application of a mathematical correction
for soil contamination in roots.
a,b
Species
Growth
environment
C content (C fraction 3 100) Mass
Shoot Root Shoot Root Corrected root
c,d
Soil calculated
c
% g plant
21
Barnyardgrass Greenhouse 40.7 f 28.9 ab 27.1 a 7.8 c 5.3 2.3 b
Field 41.5 d–f 11.5 c–e 17.2 a–c 41.2 ab 9.6 31.4 a
Bearded sprangletop Greenhouse 42.5 a–d 27.2 a–c 20.2 ab 7.9 c 4.6 3.0 b
Field 43.5 ab 19.0 a–e 29.0 a 18.4 bc 6.8 9.8 b
Broadleaf signalgrass Greenhouse 42.1 c–e 32.0 a 17.1 a–c 4.7 c 2.9 1.5 b
Field 41.7 c–f 27.3 a– 6.8 bc 11.4 c 6.4 4.8 b
Fall panicum Greenhouse 42.9 a–c 26.9 a–c 29.3 a 12.2 c 7.0 5.1 b
Field 43.48 a 24.2 a–d 4.3 c 10.9 c 4.3 6.5 b
Lemont rice Greenhouse 42.1 b–e 25.1 a–d 21.9 a 10.7 c 5.9 4.6 b
Field 41.5 d–f 9.8 de 19.3 ab 59.2 a 13.1 45.9 a
PI 312777 rice Greenhouse 40.9 ef 16.1 b–e 18.9 ab 14.7 c 5.4 9.1 b
Field 41.2 d–f 7.8 e 17.6 a–c 51.7 a 8.6 42.9 a
not significant at
P 5 0.05
a
Plants were grown in flooded pots in soil in the field or greenhouse during 2007.
b
Values in columns are the estimated means according to an LSmeans test. Values followed by the same letter were not different according to LSmeans (P 5 0.05).
c
Corrected root mass was calculated using Equation 4. Soil mass was calculated using Equation 5.
d
Corrected root mass. Main effect means for growth environment; field 5 8.12 g and greenhouse 5 5.18 g (P 5 0.0042). Main effect means for species (P 5 0.0865).
Species 3 growth environment interaction (P 5 0.1012).
Gealy and Gealy:
13
Carbon isotope discrimination in rice–weed root interactions N 595
mass values on the basis of the observation that the expected C
fractions in roots and shoots should be about equal. These
corrections revealed that soil contamination of root samples
was substantially greater in the field pots than in the
greenhouse pots (Table 3). In field pots, soil contamination
in rice was typically greater than in the weed species (except
barnyardgrass), a trend that appeared to be associated with
greater corrected root mass (Table 3). In field pots, PI 312777
root samples contained five times as much soil mass as root
mass. Similar to the results in field pots, rice root samples
from the field plot areas were more contaminated with soil
than were the weed species (Table 4). Densely packed roots
emanating from below the crown area of some rice cultivars or
their fibrous nature may have facilitated the retention of soil
particles by rice roots. Although few differences among soil-
corrected root mass values were significant, root masses of
Wells rice and AR-1995-StgB red rice averaged more than
four times the mass of broadleaf signalgrass and redstem
(Table 3).
An additional helpful procedure for future studies may be
to discard all tissues from the top 1 to 2 cm of the crown area
of rice roots below the soil surface where soil can be heavily
compacted within the dense root mass. This step would
ensure that soil trapped in these upper roots would not be
inadvertently included with standards or ordinary samples.
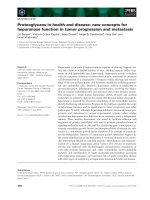
Soil Supplementing Experiment. Supplementing clean
monoculture rice and barnyardgrass roots with soil demon-
strated that increased soil mass in root mixtures caused large,
near-linear reductions in the sample C fraction (f ) levels
(Figures 1A and 1B). Equation 4 shows how the corrected
root mass (M
1
) will be reduced when the sample C fraction
(f ) is reduced by soil contamination. Equation 5 shows the
mass of the soil contamination. Because the C fraction of soil
(f
s
) was ,, that of the roots (f
1
) or sample (f ) in our study,
its effect on root mass estimates should be minimal except at
high soil contamination levels in which the C fractions of the
sample begin to approach the low levels for soil (Equation 4).
The calculated and actual root masses of rice and barnyard-
grass in sample mixtures were highly correlated (R
2
. 0.98;
R . 0.97), indicating a substantial benefit from the soil
correction (Figures 2A and 2B). It should be noted, however,
that an underestimation of the true root C fraction value
(i.e., from an unusually low f
1
shoot value in the present study)
used in Equation 4 would result in a higher-than-expected
corrected root mass (M
1
) value.
In contrast to its large effect on sample C fraction, soil
contamination affected d
13
C levels minimally at levels below
87% (Figures 3A and 3B). With a C fraction of only
0.008335 (, 1.44% soil organic matter according to a
conventional estimation procedure for this soil; Morteza
Mozaffari, personal communication, University of Arkansas,
2010), this soil contributed only , 14% of the carbon to
samples containing 87% soil. Thus, its influence on sample
d
13
C values will be minor except at low sample C fraction
levels. Corrected d
13
C values closely paralleled those for the
Figure 1. Response of carbon content to the quantity of supplemental soil
present in ground root samples of Wells rice (A) and barnyardgrass (B).
Figure 2. Comparison of calculated and actual mass of ground Wells rice (A)
and barnyardgrass (B) roots with supplemental soil added. Calculated values were
determined using Equation 4.
596 N Weed Science 59, October–December 2011
analyzed sample mixtures containing up to 75% soil, but at
87.5% soil, they underestimated the analyzed samples by 4%
in rice and overestimated them by 5% in barnyardgrass
(Figures 3A and 3B). The reason for these discrepancies is
uncertain, but incomplete mixing during sample preparation
or errors in any of the measured or estimated variable inputs
could have contributed. Simulated d
13
C sample values at
%soil levels $ 88% gradually curved toward the d
13
C soil
value of 221.27% at 100% soil.
To gain insight into the relatively larger effect on d
13
C
sample values of roots contaminated with much higher levels
of soil, we simulated a scenario of increasing C fraction
(organic matter) levels using Equation 8 (rearranged to solve
for the d value). The %soil level was held constant at , 85%
soil (g/g), sample C fraction levels manipulated to maintain
the constant soil%, and other variables held constant. At
increasing soil C fractions, d
13
C values of rice root samples
increased (Figure 4A), whereas those of barnyardgrass root
samples decreased (Figure 4B). The opposite trends for the
responses of the two species occurred because the d
13
C of soil
lies approximately midway between the d
13
C of rice and
barnyardgrass roots. Because the root d
13
C values are
constants in this context, the sample d
13
C values for the C
3
and C
4
species will always converge toward the d
13
C value of
the soil as the soil carbon component becomes more
prominent with increasing soil C fraction levels.
Mathematical equations were developed to correct for the
effects of soil contamination on measurements of plant mass
and d
13
C levels in root samples. d
13
C correction equations
typically resulted in minor adjustments to the raw data from
both rice and C
4
weeds because the d
13
C level of the carbon
associated with soil contamination was greater than that for
rice and less than that for the C
4
weeds. Relative to
uncorrected values, the corrected d
13
C values averaged
0.61% greater in the C
4
plants and 0.89% lower in C
3
plants, and were always within 2.6% of these values, largely
because the C fraction of our low-organic-matter soil was very
small compared with that of the plants. Root d
13
C values for
rice were usually affected slightly more than those for C
4
weeds, probably because of the greater soil contamination in
rice roots.
Development of Predictive Correction Equations for Rice
and C
4
Weed Root Mixtures with Soil Contamination.
Root interaction studies using
13
C methods are inevitably
accompanied by unpredictable variability in the d
13
C values
Figure 3. d
13
C levels in ground root tissues of Wells rice (A) and barnyardgrass
(B) with supplemental soil added, as determined from laboratory analysis and
calculation by correction equations. Calculated values were determined using
Equation 8. Most of the symbols depicting calculated values (black diamonds) at
soil levels less than 85% have been obscured significantly by the symbols
depicting the corresponding sample values (black circles), and may not be visible.
Expected d
13
C values for soil levels of 88 to 99.8% were simulated by solving
Equation 8 (after rearrangement) for d
13
C of sample at the sample C fractions
equivalent to the respective soil% values, and all other variables held constant.
Figure 4. Simulation of the expected d
13
C(d)valuesinrice(A)and
barnyardgrass (B) samples containing increasing soil C fractions (f
s
). The soil
contamination level was held constant at , 85% (g/g) by adjusting the sample C
fractions to the appropriate level. All other variables were held constant. Expected
d
13
C values were determined from Equation 8 (after rearrangement) by solving
for d
13
C of sample (d) at each sample C fraction.
Gealy and Gealy:
13
Carbon isotope discrimination in rice–weed root interactions N 597
of monoculture rice roots and C
4
weed roots (usually small),
and in the soil contamination of the samples (usually larger,
less predictable). We derived equations to calculate corrected
root masses of C
3
rice (M
1
) and C
4
weeds (M
2
) in the
presence of soil (M
s
) contamination (Equations 23 or 24, and
25). We propose these corrections to address uncertain levels
of soil contamination and unequal species C fraction levels in
root mixtures analyzed with
13
C methods. They should also
be adaptable to root interactions of other C
3
-C
4
species
systems. Insight can be obtained by graphing results from a
range of expected input data. For instance, at fixed values of
sample d
13
C (e.g., d 5 225 or 217%) and other key input
variables, increases in sample C fraction (i.e., decreasing soil
contamination) will produce increases in the root masses of
bearded sprangletop (Figures 5A and 5C) and yellow
nutsedge (Figures 5B and 5D). Reducing the sample C
fraction to 0.2 from typical actual C fraction levels of , 0.38
to 0.40 is accompanied by an increase in soil mass to about
50% of the total sample mass (Figures 5A–5D). However, for
the same sample C fraction of 0.2, and soils containing a 103
higher C fraction, the soil mass will increase (, 40% at d
sample 5 225%) relative to rice and yellow nutsedge root
masses (data not shown). A greater root mass for C
4
weeds
relative to rice is also predicted as the sample d
13
C values
approach those of rice. The range of responses for the five
other C
4
weed species in this study fall between those of
yellow nutsedge and bearded sprangletop, because these two
species represented the maximum difference in d
13
C values
among the C
4
species.
Plants in the present study were not intentionally exposed to
stress. However, it should be noted that stress can alter d
13
C
levels in plants. Rice discriminated progressively less against
13
C
with increased duration of water deficit stress (Scartazza et al.
1998), and Zhao et al. (2004) reported similar results in upland
rice.
13
C discrimination in C
4
Kallar grass was about 3% less
under water deficits compared with well-watered conditions
(Akhter et al. 2003). In C
4
corn, however,
13
C discrimination
was increased by water-deficit stress and decreased by nitrogen-
deficit stress (Clay et al. 2005; Kim et al. 2008).
Assessing belowground plant interference in rice is
inherently difficult and prone to inaccuracies. Seven of the
10 troublesome rice weed species evaluated proved to be C
4
plant types and well suited to a
13
C discrimination approach
to rice root interference studies in field or greenhouse
environments. Among the C
4
weed species, bearded sprangle-
top was the most
13
C-depleted and yellow nutsedge was the
least
13
C-depleted. The greater difference between rice and
yellow nutsedge d
13
C values may result in less experimental
variability and greater accuracy for
13
C discrimination results
for this weed species compared with bearded sprangletop.
Application of postanalysis mathematical corrections derived
from plant or soil sample data provided accurate estimates of
root mass and d
13
C values in samples containing single species–
soil mixtures or C
4
species–C
3
species–soil mixtures over a wide
range of input conditions. Because they provide accurate
estimates of root mass without requiring complete soil removal
from samples, these correction procedures may help reduce
time and labor requirements, and also reduce the damage or
Figure 5. Simulated effect of sample C fraction on the mass of rice and C
4
weed roots and soil as calculated from the two-species soil correction equation: (A) light
infestation of bearded sprangletop with d
13
Csample (d) 5 225%; (B) light infestation of yellow nutsedge with d
13
Csample (d) 5 225%; (C) very heavy infestation
of bearded sprangletop with d
13
Csample (d) 5 217%; (D) moderately heavy infestation of yellow nutsedge with d
13
Csample (d) 5 217%. Variable values used in
calculations: C fraction soil (f
s
) 5 0.008335; C fraction rice (f
1
) 5 0.38; C fraction C
4
weed (f
2
) 5 0.40; d
13
Csoil (d
s
) 5 221.27%; d
13
Crice (d1) 5 228%;
d
13
Cyellow nutsedge (d
2
) 5 210%; d
13
C bearded sprangletop (d
2
) 5 216%. Mass values were calculated using Equations 11, 23 or 24, and 25.
598 N Weed Science 59, October–December 2011
loss of fragile root tissues that can result from excessive washing.
They may also be useful in understanding the contributions of
roots to soil carbon turnover.
Sources of Materials
1
Thomas–Wiley Mill, Standard Model No. 3, Arthur H.
Thomas Company, Philadelphia, PA 19106.
2
Thomas–Wiley Mill, Model ED-5, Arthur H. Thomas Com-
pany, Philadelphia, PA 19106.
Acknowledgments
Thanks to Howard Black for his invaluable technical assistance
and statistical analyses; Gordon Miller, Jim Gignac, and Kenneth
Hale for plant sampling, cleaning, and grinding; and Erik Pollock,
University of Arkansas Stable Isotope Laboratory, Fayetteville, AR
( for conducting
13
C iso-
tope discrimination analyses. This work represents the author’s own
views, not those of The Johns Hopkins University Applied Physics
Laboratory, which has no connection with this work. USDA is an
equal opportunity provider and employer.
Literature Cited
Akhter, J., K. Mahmood, M. A. Tasneem, M. H. Naqvi, and K. A. Malik. 2003.
Comparative water-use efficiency of Sporobolus arabicus and Leptochloa fusca
and its relation with carbon isotope discrimination under semiarid conditions.
Plant Soil 249:263–269.
Badeck, F. W., G. Tcherkez, S. Nogue’s, C. Piel, and J. Ghashghaie. 2005.
Postphotosynthetic fractionation of stable carbon isotopes between plant
organs—a widespread phenomenon. Rapid Commun. Mass Spectrom.
19:1381–1391.
Bollich, C. W., B. D. Webb, M. A. Marchetti, and J. E. Scott. 1985. Registration
of ‘Lemont’ rice. Crop Sci. 25:883–885.
Boutton, T. W. 1996. Stable carbon isotope ratios of soil organic matter and their
use as indicators o f vegetation and climate change. Pages 47–82 in T. W. Boutton
and S. Yamasaki, eds. Mass Spectrometry of Soils. New York: Marcel Dekker.
Clay, D. E., S. A. Clay, D. J. Lyon, and J. M. Blumenthal. 2005.
13
C
discrimination in corn grain can be used to separate and quantify yield losses
due to water and nitrogen stresses. Weed Sci. 53:23–29.
Clay, D. E., R. E. Engel, D. S. Long, and Z. Liu. 2001. Using C13
discrimination to characterize N and water responses in spring wheat. Soil Sci.
Soc. Am. J. 65:1823–1828.
Clay, S. A., D. E. Clay, D. P. Horvath, J. Pullis, C. G. Carlson, S. Hansen, and
G. Reicks. 2009. Corn response to competition: growth alteration vs. yield
limiting factors. Agron. J. 101:1522–1529.
Comstock, J. P., S. R. McCouch, B. C. Martin, C. G. Tauer, T. J. Vision, Y. Xu,
and R. Pausch. 2005. The effects of resource availability and environmental
conditions on genetic rankings for carbon isotope discrimination during
growth in tomato and rice. Funct. Plant Biol. 32:1089–1105.
Derner, J. D., H. B. Johnson, and B. A. Kimball, et al. 2003. Above- and
belowground responses of C3–C4 species mixtures to elevated CO
2
and soil
water availability. Glob. Change Biol. 9:452–460.
Dingkuhn, M., G. D. Farquhar, S. K. De Datta, and J. C. O’Toole. 1991.
Discrimination of
13
C among upland rices having different water use
efficiencies. Aust. J. Ag. Res. 42:1123–1131.
Ehleringer, J. R. 1991.
13
C/
12
C fractionation and its utility in terrestrial plant
studies. Pages 187–200 in D. C. Coleman and B. Fry, eds. Carbon Isotope
Techniques. San Diego, CA: Academic Press.
Eleki, K., R. M. Cruse, and K. A. Albrecht. 2005. Root segregation of C
3
and C
4
species using carbon isotope composition. Crop Sci. 45:879–882.
Farquhar, G. D., J. R. Ehleringer, and K. T. Hubick. 1989. Carbon isotope
discrimination and photosynthesis. Annu. Rev. Plant Physiol. Plant Mol. Biol.
40:503–537.
Farquhar, G. D. and L. Lloyd. 1993. Carbon and oxygen isotope effects in the
exchange of carbon dioxide between terrestrial plants and the atmosphere.
Pages 47–70 in J. R. Ehleringer, A. E. Hall, and G. D. Farquhar, eds. Stable
Isotopes and Plant Carbon–Water Relations. New York: Academic.
Farquhar, G. D., M. H. O’Leary, and J. A. Berry. 1982. On the relationship
between carbon isotope discrimination and the intercellular carbon dioxide
concentration in leaves. Aust. J. Plant Physiol. 9:121–137.
Fischer, A. J., G. L. Strong, K. Shackel, and R. G. Mutters. 2010. Temporary
drought can selectively suppress Schoenoplectus mucronatus in rice. Aquat. Bot.
92:257–264.
Gealy, D., B. Ottis, R. Talbert, K. Moldenhauer, and W. Yan. 2005. Evaluation
and improvement of allelopathic rice germplasm at Stuttgart, Arkansas, USA.
Pages 157–163 in Proceedings of the 4th World Congress on Allelopathy.
Wagga Wagga, NSW, Australia: Gosford, NSW, Australia: The Regional
Institute Limited.
Gealy, D. R., H. A. Agrama, and G. C. Eizenga. 2009. Exploring genetic and
spatial structure of U.S. weedy red rice (Oryza sativa) in relation to rice
relatives worldwide. Weed Sci. 57:627–643.
Gealy, D. R. and A. J. Fischer. 2010.
13
C discrimination: a stable isotope method to
quantify root interactions between C
3
rice (Oryza sativa) and C
4
barnyardgrass
(Echinochloa crus-galli) in flooded fields. Weed Sci. 58:359–368.
Gealy, D. R., E. J. Wailes, L. E. Estorninos, Jr., and R.S.C. Chavez. 2003. Rice
cultivar differences in suppression of barnyardgrass (Echinochloa crus-galli) and
economics of reduced propanil rates. Weed Sci. 51:601–609.
[GRIN] Germplasm Resources Information Network. 2010. USDA, ARS,
National Genetic Resources Program, National Germplasm Resources Labora-
tory, Beltsville, MD. . Accessed: September 13, 2010.
Giussani, L. M., J. H. Cota-Sa
´
nchez, F. O. Zuloaga, and E. A. Kellogg. 2001. A
molecular phylogeny of the grass subfamily Panicoideae (Poaceae) shows
multiple origins of C
4
photosynthesis. Am. J. Bot. 88:1993–2012.
Impa, S. M., S. Nadaradjan, P. Boominathan, G. Shashidhar, H. Bindumadhava,
and M. S. Sheshshayee. 2005. Carbon isotope discrimination accurately
reflects variability in WUE measured at a whole plant level in rice. Crop Sci.
45:2517–2522.
Kim, K I., D. E. Clay, C. G. Carlson, S. A. Clay, and T. Trooien. 2008. Do
synergistic relationships between nitrogen and water influence the ability of
corn to use nitrogen derived from fertilizer and soil? Agron. J. 100:551–
556.
Klumpp, K., R. Scha
¨
ufele, M. Lo
¨
tscher, F. A. Lattanzi, W. Feneis, and H.
Schnyder. 2005. C-isotope composition of CO
2
respired by shoots and roots:
fractionation during dark respiration? Plant Cell Environ. 28:241–250.
Kondo, M., P. P. Pablico, D. V. Aragones, and R. Agbisit. 2004. Genotypic
variations in carbon isotope discrimination, transpiration efficiency, and
biomass production in rice as affected by soil water conditions and N. Plant
Soil 267:165–177.
Laza, Ma. R., M. Kondo, O. Ideta, E. Barlaan, and T. Imbe. 2006. Identification
of quantitative trait loci for d
13
C and productivity in irrigated lowland rice.
Crop Sci. 46:763–773.
Linscombe, S. D., F. Jodari, K. S. McKenzie, P. K. Bollich, L. M. White, D. E.
Groth, and R. T. Dunnand. 1993. Registration of ‘Bengal’ rice. Crop Sci.
33:645–646.
Londo, J. P. and B. A. Schaal. 2007. Origins and population genetics of weedy
red rice in the USA. Mol. Ecol. 16:4523–4535.
Moldenhauer, K.A.K., F. N. Lee, J. L. Bernhardt, R. J. Norman, N. A. Slaton,
C. E. Wilson, M. M. Anders, R. D. Cartwright, and M. M. Blocker. 2007.
Registration of ‘Wells’ rice. Crop Sci. 47:442–443.
Muasya, A. M., D. A. Simpson, and M. W. Chase. 2002. Phylogenetic
relationships in Cyperus L. s.l. (Cyperaceae) inferred from DNA sequence data.
Bot. J. Linn. Soc. 138:145–153.
O’Leary, M. H. 1993. Biochemical basis of carbon isotope fractionation. Pages
19–28 in J. R. Ehleringer, A. E. Hall, and G. D. Farquhar, eds. Stable Isotopes
and Plant Carbon–Water Relations. New York: Academic.
Pansak, W., G. Dercon, T. Hilger, T. Kongkaew, and G. Cadisch. 2007.
13
C
isotopic discrimination: a starting point for new insights in competition for
nitrogen and water under contour hedgerow systems in tropical mountainous
regions. Plant Soil 298:175–189.
Peng, S., R. C. Laza, G. S. Khush, A. L. Sanico, R. M. Visperas, and F. V. Garcia.
1998. Transpiration efficiencies of indica and improved tropical japonica rice
grown under irrigated conditions. Euphytica 103:103–108.
Polley, H. W., H. B. Johnson, and H. S. Mayeux. 1992. Determination of root
biomasses of three species grown in a mixture using stable isotopes of carbon
and nitrogen. Plant Soil 142:97–106.
Rajagopalan, G., R. Ramesh, and R. Sukumar. 1999. Climatic implications of d
13
C
and d
18
O r atios from C 3 and C4 plants growing i n a tropical montane habitat in
southern India. J. Biosci. 24:491–498.
Sage, R. F. 2004. The evolution of C
4
photosynthesis. New Phytol. (Tansley
review)161:341–370.
Scartazza, A., M. Lauteri, M. C. Guido, and E. Brugnoli. 1998. Carbon isotope
discrimination in leaf and stem sugars, water-use efficiency and mesophyll
conductance during different developmental stages in rice subjected to
drought. Aust. J. Plant Physiol. 25:489–498.
Gealy and Gealy:
13
Carbon isotope discrimination in rice–weed root interactions N 599
Scott, R. C., J. W. Boyd, K. L. Smith, G. Selden, and J. K. Norsworthy. 2010.
Recommended chemicals for weed and brush control. University of Arkansas
Extension and U.S. Department of Agriculture. MP-44. Pp. 78–91.
Smith, B. N. and W. V. Brown. 1973. The Kranz syndrome in the Gramineae as
indicated by carbon isotopic ratios. Am. J. Bot. 60:505–513.
Smith, R. J., Jr. 1988. Weed thresholds in southern U.S. rice (Oryza sativa).
Weed Technol. 2:232–241.
Svejcar, T. J. and T. W. Boutton. 1985. The use of stable carbon isotope analysis
in rooting studies. Oecologia 67:205–208.
Svejcar, T. J., T. W. Boutton, and S. Christiansen. 1988. Rooting dynamics of
Medicago sativa seedlings growing in association with Bothriochloa caucasica.
Oecologia 77:453–56.
Vaughan, L. K., B. V. Ottis, A. M. Prazak-Havey, C. A. Bormans, C. Sneller,
J. M. Chandler, and W. D. Park. 2001. Is all red rice found in commercial rice
really Oryza sativa? Weed Sci. 49:468–476.
Vogel, J. C. 1980. Fractionation of the carbon isotopes during photosynthesis.
Silzungsber Heidelb. Akad. Wiss. 3:111–135. [as cited in Akhter et al. 2003.]
Waller, S. S. and J. K. Lewis. 1979. Occurrence of C
3
and C
4
photosynthetic
pathways in North American grasses. J. Range Manage. 32:12–28.
Webster, T. M. (Chair). 2008. Weed survey—southern states, grass crops
subsection. Proc. South. Weed Sci. Soc. 61:234.
West, J. B., G. J. Bowen, T. E. Cerling, and J. R. Ehleringer. 2006. Stable
isotopes as one of nature’s ecological recorders. Trends Ecol. Evol. 21,
(doi:10.1016/j.tree.2006.04.002).
Xu, Y., D. This, R. C. Pausch, W. M. Vonhof, J. R. Coburn, J. P. Comstock, and
S. R. McCouch. 2009. Leaf-level water use efficiency determined by carbon
isotope discrimination in rice seedlings: genetic variation associated with
population structure and QTL mapping. Theor. Appl. Genet. 118:1065–1081.
Zhao, B., M. Kondo, M. Maeda, Y. Ozaki, and J. Zhang. 2004. Water-use
efficiency and carbon isotope discrimination in two cultivars of upland rice
during different developmental stages under three water regimes. Plant Soil
261:61–75.
Received September 23, 2010, and approved May 5, 2011.
600 N Weed Science 59, October–December 2011