Effect of changes in dissolved oxygen concentrations on the spatial dynamics of the gulf menhaden fishery in the northern gulf of mexico
Bạn đang xem bản rút gọn của tài liệu. Xem và tải ngay bản đầy đủ của tài liệu tại đây (328.85 KB, 13 trang )
BioOne sees sustainable scholarly publishing as an inherently collaborative enterprise connecting authors, nonprofit publishers, academic institutions, research
libraries, and research funders in the common goal of maximizing access to critical research.
Effect of Changes in Dissolved Oxygen Concentrations on the Spatial Dynamics of
the Gulf Menhaden Fishery in the Northern Gulf of Mexico
Author(s): Brian J. Langseth, Kevin M. Purcell, J. Kevin Craig, Amy M. Schueller, Joseph W. Smith, and
Kyle W. ShertzerSean Creekmore and Kenneth A. RoseKatja Fennel
Source: Marine and Coastal Fisheries: Dynamics, Management, and Ecosystem Science, 6():223-234.
2014.
Published By: American Fisheries Society
URL: />BioOne (www.bioone.org) is a nonprofit, online aggregation of core research in the biological, ecological, and
environmental sciences. BioOne provides a sustainable online platform for over 170 journals and books published
by nonprofit societies, associations, museums, institutions, and presses.
Your use of this PDF, the BioOne Web site, and all posted and associated content indicates your acceptance of
BioOne’s Terms of Use, available at www.bioone.org/page/terms_of_use.
Usage of BioOne content is strictly limited to personal, educational, and non-commercial use. Commercial inquiries
or rights and permissions requests should be directed to the individual publisher as copyright holder.
Marine and Coastal Fisheries: Dynamics, Management, and Ecosystem Science 6:223–234, 2014
C
American Fisheries Society 2014
ISSN: 1942-5120 online
DOI: 10.1080/19425120.2014.949017
ARTICLE
Effect of Changes in Dissolved Oxygen Concentrations
on the Spatial Dynamics of the Gulf Menhaden Fishery
in the Northern Gulf of Mexico
Brian J. Langseth,*
,1
Kevin M. Purcell, J. Kevin Craig, Amy M. Schueller,
Joseph W. Smith, and Kyle W. Shertzer
National Oceanic and Atmospheric Administration, National Marine Fisheries Service, Southeast
Fisheries Science Center, Beaufort Laboratory, 101 Pivers Island Road, Beaufort, North Carolina
28516, USA
Sean Creekmore and Kenneth A. Rose
Department of Oceanography and Coastal Sciences, Louisiana State University, 2135 Energy, Coast,
and Environment Building, Baton Rouge, Louisiana 70803, USA
Katja Fennel
Oceanography Department, Dalhousie University, 1355 Oxford Street, Halifax, Nova Scotia B3H 4R2,
Canada
Abstract
Declines in dissolved oxygen (DO) concentrations in aquatic environments can lead to conditions of hypoxia
(DO ≤ 2 mg/L), which can directly and indirectly affect aquatic organisms. Direct effects include changes in growth
and mortality; indirect effects include changes in distribution, movement, and interactions with other species. For
mobile species, such as the pelagic filter-feeding Gulf Menhaden Brevoortia patronus, indirect effects are more
prevalent than direct effects. The northern Gulf of Mexico experiences one of the largest areas of seasonal hypoxia in
the world; this area overlaps spatially and temporally with the Gulf Menhaden commercial purse-seine fishery, which
is among the largest fisheries by weight in the United States. Harvest records from the Gulf Menhaden fishery in 2006–
2009 and fine-scale spatial and temporal predictions from a physical–biogeochemical model were used with spatially
varying regression models to examine the effects of bottom DO concentration, spatial location, depth, week, and year
on four response variables: probability of fishing, total Gulf Menhaden catch, total fishery effort, and CPUE. We
found nearshore shifts in the probability of fishing as DO concentration declined, and we detected a general westward
shift in all response variables. We also found increases in CPUE as DO concentration declined in the Louisiana Bight,
an area that experiences chronic, severe hypoxia. The overall effects of environmental conditions on fishing response
variables appeared to be moderate. Nevertheless, movement of either Gulf Menhaden or the purse-seine fishery in
response to environmental conditions could potentially affect the susceptibility of Gulf Menhaden to harvest and
could therefore influence assessment of the stock and associated stock status indicators.
Declines in the concentration of dissolved oxygen (DO)
in water can affect the magnitude of fishery landings in two
Subject editor: Richard Brill, Pacific Biological Station, British Columbia, Canada
*Corresponding author:
1
Present address: National Oceanic and Atmospheric Administration, National Marine Fisheries Service, Pacific Islands Fisheries Science
Center, Inouye Regional Center, 1845 Wasp Boulevard, Building 176, Honolulu, Hawaii 96818, USA.
Received March 4, 2014; accepted June 26, 2014
fundamental ways. The first is through direct effects on pro-
cesses that underlie biological production, such as changes in
223
224 LANGSETH ET AL.
growth (McNatt and Rice 2004; Stierhoff et al. 2009), mortality
(Shimps et al. 2005), and reproduction (Thomas and Rahman
2012), which can lead to changes in abundance. The second is
through indirect effects on the spatial and temporal dynamics
of the targeted resource, such as shifts in distribution, which
can influence the interaction between the resource and the fish-
ery, independent of the resource’s abundance (Breitburg et al.
2009; Craig 2012; Stramma et al. 2012). Many studies have
assessed the direct and indirect effects of low DO concentra-
tions on aquatic organisms (Pollock et al. 2007). Although the
relative magnitude of direct and indirect effects depends on the
organism as well as on the DO concentration, there is growing
evidence that for mobile species, indirect effects are more im-
portant than direct effects (Craig et al. 2001; Breitburg et al.
2009; Rose et al. 2009).
The northern Gulf of Mexico (GOM) experiences one of the
largest areas of seasonal hypoxia (DO ≤ 2 mg/L) in the world
(Rabalais et al. 2002). Riverine inputs from the Mississippi–
Atchafalaya River system, which drains 41% of the contiguous
United States, contribute large amounts of nutrients to nearshore
coastal Louisiana waters. These nutrients stimulate high rates of
primary production, which can lead to high rates of microbial
respiration and ultimately reduce the concentration of DO in the
water column (Rabalais et al. 2002; Bianchi et al. 2010). If strat-
ification of the water column is strong enough that re-aeration
of bottom waters is inhibited, then the DO concentration can de-
cline sufficiently to cause widespread hypoxia. In the northern
GOM, hypoxia typically peaks in summer (June–August), when
the water column is strongly stratified and nutrient inputs from
spring runoff have stimulated high levels of primary production
(Rabalais et al. 2002; Bianchi et al. 2010). The spatial extent of
seasonal hypoxia in the northern GOM can be extensive in some
years, exceeding 20,000 km
2
and spreading westward from the
outflow of the Mississippi River (i.e., the Mississippi Delta) to
as far as the Louisiana–Texas border (Rabalais et al. 2007).
Similar to other highly productive systems that are suscepti-
ble to hypoxia, the northern GOM also supports highly produc-
tive fisheries (Breitburg et al. 2009). Landings of Gulf Menhaden
Brevoortia patronus annually rank first among GOM fisheries
landings and second among U.S. fisheries landings in terms of
weight (NMFS 2012). Gulf Menhaden are small clupeid fish that
form large, dense, near-surface schools during spring through
fall in the northern GOM (Ahrenholz 1991). The schools are
targeted by large purse-seine vessels, which are guided to the
schools with the assistance of aerial spotter pilots. The fish-
ery operates from mid-April through late October, and monthly
landings usually peak between June and August. Fishing opera-
tions are coastal in nature, with about 90% of the catch occurring
within 16.09 km (10 mi) of shore (Smith et al. 2002). Catches
range from eastern Mississippi to eastern Texas, but most (up
to 90%) of the harvest occurs off the coast of Louisiana (Smith
et al. 2002). Hence, there is strong spatial and temporal overlap
between the purse-seine fishery for Gulf Menhaden and seasonal
hypoxia in the northern GOM.
Gulf Menhaden and other pelagic species are influenced by
direct effects of exposure to low DO but are probably more sus-
ceptible to indirect effects associated with avoidance because
they are highly mobile and mostly utilize the upper water col-
umn above the low-DO bottom layer. Among field studies in the
northern GOM, pelagic fishes avoided areas of low bottom DO
and aggregated both horizontally and vertically near the edges
of the GOM hypoxic zone (Hazen et al. 2009; Zhang et al.
2009). Similar aggregations along the edges of hypoxic zones
have been observed for shrimp in the GOM (Craig and Crowder
2005; Craig et al. 2005; Craig 2012), and aggregations above
hypoxic zones have also been observed for pelagic species in
the Laurentian Great Lakes (Vanderploeg et al. 2009), Chesa-
peake Bay (Ludsin et al. 2009), and the northeast Atlantic Ocean
(Stramma et al. 2012). Comparisons of results from simulation
models that integrated multiple direct and indirect effects of hy-
poxia also suggested that indirect effects due to altered spatial
distributions or food web interactions had a greater effect on
growth and survival than direct effects of exposure to low DO
concentrations (Rose et al. 2009).
Despite evidence for direct and indirect effects of hypoxia on
pelagic fish species as well as other marine organisms, there is
limited evidence that hypoxia broadly affects fishery landings
(Breitburg et al. 2009; Rose et al. 2009; Bianchi et al. 2010).
However, Zimmerman and Nance (2001) and later O’Connor
and Whitall (2007) found negative correlations between the area
of hypoxia in the GOM and landings in the commercial shrimp
fishery. Conceptually, distributional changes influenced by hy-
poxia have implications for commercial fisheries. Aggregation
along the edge of hypoxic zones has the potential to enhance the
catch rates of targeted species as well as affect the overlap be-
tween target species and bycatch species at small spatial scales
(Craig 2012; Craig and Bosman 2013). Aggregation above hy-
poxic zones can similarly enhance catch rates by making pelagic
species more susceptible to pelagic fishing gears (Ludsin et al.
2009; Vanderploeg et al. 2009; Zhang et al. 2009; Stramma et al.
2012).
Only one previous study has used commercial fishery data
to assess the effects of hypoxia on the catch distribution in the
northern GOM Gulf Menhaden fishery (Smith 2001). Smith
(2001) divided Gulf Menhaden landings into a 10- × 10-min
spatial grid for each of 3 months (June–August) during 3 years
(1994–1996) and qualitatively compared landings patterns to
the overall areal extent of hypoxia each year. He hypothe-
sized that (1) Gulf Menhaden harvest would decline during
extreme years of hypoxia, when low DO concentrations im-
pinged along the shoreline; and (2) a continuous band of hy-
poxia along the northern GOM would concentrate Gulf Men-
haden landings into normoxic waters off western Louisiana.
There was some evidence of reduced catches offshore of
Louisiana during years of severe hypoxia, but conclusions
about finer-scale shifts in the spatial distribution of the fish-
ery were not possible due to the limited spatial resolution of the
data.
GULF MENHADEN FISHERY SPATIAL DYNAMICS 225
Comprehensive empirical information on the spatial and tem-
poral dynamics of the GOM hypoxic zone is limited. The spatial
extent of hypoxia in the GOM has been estimated since 1985
from an annual shelfwide survey conducted during late July
(Rabalais et al. 2007; Obenour et al. 2013). Higher-resolution
temporal data also exist from a mooring at a single location in
the GOM (Rabalais et al. 2007). However, because DO concen-
trations are a function of numerous physical and biological pro-
cesses and can vary in scale both spatially (meters to hundreds
of kilometers) and temporally (minutes to months; Eldridge and
Morse 2008), sampling over time in one location or over space
during one time period is unable to capture the DO variability
that actually exists.
Predictions of DO concentrations from combined physical–
biogeochemical models are an alternative to empirical DO mea-
surements. Several models have been constructed to predict DO
dynamics in the northern GOM and can provide finer-resolution
data from which to assess the effects of DO concentration on
the distribution of fishery landings (Hetland and DiMarco 2008;
Fennel et al. 2013; Justi
´
c and Wang 2014). Although uncertain-
ties in model-derived DO estimates can be amplified by errors
in observation and from the modeling process (Mattern et al.
2013), model-predicted estimates provide spatial and temporal
resolution that is more closely related to the scales over which
hypoxia occurs (Eldridge and Morse 2008). Given the amount
of sampling effort that would be necessary to characterize the
high-resolution spatial (meters) and temporal (days) dynamics
of bottom-water DO concentrations in the northern GOM, it is
likely that model-derived estimates will provide the best avail-
able information for the foreseeable future.
We used spatially explicit regression models (generalized
additive models [GAMs]) to explore the localized effect of
bottom DO concentration and other factors on the harvest of
Gulf Menhaden in the northern GOM. Our objectives were
to determine the extent to which changes in DO concentra-
tion influenced the spatial distribution of the fishery and the
magnitude and rate of harvest. Based on prior studies with
Gulf Menhaden and other pelagic species, we hypothesized
that landings of Gulf Menhaden would be concentrated in lo-
cations surrounding areas of hypoxia and would be sparse in
locations within areas of hypoxia. Output from a predictive
physical–biogeochemical model that provided high-resolution
spatial and temporal DO data was linked to records of indi-
vidual purse-seine sets in the Gulf Menhaden fishery. We then
assessed the spatial effect of DO on four attributes of the com-
mercial fishery: the probability of fishing, total catch, total ef-
fort, and overall CPUE. The effects of DO on these attributes
were examined on the scale of 5- × 5-mingridcells.Wealso
evaluated the influence of other covariates (depth, geographic
location, week, and year) on the spatial and temporal patterns
of fishing within the Gulf Menhaden fishery. We conclude our
analysis with a discussion of the potential application of our re-
sults to the stock assessment for Gulf Menhaden in the northern
GOM.
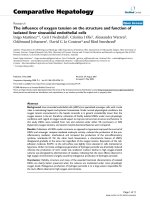
FIGURE 1. Map of fishing locations in the Gulf Menhaden fishery, northern
Gulf of Mexico. Black circles represent cities that currently contain processing
plants for Gulf Menhaden. Contour lines represent the 10-, 20-, 30-, 40-, and
50-m isobaths.
METHODS
Data.—Two data sets were used in our analysis: the first
contained harvest records of individual purse-seine sets for the
Gulf Menhaden fishery (Figure 1), and the second contained en-
vironmental covariates from a physical–biogeochemical model
that were expected to influence harvest. Captains of vessels
in the Gulf Menhaden fishery participate in a logbook pro-
gram called the Captain’s Daily Fishing Reports (CDFRs). Al-
though participation is voluntary, compliance is believed to be
100% (Smith et al. 2002). During the fishing season, CDFRs
are routinely sent to the National Marine Fisheries Service’s
Beaufort Laboratory, where they are digitized and stored elec-
tronically. The CDFRs summarize daily vessel activity, item-
izing individual purse-seine sets with data including informa-
tion on estimated catch, whether a spotter pilot was used to
make the set, set location, the fishing plant where the vessel is
based, estimated distance from shore, day of set, and weather
conditions. Since 2000, Gulf Menhaden have been landed by
about 35–40 vessels for processing at four fish factories lo-
cated at Moss Point, Mississippi, and at Empire, Abbeville,
and Cameron, Louisiana. Catches are reported in units of 1,000
standard fish (1 unit is ∼304 kg; Smith 1991). Fishing loca-
tions have been identified via Global Positioning System co-
ordinates since 2005, which has greatly enhanced the spatial
resolution of the data. Prior to 2005, fishing locations were
based on proximity to known landmarks. In total, 75,132 CDFR
records of purse-seine set locations and catches from 2006 to
2009 were available, but we used 70,570 records in our anal-
ysis. We excluded records where corresponding environmen-
tal covariates (see paragraph below) were unavailable, which
was primarily in the northeastern range of the fishery along the
Mississippi coast but also in intermittent locations along the
shoreline.
The second data set contained predictions of bottom DO
concentrations and associated depths, which were used as
226 LANGSETH ET AL.
environmental covariates in our analysis. Daily predictions
of DO concentrations in the northern GOM over a three-
dimensional irregular grid were available from simulations of
a physical–biogeochemical model (Fennel et al. 2013). Based
on this model, predicted DO concentrations and corresponding
depth values taken at 1600 hours at the minimum of 100 m
or the bottom depth were generated for approximately 1-km
square grids each day from January 1, 2006, to December 29,
2009, between 87.78
◦
W and 94.64
◦
W and between 28.00
◦
N and
30.21
◦
N. The nearest estimates of DO and corresponding depth
were assigned to each fishing record in the CDFR data set to
form a combined data set.
Spatial and temporal aggregation of the combined data set
was necessary to develop suitable response variables with which
to measure effort in the fishery. Data were aggregated spatially
into weekly 5- × 5-min grid cells. We chose to aggregate over
5-min grid cells because they provided a smaller spatial ex-
tent than the 10- × 10-min grids used by Smith (2001) but
were still large enough to provide contrast in effort among
grid cells. We chose to aggregate by week because the fish-
ery operates on a weekly basis, setting nets primarily dur-
ing Monday–Friday. A week was defined as Sunday–Saturday,
starting with the third week in April (week 1; which corre-
sponds to the start of the fishing season) and ending with the
last week in October (week 29). The spatial location (longi-
tude and latitude) for the centroid of each 5- × 5-min grid
cell was used as the spatial identifier in the aggregated data
set, and the nearest DO estimate and corresponding depth for
each fishing record were averaged within each grid × week
combination.
Four response variables were used to investigate the effect
of environmental covariates on harvest in the Gulf Menhaden
fishery. Three response variables were based on only positive
fishing events (i.e., grid × week combinations in which a purse
seine was set), whereas the fourth response variable was a bi-
nary response variable indicating whether a purse seine was
set and was based on all possible grid × week combinations.
Two of the response variables based on positive fishing events
were total catch (in units of 1,000 standard fish) and total effort
(in number of purse-seine sets), summed over all sets within a
grid × week combination. The third response variable was the
CPUE for each grid × week combination and was computed
from the first two response variables as total catch divided by
total effort. The fourth response variable measured the probabil-
ity that fishing occurred in a grid cell. Grid cells where at least
one set for Gulf Menhaden occurred during 2006–2009 were
included in the sample space of total possible grids. Grid cells
where fishing occurred within a week were assigned a value of
1, whereas grid cells where fishing did not occur within a week
were assigned a value of zero. Given that grid × week combina-
tions in which Gulf Menhaden sets did not occur were necessary
when examining the probability of fishing, we changed the way
DO concentrations and corresponding depths were aggregated
when using the probability of fishing as the response variable.
Every DO value and corresponding depth record from the en-
vironmental data set within a 5- × 5-min grid cell (rather than
the DO value and corresponding depth nearest to each fishing
record) was averaged across the week. The final aggregated
data set based on positive fishing events included 7,535 records
for the three response variables (catch, effort, and CPUE), with
longitude, latitude, week, DO, and depth as covariates. The fi-
nal aggregated data set based on all possible fishing locations
included 39,378 records for the binary response variable (prob-
ability of fishing), with longitude, latitude, week, DO, and depth
as covariates.
Regression models.—We used GAMs to determine the ef-
fects of DO and other covariates on the two types of response
variable: (1) measures of harvest where Gulf Menhaden were
caught and (2) the probability of fishing for Gulf Menhaden
at specific grid × week combinations (Hastie and Tibshirani
1986). A spatially varying component for DO was included in
each GAM (Wood 2006) to determine the localized effect of DO
(i.e., effect for each grid cell) on each response variable. We as-
sumed that the effect of DO on each response variable was linear
but that the magnitude and direction of the effect could differ
by location. The interpretation of the spatially varying DO term
is therefore the change in the response variable corresponding
to a unit decrease in DO for each grid cell. We only considered
effects in our analysis that were significantly different from zero
at an α level of 0.05. Spatially varying GAMs have been used to
assess the effects of environmental factors on spatial patterns in
abundance (Bacheler et al. 2009; Bartolino et al. 2011; Ciannelli
et al. 2012) and in commercial fishery landings (Bacheler et al.
2012; Bartolino et al. 2012).
Distributional assumptions are required when using GAMs.
A negative binomial distribution was assumed for catch and
effort (discrete response variables) within each grid × week
combination. Alternative values for the dispersion parameter
of the negative binomial were initially estimated but greatly
increased the computation time. Values of the dispersion pa-
rameters that maximized model fit were estimated at very near
to 1, so the value of 1 was used for the final models. A lognormal
distribution was assumed for CPUE, which was continuous and
nonnormal, and a binomial distribution was used to model the
probability of fishing in a grid × week combination.
We used a similar set of covariates for models of each re-
sponse variable. Covariates included (1) year, which was mod-
eled as a factor and ranged from 2006 to 2009; (2) week, which
was modeled as a continuous variable and ranged from 1 to
29; (3) depth, which was modeled as a continuous variable and
ranged from 5 to 95 m; (4) spatial location (longitude and lat-
itude); and (5) a spatially varying DO term, with DO values
ranging from 0.01 to 10.0 mg/L. The significance of each term
was determined by backward model selection based on Akaike’s
information criterion (AIC; Burnham and Anderson 2002) and
generalized cross-validation (GCV; Wood 2006) scores. If the
removal of any one term resulted in smaller AIC or GCV scores,
then the term was removed from the final model. The full model
GULF MENHADEN FISHERY SPATIAL DYNAMICS 227
for each of the four response variables was
x
ϕ,λ,t,y
= α
y
+ s
1
(ϕ
t,y
, λ
t,y
) + s
2
(ϕ
t,y
, λ
t,y
)D
ϕ,λ,t,y
+g
1
(t) + g
2
(Z
ϕ,λ,t,y
) + ε
ϕ,λ,t,y
, (1)
where x
φ,λ,t,y
is the value of the response variable for each grid
cell with longitude φ and latitude λ in week t and year y; α
y
is the
year-specific intercept; D is the model-predicted DO concentra-
tion for each grid × week combination; Z is the depth for each
grid × week combination; s and g are two-dimensional and
one-dimensional smooths, respectively (Wood 2006); and ε is
the residual error term, which was modeled as N(0, σ
2
) when the
response was log
e
(CPUE). Diagnostics of model residuals from
the full models showed some skewness in negative residuals
for set number and CPUE. Other distributions and assumptions
were explored, but our results were robust to these changes. We
therefore considered our assumptions appropriate. All statisti-
cal modeling was performed by use of the mgcv package in R
version 2.15.1 (Wood 2006; R Core Development Team 2012).
RESULTS
Data
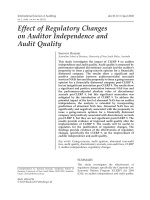
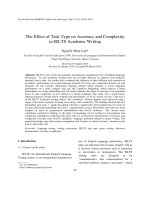
Harvest of Gulf Menhaden in the northern GOM overlapped
with locations that experienced low DO concentrations (Fig-
ures 2, 3). Fishery catches were greatest immediately east of the
Mississippi Delta; immediately west of the Mississippi Delta
(i.e., the Louisiana Bight); and west of Atchafalaya Bay, which
is at the mouth of the Atchafalaya River, extending to the Texas
border (Figure 2). The Louisiana Bight and the region west of
Atchafalaya Bay also experienced the lowest concentrations of
DO, whereas east of the Mississippi Delta, the DO concentra-
tions were generally high (Figure 3). Output from GAMs was
used to better determine the effects of DO concentration on Gulf
Menhaden harvest.
Regression Models
All covariates considered in equation (1) were significant in
explaining each of the four response variables and were included
in all final models (Table 1). We sequentially removed each co-
variate from the final models to determine the importance of
each in explaining model deviance. Depth and spatial location
FIGURE 2. Locations of total Gulf Menhaden landings (millions of fish) at
5- × 5-min grid cells, summed over all fishing sets in the northern Gulf of
Mexico during 2006–2009 (darker shading in cells = more fish caught; lighter
shading in cells = fewer fish caught).
FIGURE 3. Dissolved oxygen (DO) concentrations (mg/L) at 5- × 5-min
grid cells, averaged over all fishing sets in the northern Gulf of Mexico during
2006–2009 within each grid (darker shading in cells = lower DO concentration;
lighter shading in cells = higher DO concentration).
(longitude and latitude) explained the most deviance in the prob-
ability of fishing, catch, and effort for each grid × week com-
bination (Table 1). Lesser amounts of deviance were explained
by spatially varying DO, week, and year. The covariates that
explained the most deviance in CPUE were different than those
explaining the most deviance for the other response variables.
The greatest amount of deviance in CPUE was explained by
week, followed by year, the two spatial terms, and lastly depth.
The total percent deviance explained by the full models ranged
between 10% and 22% depending on the response variable used
(Table 1). The probability of fishing included information on
fished locations as well as nonfished locations, and the amount
of deviance explained by the full model was greater (22.4%)
than that for other response variables (<14.0%).
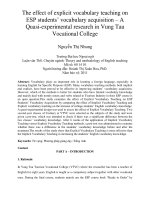
We observed similar patterns in the estimated effects of each
covariate across response variables. As depth increased from all
but the shallowest of waters (5 m), the probability of fishing
(Figure 4A), total catch (Figure 4B), and total effort (Figure 4C)
all declined. The effect of depth on the probability of fishing
(Figure 4A) showed some bimodality, with high values at the
shallowest depths and intermediate (20–40-m) depths. Variation
around the effect of depth was high at greater depths for all
response variables due to fewer data points at those depths. The
effect of depth on the probability of fishing was less variable
than the effects on other response variables because a greater
amount of deviance was explained by the model. Despite the
general decline in catch and effort with increasing depth, CPUE
was relatively constant across the depth range (Figure 4D). The
effect of depth on CPUE barely differed from zero and was only
weakly significant. Wood (2006) recommended caution with
weakly significant terms, so although depth was significant, it
did not appear to affect Gulf Menhaden CPUE.
The general effect of week on Gulf Menhaden harvest was
also similar across all four response variables but was much
smaller in magnitude than the effect of depth (Figure 4). Re-
sponse variables increased from the beginning of the season to a
first peak between week 8 and week 14 (early June to mid-July).
After the initial peak, the response variables declined for a period
of time before increasing to a second peak at week 20–25 (early
August to mid-September). Week of the fishing season had the
strongest effect on CPUE (Table 1), with a well-defined peak
in mid-July (Figure 4H), whereas the other response variables
228 LANGSETH ET AL.
TABLE 1. Generalized cross-validation (GCV) scores, differences in Akaike’s information criterion (δAIC) from the full model, and the percentage of deviance
explained by the full model and each corresponding submodel with one covariate removed for the four response variables (probability of fishing, total Gulf
Menhaden catch, total effort, and CPUE; see Methods). The lowest values of GCV and δAIC for each response variable indicate the best model.
Model GCV δAIC Deviance explained (%)
Probability of fishing
Full model: year + location + (location × DO) + week + depth −0.184 0 22.4
Year removed −0.182 47 22.3
Week removed −0.174 342 21.5
Location × DO removed −0.171 450 21.1
Location removed −0.152 1,092 19.3
Depth removed −0.145 1,336 18.7
Total catch
Full model: year + location + (location × DO) + week + depth 0.68 0 10.0
Year removed 0.683 22 9.7
Week removed 0.699 139 8.8
Location × DO removed 0.699 142 8.6
Location removed 0.701 158 8.4
Depth removed 0.712 241 8.1
Total effort
Full model: year + location + (location × DO) + week + depth −0.062 0 14.0
Year removed −0.061 6.9 13.8
Week removed −0.057 32 13.4
Location × DO removed −0.054 56 12.7
Location removed −0.050 88 12.3
Depth removed −0.034 208 11.3
CPUE
Full model: year + location + (location × DO) + week + depth 0.436 0 11.9
Depth removed 0.437 7.9 11.7
Location removed 0.441 73 10.3
Location × DO removed 0.441 80 10.3
Year removed 0.447 187 9.7
Week removed 0.450 235 8.9
plateaued between June and August (Figure 4E–G). Overall,
the majority of Gulf Menhaden harvest occurred during June–
August.
Relative to other covariates, year explained little of the vari-
ation in response variables except CPUE (Table 1). Conse-
quently, the year effects for CPUE were the largest among
the four response variables, and error bounds of ± 2SEsdid
not overlap zero. Year was modeled as a factor to avoid over-
parameterization, and year effects were estimated relative to a
reference year, which was 2006. Year effects in 2008 were the
most extreme among all years, reducing the probability of fish-
ing by 0.22 and reducing effort by 0.12 relative to 2006 but
increasing catch by 0.13 and increasing log
e
(CPUE) by 0.30
relative to 2006, all on the scale of the link functions. Despite
2008 having large effects, consistent patterns among years for
each response variable were not predicted.
The effect of DO on each response variable varied spatially
and was comparable in magnitude to the overall effects of week
and year (Figure 5). Patterns in local DO effects were present
in the western range of the fishery, the eastern range of the
fishery north of the Mississippi Delta, and the region between
Atchafalaya Bay and the Mississippi Delta. We present results
for each of these regions, beginning with the western region.
There were significant increases in all response variables as
DO concentration declined in the western range of the fishery
(Figure 5). In this region, the effects of DO on the probabil-
ity of fishing were greatest along the shore and extended from
the Texas–Louisiana border to the western edge of Atchafalaya
Bay, consistent with westward movement in the fishery as DO
concentration declined (Figure 5A). Probabilities of fishing in
this region were moderate (between 0.25 and 0.50 on the origi-
nal scale), so DO affected locations that generally were fished.
The effects of DO on catch (Figure 5B), effort (Figure 5C),
and CPUE (Figure 5D) were greatest on the boundaries of the
western region, near the Texas–Louisiana border, and offshore
of Atchafalaya Bay (Figure 5B–D). Although the spatial effects
of DO were greatest in these locations, these areas had small
predicted values for the response variables, indicating that DO
GULF MENHADEN FISHERY SPATIAL DYNAMICS 229
FIGURE 4. Partial effects (solid line) of depth and week on the response variables at the scale of the link function for each of four models: (A) effect of depth on
the probability of fishing in each grid × week combination (on a logit scale), (B) effect of depth on total Gulf Menhaden catch (units = 1,000 standard fish, on a
log scale), (C) effect of depth on total effort (number of sets, on a log scale), (D) effect of depth on log
e
(CPUE) within each grid × week combination, (E) effect
of week on the probability of fishing, (F) effect of week on total catch, (G) effect of week on total effort, and (H) effect of week on log(CPUE). The shaded areas
represent ± 2 SEs. Vertical lines along the x-axis represent the individual data values used in the model. A different data set was used for the probability model
(see Methods).
had an effect on locations where catch and effort were typi-
cally low. Overall, the distribution of catch shifted westward to
locations with lower levels of harvest when DO concentrations
declined.
Increases in the response variables as DO concentration de-
clined also occurred in the eastern range north of the Mississippi
Delta. Similar to the results for the western range, as DO con-
centrations declined the probability of fishing increased along
the shoreline, consistent with a nearshore shift in the fishery
(Figure 5A). Predicted probabilities of fishing at particular loca-
tions in the eastern range were slightly higher than probabilities
in the western range; therefore, declines in DO concentration
also affected locations that experienced moderate to high har-
vest. In contrast to effects on the probability of fishing, the catch
(Figure 5B), CPUE (Figure 5D), and (to a lesser extent) effort
(Figure 5C) increased offshore as DO concentration declined.
Therefore, despite an increased probability of fishing nearshore,
declines in DO did not result in a greater catch in nearshore areas.
For the most part, decreases in the response variables with
declines in DO concentration occurred only in the region be-
tween Atchafalaya Bay and the Mississippi Delta (Figure 5);
this area is subject to severe and frequent hypoxia. Moderate
declines in the probability of fishing extended across the entire
region (Figure 5A). Declines in catch mostly occurred just east
of Atchafalaya Bay (Figure 5B), whereas declines in effort—
although greatest just east of Atchafalaya Bay—also extended to
the Mississippi Delta (Figure 5C). Declines in CPUE were com-
pressed into a very small region just east of Atchafalaya Bay and
off Terrebonne Bay, whereas in the region closer to the Missis-
sippi Delta, CPUE increased with declining DO concentration
(Figure 5D). Values for all response variables off Terrebonne
Bay were low, as little fishing effort typically occurred there, so
declines in the response variables were relatively modest on an
absolute scale.
Within the region between Atchafalaya Bay and the Mis-
sissippi Delta, the Louisiana Bight was unique because there
was no common pattern among all four response variables. As
in other areas of the GOM, declines in DO concentration in
the Louisiana Bight resulted in increased fishing probabilities
at locations near shore (i.e., the western shore; Figure 5A). In
addition, both the probability of fishing and the fishing effort
(Figure 5C) declined offshore as DO concentration declined,
suggesting that vessels made fewer trips into the Louisiana Bight
as DO levels declined. The predicted probability of fishing and
the total effort were highest in the Louisiana Bight (Figure 5A,
C), so these spatial effects were relatively large on an absolute
scale in comparison with other regions. Similar to patterns in the
eastern range of the fishery, the CPUE increased throughout the
230 LANGSETH ET AL.
FIGURE 5. Spatially varying generalized additive model plots, showing the
predicted values of four response variables for the Gulf Menhaden fishery at
5- × 5-min spatial grid cells, as well as the effect of changes in dissolved
oxygen (DO) concentration on model predictions. Response variables include
(A) the probability of fishing in a grid cell (on a logit scale), (B) total catch in a
grid cell (units = 1,000 standard fish, on a log scale), (C) total effort in a grid cell
(number of sets, on a log scale), and (D) log
e
(CPUE). Lighter shading indicates
a higher predicted value of each response variable. Overlaid on the predictions
are white and gray bubbles, which indicate the change in the response variable
for a unit decrease in DO concentration for that grid (white bubbles = decreases
in the response variable; gray bubbles = increases in the response variable).
Circle size corresponds to the size of the DO effect on the response variable.
Only locations where effects were significantly different from zero (α = 0.05)
are shown.
Louisiana Bight, albeit slightly, as DO concentration declined
(Figure 5D). Predicted CPUE was already low in the Louisiana
Bight, so declines in DO concentration reduced the CPUE val-
ues even more. Overall, spatially varying DO effects at locations
within the Louisiana Bight supported the general results from
other regions: the fishery shifted toward shore and the CPUE
increased as the DO concentration declined. Contrary to results
for other regions, fishing effort in the Louisiana Bight decreased
in response to declining DO concentrations.
DISCUSSION
Smith (2001) hypothesized a link between hypoxia and Gulf
Menhaden landings. Our study is the first to quantitatively test
this link with detailed spatial data and to provide evidence sup-
porting the hypothesis. We have demonstrated that declining
concentrations of bottom DO can influence the spatial distri-
bution of the catch, effort, CPUE, and probability of fishing
in the Gulf Menhaden fishery of the northern GOM. Spatial
patterns in the effects of DO on response variables were con-
sistent with a westward and nearshore shift in the fishery as
bottom DO concentration declined. A nearshore shift in the
fishery supported our hypothesis that Gulf Menhaden would
be found along the edges of hypoxic areas, which are offshore
and impinge along the shoreline during extreme years (Rabalais
et al. 2007). A westward, nearshore shift in the fishery sup-
ported Smith’s (2001) hypothesis that a near-continuous band
of hypoxia along the coast would aggregate Gulf Menhaden
into normoxic regions along western Louisiana. Additionally,
we found evidence that CPUE increased as DO concentration
declined in the Louisiana Bight, a region that typically experi-
ences chronic, severe hypoxia. Such behavior could be explained
by enhanced aggregation of Gulf Menhaden vertically above the
low-DO bottom layer. Vertical aggregation in response to de-
clines in DO concentration has been found for both pelagic and
demersal species in the GOM (Hazen et al. 2009; Zhang et al.
2009) and other ecosystems (Stramma et al. 2012), although
evidence against strong DO effects for the entire water column
also exist (Zhang et al. 2014).
Patterns in the partial effects of depth and week in our analy-
sis supported what is generally known about the Gulf Menhaden
fishery. The partial effect of depth indicated a declining trend
for all response variables except CPUE. Gulf Menhaden are
common in nearshore, shallow waters during the fishing sea-
son (Ahrenholz 1991). The majority of landings occur within
16.09 km (10 mi) of shore (Smith et al. 2002), a region that is
characterized by shallow (<20 m) and gradually changing iso-
baths except in the proximity of the Mississippi Delta. There-
fore, catch, effort, and the probability of fishing were likely
greatest in shallow waters as a consequence of greater Gulf
Menhaden abundance and the reduced operating costs of fish-
ing at short distances from home ports. Bimodality in the effect
of depth on the probability of fishing at 5 and 30 m could re-
sult if Gulf Menhaden aggregate both inshore and offshore of
the hypoxic zone, as has been shown for other species (Craig
2012; Craig and Bosman 2013). The depths of the two modes
corresponded to the approximate inshore and offshore edges of
the hypoxic zone (Rabalais and Turner 2001), suggesting some
preference for fishing near the hypoxic zone; however, similar
patterns were not observed for the effects of depth on catch,
effort, or CPUE. Similarities in the effect of depth on CPUE
across all depths could result if spatial patterns in fishing effort
mirrored those in the spatial distribution of Gulf Menhaden,
which is plausible given that the fishery employs spotter pilots
to help direct boats on where to set.
The partial effect of week showed a similar trend among
all response variables. The response variables increased during
the beginning of the fishing season (April–May), plateaued or
peaked during the middle of the season (June–August), and then
declined towards the end of the season (September–November).
Catch per unit effort exhibited the highest peak among all re-
sponse variables during the summer (June–August), when hy-
poxia is typically most severe. A peak in CPUE during the
GULF MENHADEN FISHERY SPATIAL DYNAMICS 231
summer is consistent with enhanced susceptibility of Gulf Men-
haden to the fishery, possibly due to hypoxia-induced shifts in
spatial distributions; however, these effects were not particularly
large, and other explanations are possible. Even so, high values
for all response variables during the mid-summer hypoxia pe-
riod suggest that the observed spatial patterns in DO effects
were driven mostly by the time frame during which hypoxia
was typically most severe within the fishing season.
Local effects of declines in DO concentration on response
variables for the Gulf Menhaden fishery supported findings
from previous studies about the effects of hypoxia on catches
of pelagic and demersal species in the GOM. Craig (2012) re-
ported that northern brown shrimp Farfantepenaeus aztecus and
demersal finfishes aggregated within 1–3 km of the nearshore
and offshore edges of the hypoxic zone and that spatial overlap
among the species was strongest during years when hypoxia
was most severe. Zhang et al. (2009) found similar patterns
of horizontal aggregation along the offshore edge of the hy-
poxic zone for pelagic biomass in sub-pycnocline waters. The
nearshore shifts in the probability of fishing with declining DO
concentrations suggest that the Gulf Menhaden fishery responds
to hypoxia-induced shifts in the horizontal distribution of their
target species; however, fishery-independent information on the
spatial distribution of Gulf Menhaden would be necessary to
test this hypothesis. Zhang et al. (2009) also found that pelagic
species moved vertically in the water column to avoid hypoxic
conditions, which could explain the increased CPUE as DO
concentrations declined in the Louisiana Bight. It was a bit
surprising, however, that similar increases in CPUE did not oc-
cur elsewhere. However, hypoxia persistently develops in the
Louisiana Bight (Rabalais et al. 2002), and when coupled with
the strong environmental and depth gradients in the Louisiana
Bight, this may enhance spatial aggregation more so than in
other GOM regions where spatial gradients and hypoxic condi-
tions are typically weaker.
Given the persistence of hypoxia in the Louisiana Bight, we
were also surprised that localized effects of declines in DO were
not stronger than effects in other locations. The size of the spa-
tial grid used in our analysis may have influenced the ability of
our model to capture DO effects in the Louisiana Bight. Depth
contours are close together in the Louisiana Bight, so covari-
ates are averaged over more dynamic conditions than in other
areas of the GOM. In contrast, the western and eastern ranges of
the fishery have very shallow bathymetry, and the fishery oper-
ates on a broader spatial scale. Consequently, differences in the
variability of physical processes between the Louisiana Bight
and other regions of the GOM may explain why the effects of
changes in DO concentration were relatively large and similar
across response variables in the western and eastern ranges but
not in the Louisiana Bight.
The limitations of our study should be considered when inter-
preting the results. One primary limitation of our study was that
we used predictive model output of bottom DO concentrations
from a physical–biogeochemical model as input into our anal-
ysis (Fennel et al. 2013). Predictive physical–biogeochemical
models are complex and explicitly account for many processes
that influence hypoxia formation. Such processes are themselves
uncertain, potentially compounding error in the final model out-
put. Fennel et al. (2013) reduced the potential for error by vali-
dating model predictions of the area of hypoxia in July against
yearly estimates of the total area of hypoxia in the northern GOM
for 2004–2007 from annual shelfwide surveys (Rabalais et al.
2002). Comparison to the total area of hypoxic bottom water
based on shelfwide surveys in late July provided a validation of
the model, but the extent to which the model captured the exact
locations of hypoxic bottom water and how the area of hypoxia
in July compares with hypoxic areas present during other time
periods remain unknown. Fennel et al. (2013) also warned about
the sensitivity of their model predictions to assumptions about
sediment oxygen consumption and the choice of physical hor-
izontal boundaries. Uncertainties in the model used by Fennel
et al. (2013) were assessed by Mattern et al. (2013), who found
that 20% variation in initial physical parameters (e.g., wind and
river inflow) could affect predictions of the total area of hypoxia
by up to 40%.
We used fine-scale estimates of bottom DO concentration be-
cause part of the difficulty in determining the effects of hypoxia
on fisheries is that DO dynamics operate on spatial and temporal
scales that are much finer than the typical fishery range and sea-
son. It is unlikely that simple correlative analyses at aggregate
spatial (e.g., entire fishing grounds) and temporal (e.g., annual)
scales have sufficient statistical power to detect and isolate hy-
poxic (or other environmental) effects on aggregate fishery land-
ings. The power of our approach was the ability to quantify the
effects of low bottom DO on aspects of the Gulf Menhaden
fishery at the localized scales at which these effects were most
likely to occur. The immediate challenges for future work are to
further confirm the fine-scale spatial and temporal variation in
DO predicted by the physical–biogeochemical modeling and to
determine whether and how localized DO effects on the fishery
translate to larger scales. The most recent stock assessment of
Gulf Menhaden showed declines in landings and in fishing ef-
fort since the mid-1980s, although total biomass and indices of
abundance were relatively stable or slightly increasing in recent
years (SEDAR 2013). Hence, despite the Gulf Menhaden fish-
ery’s inshore and westward shifts associated with low bottom
DO concentrations, there is no evidence to date of large-scale
effects on the Gulf Menhaden population or the fishery.
Another limitation of our study was that we only considered
effects on fishery response variables due to changes in a few
environmental covariates (i.e., DO, depth, and spatial location).
Spatial distributions of Atlantic Menhaden B. tyrannus in estu-
aries are related to spatial gradients in phytoplankton biomass
and possibly salinity and other environmental factors (Fried-
land et al. 1996), which may be correlated with bottom DO
at particular spatial and temporal scales. Zhang et al. (2014)
found that temperature and prey availability explained more
variation in growth potential for Gulf Menhaden in the GOM
232 LANGSETH ET AL.
than did DO given that the extent of hypoxic conditions into
the water column was relatively limited. Consequently, greater
information on the vertical extent of DO would also improve
our analysis. Inclusion of depth and spatial location as predic-
tor variables accounts for some of the variation associated with
potentially important environmental predictors (e.g., turbidity,
salinity, and temperature) without the introduction of additional
uncertainty associated with deriving these predictors from other
data sources. Generating such environmental data on the scales
of our analysis provides further challenges. In addition to factors
that could affect Gulf Menhaden distribution, we also did not
include factors that could potentially influence the distribution
of the fishery. There is a growing body of literature showing the
effect of fisher behavior on fleet dynamics; market prices, oper-
ation costs, recent catches, and historical fishing patterns have
all been shown to affect the choice of fishing locations (van
Putten et al. 2012). We investigated the distance to the home
port in preliminary analyses, but our results were similar to the
simpler approach presented herein, so we ultimately excluded
that variable from our final analysis.
Our models captured a relatively small amount of the overall
variability in the data, which may also be perceived as a limi-
tation. Deviance explained by our models ranged from 10.0%
to 22.4% depending on the response variable. Spatially varying
GAMs used for studies in the Gulf of Alaska and eastern Bering
Sea explained 47–83% of the deviance using only environ-
mental variables, but these were based on fishery-independent
surveys (Bacheler et al. 2009, 2010; Bartolino et al. 2011).
Fishery-independent surveys smooth over temporal and spa-
tial variability by standardizing the fishing process at speci-
fied dates and random locations. The amount of variability ex-
plained by our models was more comparable to the variability
explained by models of fishery-dependent data in the eastern
Bering Sea (Bacheler et al. 2012). For studies in the GOM,
Craig and Crowder (2005) explained 20–35% of the deviance of
presence/absence data in fishery-independent surveys for a dem-
ersal fish species. The ability of our models to explain variability
in the data should also be considered in relation to the complex-
ity of the process being modeled. Hypoxia in the GOM has been
extensively studied and is affected by many interrelated factors
(Bianchi et al. 2010). The fishing process is also highly com-
plex and driven by numerous factors (van Putten et al. 2012).
Consequently, although additional covariates related to the spa-
tial distribution of fish and the location choices of fishers might
have increased the amount of deviation explained by our model,
the percent deviance explained could still remain low due to
variability in fishery data and in the processes affecting DO
concentration within the GOM.
Management Implications
We have demonstrated nearshore and westward movements
in the distribution of the Gulf Menhaden fishery as bottom DO
concentrations declined. One potential consequence of the fish-
ery’s shift in distribution would be a change in the effectiveness
of fishing effort on harvesting fish—in other words, a change
in Gulf Menhaden catchability to the fishery. Changes in a re-
source’s catchability to its fishery have been investigated in
relation to many factors, including technological changes in
the fishery over time and distributional changes in the resource
over time and space (Wilberg et al. 2010). Time-varying and
spatially varying catchability has important management impli-
cations because most stock assessment models, including those
used to support the management of Gulf Menhaden, assume
constant catchability (Wilberg et al. 2010). If catchability is un-
derestimated in these models, then biomass estimates are biased
high and fishing mortality estimates are biased low, potentially
leading to less-conservative management advice than intended
(Wilberg et al. 2010). The movement of Gulf Menhaden into
locations nearer to shore and to the western part of the fish-
ery and the higher catch rates in the Louisiana Bight as DO
concentrations decline could potentially affect catchability and
could have consequences for the stock-wide assessment of Gulf
Menhaden, but we do not know the magnitude of such effects.
The consequences could be small given that (1) the current as-
sessment of Gulf Menhaden is performed on an annual time
step and over the entire range of the fishery and (2) the effects
observed in our research were often in locations where moder-
ate catch and effort occurred. More direct analysis of key stock
assessment assumptions—particularly the assumption of con-
stant catchability over time and space—is needed to determine
the consequences for management and is the subject of ongoing
investigation.
ACKNOWLEDGMENTS
We thank N. Bacheler, R. Leaf, and two anonymous review-
ers for contributions to previous drafts of the manuscript. This
work was supported by a grant from the Fisheries and the En-
vironment Program of the National Oceanic and Atmospheric
Administration (NOAA). K.M.P. was supported by a grant from
the NOAA Center for Sponsored Coastal Ocean Research to
J.K.C. The views expressed herein are those of the authors and
do not necessarily reflect the view of NOAA or any of its sub-
agencies. B.J.L. designed and performed the analysis with sup-
port from K.M.P., J.K.C., A.M.S., J.W.S., and K.W.S.; A.M.S.,
J.K.C., K.W.S., and J.W.S. obtained funding for the research;
S.C., K.A.R., and K.F. designed the physical–biogeochemical
model simulations and generated and processed the DO val-
ues; and all co-authors contributed to the final version of the
manuscript.
REFERENCES
Ahrenholz, D. W. 1991. Population biology and life history of the North Amer-
ican menhadens, Brevoortia spp. Marine Fisheries Review 53:3–19.
Bacheler, N. M., K. M. Bailey, L. Ciannelli, V. Bartolino, and K. Chan. 2009.
Density-dependent, landscape, and climate effects on spawning distribution
of Walleye Pollock Theragra chalcogramma. Marine Ecology Progress Series
391:1–12.
GULF MENHADEN FISHERY SPATIAL DYNAMICS 233
Bacheler, N. M., L. Ciannelli, K. M. Bailey, and V. Bartolino. 2012. Do Walleye
Pollock exhibit flexibility in where or when they spawn based on variability
in water temperature? Deep-Sea Research Part II Topical Studies in Oceanog-
raphy 65–70:208–216.
Bacheler, N. M., L. Ciannelli, K. M. Bailey, and J. T. Duffy-Anderson. 2010.
Spatial and temporal patterns of Walleye Pollock (Theragra chalcogramma)
spawning in the eastern Bering Sea inferred from egg and larval distributions.
Fisheries Oceanography 19:107–120.
Bartolino, V., L. Ciannelli, N. M. Bacheler, and K. Chan. 2011. Ontogenetic
and sex-specific differences in density-dependent habitat selection of a marine
fish population. Ecology 92:189–200.
Bartolino, V., L. C iannelli, P. Spencer, T. K. Wilderbuer, and K. Chan. 2012.
Scale-dependent detection of the effects of harvesting a marine fish popula-
tion. Marine Ecology Progress Series 444:251–261.
Bianchi, T. S., S. F. DiMarco, J. H. Cowan, R. D. Hetland, P. Chapman, J. W.
Day, and M. A. Allison. 2010. The science of hypoxia in the northern Gulf
of Mexico: a review. Science of the Total Environment 408:1471–1484.
Breitburg, D. L., J. K. Craig, R. S. Fulford, K. A. Rose, W. R. Boynton, D. C.
Brady, B. J. Ciotti, R. J. Diaz, K. D. Friedland, J. D. Hagy III, D. R. Hart, A. H.
Hines, E. D. Houde, S. E. Kolesar, S. W. Nixon, J. A. Rice, D. H. Secor, and
T. E. Targett. 2009. Nutrient enrichment and fisheries exploitation: interactive
effects on estuarine living resources and their management. Hydrobiologia
629:31–47.
Burnham, K. P., and D. R. Anderson. 2002. Model selection and multimodel
inference. Springer-Verlag, New York.
Ciannelli, L., V. Bartolino, and K. Chan. 2012. Non-additive and non-stationary
properties in the spatial distribution of a large marine fish population. Pro-
ceedings of the Royal Society B 279:3635–3642.
Craig, J. K. 2012. Aggregation on the edge: effects of hypoxia avoidance on the
spatial distribution of brown shrimp and demersal fishes in the northern Gulf
of Mexico. Marine Ecology Progress Series 445:75–95.
Craig, J. K., and S. Bosman. 2013. Small spatial scale variation in fish assem-
blage structure in the vicinity of the northwestern Gulf of Mexico. Estuaries
and Coasts 36:268–285.
Craig, J. K., and L. B. Crowder. 2005. Hypoxia-induced habitat shifts and
energetic consequences in Atlantic Croaker and brown shrimp on the Gulf of
Mexico shelf. Marine Ecology Progress Series 294:79–94.
Craig, J. K., L. B. Crowder, C. D. Gray, C. J. McDaniel, T. A. Henwood, and
J. G. Hanifen 2001. Ecological effects of hypoxia on fish, sea turtles, and
marine mammals in the northwestern Gulf of Mexico. Pages 269–291 in N.
N. Rabalais and R. E. Turner, editors. Coastal hypoxia: consequences for
living resources and ecosystems. American Geophysical Union, Washington,
D.C.
Craig, J. K., L. B. Crowder, and T. A. Henwood. 2005. Spatial distribution of
brown shrimp (Farfantepenaeus aztecus) on the northwestern Gulf of Mexico
shelf: effect of abundance and hypoxia. Canadian Journal of Fisheries and
Aquatic Sciences 62:1295–1308.
Eldridge, P. M., and J. W. Morse. 2008. Origins and temporal scales of hy-
poxia on the Louisiana shelf: importance of benthic and sub-pycnocline water
metabolism. Marine Chemistry 108:159–171.
Fennel, K., J. Hu, A. Laurent, M. Marta-Almeida, and R. Hetland. 2013. Sen-
sitivity of hypoxia predictions for the northern Gulf of Mexico to sediment
oxygen consumption and model nesting. Journal of Geophysical Research
118:990–1002.
Friedland, K. D., D. W. Ahrenholz, and J. F. Guthrie. 1996. Formation and sea-
sonal evolution of Atlantic Menhaden juvenile nurseries in coastal estuaries.
Estuaries 19:105–114.
Hastie, T., and R. Tibshirani. 1986. Generalized additive models. Statistical
Science 1:297–318.
Hazen, E. L., J. K. Craig, C. P. Good, and L. B. Crowder. 2009. Vertical
distribution of fish biomass in hypoxic waters on the Gulf of Mexico shelf.
Marine Ecology Progress Series 375:195–207.
Hetland, R. D., and S. F. DiMarco. 2008. How does the character of oxygen
demand control the structure of hypoxia on the Texas–Louisiana continental
shelf? Journal of Marine Systems 70:49–62.
Justi
´
c, D., and L. Wang. 2014. Assessing temporal and spatial variability
of hypoxia over the inner Louisiana–upper Texas shelf: application of an
unstructured-grid three-dimensional coupled hydrodynamic–water quality
model. Continental Shelf Research 72:163–179.
Ludsin, S. A., X. Zhang, S. B. Brandt, M. R. Roman, W. C. Boicourt, D. M.
Mason, and M. Costantini. 2009. Hypoxia avoidance by planktivorous fish in
Chesapeake Bay: implications for food web interactions and fish recruitment.
Journal of Experimental Marine Biology and Ecology 381:S121–S131.
Mattern, J. P., K. Fennel, and M. Dowd. 2013. Sensitivity and uncertainty
analysis of model hypoxia estimates for the Texas–Louisiana shelf. Journal
of Geophysical Research 118:1316–1332.
McNatt, R. A., and J. A. Rice. 2004. Hypoxia-induced growth rate reduction
in two juvenile estuary-dependent fishes. Journal of Experimental Marine
Biology and Ecology 311:147–156.
NMFS (National Marine Fisheries Service). 2012. Fisheries of the United
States, 2011. NMFS, Current Fishery Statistics 2011, Silver Spring,
Maryland.
Obenour, D. R., D. Scavia, N. N. Rabalais, R. E. Turner, and A. M. Michalak.
2013. Retrospective analysis of midsummer hypoxic area and volume in the
northern Gulf of Mexico, 1985–2011. Environmental Science and Technology
47:9808–9815.
O’Connor, T., and D. Whitall. 2007. Linking hypoxia to shrimp catch in the
northern Gulf of Mexico. Marine Pollution Bulletin 54:460–463.
Pollock, M. S., L. M. J. Clarke, and M. G. Dub
´
e. 2007. The effects of hypoxia
on fishes: from ecological relevance to physiological effects. Environmental
Reviews 15:1–14.
R Core Development Team. 2012. R: A language and environment for statisti-
cal computing. R Foundation for Statistical Computing, Vienna. Available:
./ (September 2014).
Rabalais, N. N., and R. E. Turner. 2001. Hypoxia in the northern Gulf of
Mexico: description, causes and change. Pages 1–36 in N. N. Rabalais and
R. E. Turner, editors. Coastal hypoxia: consequences for living resources and
ecosystems. American Geophysical Union, Washington, D.C.
Rabalais, N. N., R. E. Turner, B. K. Sen Gupta, D. F. Boesch, P. Chapman,
and M. C. Murrell. 2007. Hypoxia in the northern Gulf of Mexico: does the
science support the plan to reduce, mitigate, and control hypoxia? Estuaries
and Coasts 30:753–772.
Rabalais, N. N., R. E. Turner, and W. J. Wiseman. 2002. Gulf of Mexico
hypoxia, a.k.a. “the dead zone.” Annual Review of Ecology and Systematics
33:235–263.
Rose, K. A., A. T. Adamack, C. A. Murphy, S. E. Sable, S. E. Kolesar, J.
K. Craig, D. L. Breitburg, P. Thomas, M. G. Brouwer, C. F. Cerco, and S.
Diamond. 2009. Does hypoxia have population-level effects on coastal fish?
Musings from the virtual world. Journal of Experimental Marine Biology and
Ecology 381:S188–S203.
SEDAR (Southeast Data, Assessment, and Review). 2013. SEDAR
32A Gulf of Mexico menhaden stock assessment report. SEDAR,
North Charleston, South Carolina. Available: www.sefsc.noaa.gov/sedar/
Sedar
Workshops.jsp?WorkshopNum=32A. (September 2013).
Shimps, E. L., J. A. Rice, and J. A. Osborne. 2005. Hypoxia tolerance in two
juvenile estuary-dependent fishes. Journal of Experimental Marine Biology
and Ecology 325:146–162.
Smith, J. W. 1991. The Atlantic and Gulf menhaden purse seine fish-
eries: origins, harvesting technologies, biostatistical monitoring, recent
trends in fisheries statistics, and forecasting. Marine Fisheries Review 53:
28–41.
Smith, J. W. 2001. Distribution of catch in the Gulf Menhaden Brevoortia
patronus, purse seine fishery in the northern Gulf of Mexico from logbook
information: are there relationships to the hypoxic zone? Pages 311–320 in
N. N. Rabalais and R. E. Turner, editors. Coastal hypoxia: consequences for
living resources and ecosystems. American Geophysical Union, Washington,
D.C.
Smith, J. W., E. A. Hall, N. A. McNeill, and W. B. O’Bier. 2002. The distribution
of purse-seine sets and catches in the Gulf Menhaden fishery in the northern
Gulf of Mexico, 1994–98. Gulf of Mexico Science 2002:12–24.
234 LANGSETH ET AL.
Stierhoff, K. L., T. E. Targett, and J. H. Power. 2009. Hypoxia-induced growth
limitation of juvenile fishes in an estuarine nursery: assessment of small-
scale temporal dynamics using RNA:DNA. Canadian Journal of Fisheries
and Aquatic Sciences 66:1033–1047.
Stramma, L., E. D. Prince, S. Schmidtko, J. Luo, J. P. Hoolihan, M. Visbeck,
D. W. R. Wallace, P. Brandt, and A. Kortzinger. 2012. Expansion of oxygen
minimum zones may reduce available habitat for tropical pelagic fishes.
Nature Climate Change 2:33–37.
Thomas, P., and M. S. Rahman. 2012. Extensive reproductive disruption, ovar-
ian masculinization and aromatase suppression in Atlantic Croaker in the
northern Gulf of Mexico hypoxic zone. Proceedings of the Royal Society B
279:28–38.
van Putten, I. E., S. Kulmala, O. Th
´
ebaud, N. Dowling, K. G. Hamon, T.
Hutton, and S. Pascoe. 2012. Theories and behavioural drivers underlying
fleet dynamics. Fish and Fisheries 13:216–235.
Vanderploeg, H. A., S. A. Ludsin, S. A. Ruberg, T. O. H
¨
o
¨
ok, S. A. Pothoven,
S. B. Brandt, G. A. Lang, J. R. Liebig, and J. F. Cavaletto. 2009. Hypoxia
affects spatial distributions and overlap of pelagic fish, zooplankton, and
phytoplankton in Lake Erie. Journal of Experimental Marine Biology and
Ecology 381:S92–S107.
Wilberg, M. J., J. T. Thorson, B. C. Linton, and J. Berkson. 2010. Incorporating
time-varying catchability into population dynamic stock assessment models.
Reviews in Fisheries Science 18:7–24.
Wood, S. N. 2006. Generalized additive models: an introduction with R.
Chapman and Hall, Boca Raton, Florida.
Zhang, H., S. A. Ludsin, D. M. Mason, A. T. Adamack, S. B. Brandt, X.
Zhang, D. G. Kimmel, M. R. Roman, and W. C. Boicourt. 2009. Hypoxia-
driven changes in the behavior and spatial distribution of pelagic fish and
mesozooplankton in the northern Gulf of Mexico. Journal of Experimental
Marine Biology and Ecology 381:S80–S91.
Zhang, H., D. M. Mason, C. A. Stow, A. T. Adamack, S. B. Brandt, X.
Zhang, D. G. Kimmel, M. R. Roman, W. C. Boicourt, and S. A. Ludsin.
2014. Effects of hypoxia on habitat quality of pelagic planktivorous fishes
in the northern Gulf of Mexico. Marine Ecology Progress Series 505:
209–226.
Zimmerman, R. J., and J. M. Nance. 2001. Effects of hypoxia on the
shrimp fishery of Louisiana and Texas. Pages 293–310 in N. N. Ra-
balais and R. E. Turner, editors. Coastal hypoxia: consequences for liv-
ing resources and ecosystems. American Geophysical Union, Washington,
D.C.