Retention of coastal cod eggs in a fjord caused by interactions between egg buoyancy and circulation pattern
Bạn đang xem bản rút gọn của tài liệu. Xem và tải ngay bản đầy đủ của tài liệu tại đây (991.49 KB, 17 trang )
BioOne sees sustainable scholarly publishing as an inherently collaborative enterprise connecting authors, nonprofit publishers, academic institutions, research
libraries, and research funders in the common goal of maximizing access to critical research.
Retention of Coastal Cod Eggs in a Fjord Caused by Interactions between Egg
Buoyancy and Circulation Pattern
Author(s): Mari S. Myksvoll, Svein Sundby, Bjørn Ådlandsvik and Frode B. Vikebø
Source: Marine and Coastal Fisheries: Dynamics, Management, and Ecosystem Science, 3(1):279-294.
2011.
Published By: American Fisheries Society
URL: />BioOne (www.bioone.org) is a nonprofit, online aggregation of core research in the biological, ecological, and
environmental sciences. BioOne provides a sustainable online platform for over 170 journals and books published
by nonprofit societies, associations, museums, institutions, and presses.
Your use of this PDF, the BioOne Web site, and all posted and associated content indicates your acceptance of
BioOne’s Terms of Use, available at www.bioone.org/page/terms_of_use.
Usage of BioOne content is strictly limited to personal, educational, and non-commercial use. Commercial inquiries
or rights and permissions requests should be directed to the individual publisher as copyright holder.
Marine and Coastal Fisheries: Dynamics, Management, and Ecosystem Science 3:279–294, 2011
C
American Fisheries Society 2011
ISSN: 1942-5120 online
DOI: 10.1080/19425120.2011.595258
ARTICLE
Retention of Coastal Cod Eggs in a Fjord Caused by
Interactions between Egg Buoyancy and Circulation Pattern
Mari S. Myksvoll,* Svein Sundby, Bjørn Ådlandsvik, and Frode B. Vikebø
Institute of Marine Research, Post Office Box 1870 Nordnes, N-5817 Bergen, Norway;
and Bjerknes Centre for Climate Research, Post Office Box 7810, N-5020 Bergen, Norway
Abstract
Norwegian coastal cod form a stationary population of Atlantic cod Gadus morhua consisting of several genetically
separated subpopulations. A small-scale differentiation in marine populations with pelagic eggs and larvae is made
possible by local retention of early life stages in coastal environments. A numerical model was used to simulate the
circulation in a fjord system in northern Norway over 2 years with different river runoff patterns. The dispersal of
cod eggs was calculated with a particle-tracking model that used three-dimensional currents. The observed thickness
of the low-salinity surface layer was well reproduced by the model, but the surface salinity was generally lower in
the model than in the observations. The cod eggs attained a subsurface vertical distribution, avoiding the surface and
causing retention. Interannual variations in river runoff can cause small changes in the vertical distribution of cod
eggs and larger changes in the vertical current structure. Retention in the fjord system was strong in both years, but
some eggs were subjected to offshore transport over a limited time period. The timing of offshore transport depended
on the precipitation and temperatures in adjacent drainage areas. A possible match between maximized spawning
and offshore transport may have a negative effect on local recruitment.
Norwegian coastal cod consist of stationary populations
of Atlantic cod Gadus morhua that spawn at several locations
along the Norwegian coast, particularly in the fjords (Jakobsen
1987). The coastal cod offspring grow up close to their spawn-
ing site, in large contrast to the Arcto-Norwegian Atlantic cod
stock, whose pelagic offspring are transported from their coastal
spawning site in Vestfjorden (Figure 1) up to 1500 km into the
Barents Sea (Bergstad et al. 1987). The Arcto-Norwegian cod
and the Norwegian coastal cod are considered separate popula-
tions with respect to management and quotas, and the distinc-
tion between the two is supported by a genetic differentiation
(Pogson and Fevolden 2003). Since the mid-1990s the Nor-
wegian coastal cod north of 62
◦
N have been declining (ICES
2009) from a large biomass in 1994 (300,000 tons) to a mini-
mum in 2008 (90,000 metric tons), and in many local regions the
coastal cod population is critically low. The neighboring Arcto-
Norwegian cod stocks have remained in good condition during
Subject editor: Suam Kim, Pukyong National University, Busan, South Korea
*Corresponding author:
Received April 20, 2010; accepted January 3, 2011
the past two decades. The coastal cod have been managed as one
stock unit, but recent studies have revealed a genetic structure
between coastal broodstocks on small spatial scales (Knutsen
et al. 2003; Salvanes et al. 2004; Dahle et al. 2006; Espeland
et al. 2007). Jorde et al. (2007) found a population structure
with a geographical range of 30 km, which suggested signifi-
cant genetic differences between neighboring fjords. A small-
scale genetic differentiation in marine populations with pelagic
eggs and larvae is made possible by local retention of early
life stages (Cowen et al. 2000). Knutsen et al. (2007) showed
that retention of cod eggs is evident in a number of Norwegian
fjords. Asplin et al. (1999) argued that species have adapted
their spawning depth and the buoyancy of eggs to reduce the
dispersal of young stages. To maintain the coastal cod offspring
close to the spawning site, retention mechanisms of the plank-
tonic stages and active return migration of the juveniles must
occur.
279
280 MYKSVOLL ET AL.
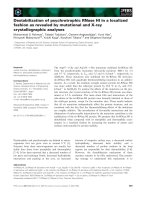
FIGURE 1. The fjord system of Nordfolda and Sørfolda located in the northern part of Norway, including the fjord branches of Vinkfjord and Leirfjorden and
known spawning areas (upper right panel) and nursery areas (lower right panel) of Norwegian coastal cod; the data were provided by Gyda Lor
˚
as at the Norwegian
Directorate of Fisheries.
An estuaryis asemi-enclosed bodyof water wherefreshwater
from river runoff meets saline water from the ocean. The physi-
cal environment in an estuary is highly dependent on thebalance
between these two water masses. When river runoff dominates
over tidal input, estuarine circulation develops, which is charac-
terized by a strong stratification (Dyer 1997). A fjord is a special
type of estuary that is carved out by a glacier. Many Norwegian
fjords have a deep basin (up to 1,300 m) and a shallow sill
near the mouth (10–200 m) (Svendsen 1995). Fjords are also
characterized by a small width-to-depth ratio and can reach a
length of 200 km (Dyer 1997). Estuarine circulation is a general
feature observed in many fjords where the river runoff is large
compared with the surface area of the fjord (Svendsen 1995).
This circulation is characterized by strong outflowing currents
at the surface and weak inflow in the lower layers. The surface
outflowing layer is thin (<5 m) with low salinity. The deep wa-
ter below the sill level is affected by another circulation system.
This water mass can remain stagnant for longer periods and
can only leave the fjord when lifted above the sill level. Vertical
mixing and diffusion are important to control the deep-water cir-
culation. The connection between the estuarine circulation and
the deep-water circulation is weak in fjords with deep sills, and
they are separated by an intermediate layer (Stigebrandt 1981).
While the spawning period of Arcto-Norwegian cod in
Vestfjorden is well known (Pedersen 1984; Ellertsen et al. 1989),
the exact time of spawning for coastal cod has been less in-
vestigated. Results by Kjesbu (1988) suggest that the spawning
continues for several months during the spring, with a peak con-
centration toward the end of April. When the coastal cod spawn
in the fjord environment, the horizontal transport of eggs and lar-
vae is highly dependent on their vertical position. If the eggs are
lighter than the surface layer, they will attain a pelagic distribu-
tion with the concentration occurring at the surface and then ex-
ponentially decreasing downward (Sundby 1983). Eggs that are
heavier than the surface layer but lighter than the deeper layers
will have a subsurface distribution with maximum concentration
occurring at the pycnocline (Sundby 1991). Measurements from
Tysfjord show that the neutral buoyancy of coastal cod eggs in
terms of salinity varies between 30.6 and 34.1 (practical salinity
scale; Stenevik et al. 2008). In a fjord with sufficient freshwater
discharge, the surface salinity is low enough for the cod eggs
to be submerged below the surface layer. The cod eggs will
then not be affected by the strong currents at the surface, thus
increasing their chances to be retained locally. Stenevik et al.
(2008) showed that the specific gravity of coastal cod eggs did
not vary much among different locations along the Norwegian
RETENTION OF COASTAL COD EGGS 281
coast but concluded that the local salinity structure determined
whether the eggs attained a pelagic or subsurface distribution.
The objective of this study was to quantify the importance of
the vertical distribution of cod eggs for horizontal transport and
retention within a fjord system and to evaluate how interannual
variations in river runoff change the local retention. A regional
ocean model was used to simulate the circulation in a fjord
system during two different years, 1960 and 1989. The first
year represented a cold, dry year with low river runoff, while
the second year represented a warm, wet year with high river
runoff. By studying two years having extreme conditions, the
magnitude of interannual differences in dispersal of eggs could
be quantified. Drift patterns of eggs were calculated with a
particle-tracking model that used the modeled velocity fields.
The particle-tracking model included a component that resolved
the dynamical vertical distribution.
STUDY AREA
The fjord system of Sørfolda and Nordfolda (Figure 1) was
selected to study the physical mechanisms causing local reten-
tion of cod eggs. These are two separate fjords with a joint open-
ing toward Vestfjorden, located in the northern part of Norway
at 67.5
◦
N (Figure 1). The spawning and nursery areas inside the
fjord system have been mapped by the Norwegian Directorate
of Fisheries, as seen in Figure 1 (Gyda Lor
˚
as, personal commu-
nication). The spawning areas have been localized in the inner
most ends of the branches in the fjord system, while the nursery
areas are limited to the branches of Sørfolda, except for the head
of Nordfolda. Sørfolda has a sill depth of 265 m, and the deepest
part of the fjord is 574 m. The main part of the fjord is 3.5 km
wide, narrowing to 1.6 km toward the head. The inner end of
Sørfolda is divided into two main branches; the northern part is
called Leirfjorden. The sill depth in Nordfolda is 225 m, and the
deepest part of the fjord reaches 527 m. The fjord width ranges
from 5.5 km in the central part to 2.4 km in the innermost part.
Nordfolda is divided into several smaller branches, including
Vinkfjord to the south. The whole fjord system is surrounded
by steep mountains. Because both fjords have a large sill depth,
there is no topographical feature limiting the water exchange
with the continental shelf.
The Institute of Marine Research in Bergen has been mon-
itoring the hydrography in Sørfolda and Nordfolda every year
since 1975 (Aure and Pettersen 2004) but has only collected
data during late fall (November–December) when the river
runoff is low. These observations show a low-salinity surface
layer with large interannual variability. Sørfolda has, in general,
a fresher surface layer than Nordfolda, and both have the lowest
salinity at the heads. In 2007, several salinity and temperature
profiles were measured in Sørfolda, and these results formed
a good basis for the validation of the ocean model. The main
feature observed was a shallow surface layer less than 5 m deep
with salinities as low as 25. This is characteristic for a fjord
system with considerable river runoff compared with the surface
area of the fjord (Svendsen 1995). The circulation patterns in
Sørfolda and Nordfolda have not been described in detail in
earlier work, but knowledge from similar systems indicates
that the estuarine circulation develops when the river runoff is
high during the season of ice melt (Farmer and Freeland 1983).
Mohus and Haakstad (1984) measured currents close to the head
of Sørfolda in November 1978. The circulation pattern was com-
plicated but was characterized by the estuarine circulation, with
outflow in the upper layer and compensating inflow below. The
surface current was also found to vary strongly with the local
winds, having the potential to spin up the estuarine circulation or
reverse the whole system. Under normal conditions in Sørfolda
the surface current was observed to be 5% of the wind speed.
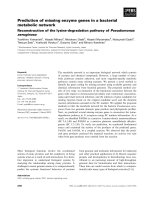
A cod egg survey was performed in Sørfolda and Nordfolda
on April 4–5, 2007 (Magnus Johannessen, Institute of Marine
Research, personalcommunication) bymeans of Juday nets with
an 80-cm mouth diameter and a mesh size of 375 μm. Coastal
cod eggs where collected at 10 stations with four vertical hauls at
each station: 60–45 m, 45–30 m, 30–15 m, and 15–0 m. The eggs
were divided into six different development stages as described
by Fridgeirsson (1978). In total, 226 eggs were sampled, and
the horizontal distribution is shown in Figure 2. For plotting
purposes the eggs were divided into three groups according to
their egg stage; the blue columns include egg stages 1 and 2
(0–5 d old), green columns egg include stages 3 and 4 (6–14 d
old), and red columns include egg stages 5 and 6 (15–21 d old).
The largest number of eggs were collected at the southernmost
station in Sørfolda, with 67 cod eggs encompassing all stages.
The red column at this station corresponds to 29 eggs; the other
columns are scaled accordingly. The majority of eggs sampled,
especially the oldest ones, were located in the inner part of the
fjord system at the beginning of the spawning season (Figure 2).
The survey was performed early in the spawning season, and at
every station except one near the mouth of Sørfolda, the number
of old eggs (6–21 d old) exceeded the number of young eggs
(0–5 d), indicating eggs were retained rather than dispersed.
METHODS
Freshwater discharge.—In fjords with high river runoff com-
pared with their surface area, the runoff is a major driving
mechanism controlling both the circulation and the hydrography
(Sælen 1967). The seasonal cycle of the river discharge depends
on the drainage area. To calculate the annual mean discharge, the
area was divided into 17 drainage areas. A planimeter was used
on an isohydate map from The Norwegian Water Resources and
Energy Directorate (NVE), as described by Sundby (1982). The
drainage areas were classified into different regimes depend-
ing on elevation above sea level and distance from the coast.
A coastal regime dominates near the mouth of the fjord system
where the highest runoff occurs during autumn and winter and
lowest during summer, which is directly correlated with the lo-
cal precipitation. A mountain–glacier regime is located close to
the head of the fjord, with high flows in summer and low flows
in winter owing to precipitation accumulating as snow. Between
these two is the inland–transition regime with high runoff during
282 MYKSVOLL ET AL.
FIGURE 2. Sampled cod eggs at 10 stations in the study area during a survey on April 4–5, 2007, by egg stage.
spring andautumn and low flowduring summerand winter. Most
of the land surrounding Nordfolda is at intermediate altitude
(100–600 m) and is considered a transition regime. The inner
part of Sørfolda and Leirfjorden is surrounded by mountains and
glaciers, dominated by high summer flows. The freshwater input
into Nordfolda is much less than into Sørfolda, and has a differ-
ent seasonal cycle. To include information about annual mean
discharge and seasonal variations, a representative watermark
had to be determined for every drainage area. The NVE (In-
geborg Kleivane, personal communication) provided data from
four rivers in the area that were suitable to use as watermarks
and represented each regime. The data were averaged over 5 d
and released into the model domain as a freshwater source in the
upper 10 sigma layers, linearly increasing toward the surface.
The interannual variability of the four chosen rivers discharg-
ing into the fjord system is shown in Figure 3. The annual mean
discharge is standardized for comparison. The rivers showed
similar interannual variability, except after 1999 when one river
was regulated and water was guided away from the river. From
these data 2 years, 1960 and 1989, were chosen. Both years
are more than two standard deviations away from the mean, in
opposite directions.
The seasonal cycle of freshwater discharge for the four rivers
used in the simulation is shown in Figure 4. The upper panel
shows the data from the Lakshola River during 1960 and 1989,
whereas the lower panel shows the mean from the Laks
˚
a Bridge,
Strand
˚
a, andVallvatn rivers (notedifferent scales). The Lakshola
River represents a mountain–glacier regime with a strong max-
imum discharge during summer and is approximately 10 times
larger than the other rivers. The Laks
˚
a Bridge and Vallvatn River
represent an inland–transition regime, while the Strand
˚
aRiver
represents a coastal regime; all of these regimes have a similar
seasonal cycle. The major difference between these watermarks
and Lakshola is the enhanced discharge during fall (September
and October) and winter (December and January), which is most
pronounced in 1989. All the rivers had higher runoff during 1989
than in 1960 for every month.
The circulation model.—The circulation model used was
the Regional Ocean Modeling System (ROMS), version 3.0
(Shchepetkin and McWilliams 2005; Haidvogel et al. 2008).
This is a three-dimensional, free-surface, hydrostatic, primitive
equation ocean model that uses terrain-following s-coordinates
in the vertical. The primitive equations were solved on an
Arakawa C-grid. A generic length scale (GLS) turbulence
closure scheme was used for subgrid-scale mixing in these sim-
ulations with a modified form of the Mellor–Yamada 2.5closure
(Warner et al. 2005b). The ROMS has been successfully applied
to various modeling problems on the continental shelf seas,
RETENTION OF COASTAL COD EGGS 283
FIGURE 3. Annual mean discharge from four rivers in the model area, standardized for comparison. The two selected years are marked with black dots.
1 2 3 4 5 6 7 8 9 10 11 12
0
10
20
30
40
50
Discharge [m
3
/s]
1989
1960
1 2 3 4 5 6 7 8 9 10 11 12
0
1
2
3
4
5
6
Discharge [m
3
/s]
1989
1960
FIGURE 4. Monthly mean discharge from January until December for the years 1960 and 1989 in Lakshola River (upper panel) and an average of Laks
˚
a Bridge,
Strand
˚
a, and Vallvatn rivers (lower panel); note the difference in scales.
284 MYKSVOLL ET AL.
including the Chukchi Sea (Winsor and Chapman 2004), the
Norwegian coast (Vikebø et al. 2005), the Barents Sea (Budgell
2005; Gammelsrød et al. 2009), the Philippine Archipelago
(Han et al. 2009), the coastal Gulf of Alaska (Hermann et al.
2009), Skagerrak and the North Sea (Albretsen and Røed 2010),
and in coastal zones such as the southern Benguela Current
(Mullon et al. 2003), Hudson River estuary (Warner et al.
2005a), Chesapeake Bay (Li et al. 2005), Storfjorden (Smedsrud
et al. 2006), and the coast of Peru (Brochier et al. 2008).
The model domain includes high-resolution bathymetry in
which the largest depth was set to 300 m to avoid overly steep
gradients. The horizontal grid length was about 200 m, and
the vertical was spanned by 35 sigma levels, with increased
resolution near the surface and reduced resolution toward the
bottom. Thethickness ofthe upper layer varied from29 to 33 cm.
The initial hydrography field was interpolated from data col-
lected in the fjord system during November 1993. The model run
started on November 1 the year before the year of interest. The
atmospheric forcing was extracted from the ERA-40 archive,
with a horizontal resolution of 1
◦
and a temporal resolution of
6 h. The lateral boundary conditions were taken from a climato-
logical data set covering the Nordic Seas (Engedahl et al. 1998)
and containing the monthly mean salinity, temperature, cur-
rents, and surface elevation with 20 km resolution. The lateral
forcing is included along the open boundary outside the fjord
system along with four tidal constituents (M
2
,S
2
,N
2
, and K
1
).
The particle-tracking model.—A Lagrangian advection and
diffusion model (LADIM) was used to simulate the trans-
port of cod eggs inside the fjord system with a fourth-order
Runge–Kutta advection scheme (Ådlandsvik andSundby 1994).
The model applied the hourly mean output from ROMS to ad-
vect the eggs with a time step of 6 s in an off-line mode. Each
egg had its own level of neutral buoyancy, and a vertical buoy-
ant velocity was calculated depending on the density difference
between the egg and the surrounding water. The vertical dis-
placement was computed based on the buoyant velocity and
the eddy diffusivity coefficient, as described in Thygesen and
Ådlandsvik (2007).
Each egg was given a fixed specific level of neutral buoy-
ancy according to the distribution in Figure 5. The data were
taken from Stenevik et al. (2008) who showed that the specific
gravity of cod eggs did not vary much among three coastal
broodstocks, except for Porsanger, which is assumed to be in-
fluenced by the Arcto-Norwegian cod. The data from Tysfjord,
a neighboring fjord of Sørfolda and Nordfolda, was used in
this study. The buoyancy was held constant through the de-
velopmental stages. The coastal cod eggs have a tendency to
get heavier halfway during their development and lighter again
immediately before hatching. The corresponding buoyancy vari-
ations are small compared with the observed salinity variations
in the fjord. Because the local salinity profile is most important
for determining the vertical distribution, variations in buoyancy
through developmental stages would not introduce large dif-
ferences. For easier interpretation of the results, the eggs were
FIGURE 5. Neutral buoyancy of Norwegian coastal cod eggs (Stenevik et al.
2008), divided into five buoyancy groups for easier comparison of the model
results.
divided into five buoyancy groups: Group 1: 30.5–31.3; group 2:
31.3–32.0; group 3: 32.0–32.7; group 4: 32.7–33.4; and group
5: 33.4–34.1 in which salinity is equivalent to neutral buoy-
ancy (see Figure 5). All the buoyancy groups spanned a salinity
range of 0.7. Because eggs attain the same temperature as the
ambient water, the specific gravity and egg buoyancy is largely
controlled by salinity alone. The simulations were continued for
21 d, close to the incubation time for cod eggs at this latitude
with low temperatures (Page and Frank 1989). Four different
release times where used: March 15, April 1, April 15, and May
1. In every drift experiment, approximately 15,000 eggs were
released at a depth of 20 m. Initial depth does not affect horizon-
tal distribution when buoyancy is included in the calculations
(Parada et al. 2003; Brochier et al. 2008). Four spawning areas
were chosen based on Figure 1 and represent different parts of
the fjord system: the head of Sørfolda, Leirfjorden, the head
of Nordfolda, and Vinkfjord, with respective distances of 50.0,
55.9, 39.6, and 55.9 km from the coast. The 15,000 particles
were equally distributed among the four spawning areas. No
background information has been available to make other as-
sumptions. The diameter of coastal cod eggs ranges from 1.2 to
1.6 mm. The egg diameter used in the present modeling was the
mean diameter of 1.4 mm. Data from Norwegian coastal cod
showed no clear relationship between egg diameter and buoy-
ancy. In Tysfjord the diameter stays constant while the buoyancy
varies (Kyungmi Jung, Institute of Marine Research, personal
communication).
The vertical distribution of cod eggs was calculated with
a Matlab toolbox routine called VertEgg (Ådlandsvik 2000),
which is based on the steady-state distribution developed by
Sundby (1983). In all calculations, the egg diameter was set to
1.4 mm, wind speed to 6 m/s, mean buoyancy to 32.41 with SD
of 0.69 (Stenevik et al. 2008), and maximum depth to 100 m.
A case-specific salinity profile was included in each case, and
RETENTION OF COASTAL COD EGGS 285
FIGURE 6. Modeled patterns of (a) salinity and (b) temperature with respect to depth across the mouth of Leirfjorden on July 14, 2007.
the terminal velocity was computed by Stokes’ or Dallavalle’s
formula. Then, the exact stationary solution of the convection
diffusion equation was calculated as a function of eddy diffu-
sivity and terminal velocity. When model results were available,
the modeled eddy diffusivity was used; otherwise, constant eddy
diffusivity was computed from the wind speed.
RESULTS
Model Evaluation
In July 2007 a hydrographic survey was performed in
Sørfolda, which consisted of 31 conductivity–temperature–
depth (CTD) stations, including several cross-sections. This
is the only adequate mapping available from a season with
relatively high river runoff, suitable for evaluating the hy-
drographic structure in the model. Therefore, the circulation
model was run for 2007 to compare the model results against
observations.
The salinity section from the model is shown in Figure 6a
and that from observations in Figure 7a. The location of the
cross-section was at the mouth of Leirfjorden where it enters the
main part of Sørfolda. Both measurements and model indicated
a low-salinity surface layer restricted to the upper 5 m. The
surface salinity was lower in the model results (∼20) compared
FIGURE 7. Observed patterns of (a) salinity and (b) temperature with respect to depth across the mouth of Leirfjorden on July 14, 2007.
286 MYKSVOLL ET AL.
FIGURE 8. Observed (left panel) and modeled (right panel) salinity profiles
on July 14, 2007, at the position marked with a red star in Figure 1, together
with the egg concentrations calculated from those profiles.
with the observations (∼25). The vertical positions of the 31
and 32 isohaline layers were similar between the cases, at about
4–5 m and 6–7 m depth, respectively. This observation implies
that the thickness of the low-salinity layer was similar between
the model and the observations. This pattern was present for all
the cross-sections available from this survey. Figures 6b and 7b
show the corresponding temperature section as viewed in Fig-
ures 6a and 7a. The model results showed a distinct thermocline
at about 5 m depth, while the observations indicate a smoother
transition from the warm surface toward the cold water
below. The surface temperature was higher in the observations
(∼14
◦
C) than in the model (∼11
◦
C). The highest temperatures
in the observations were restricted to the upper 2–3 m.
In Figure 8, one single salinity profile was chosen from the
position in Sørfolda marked with a red star in Figure 1. The left
panel shows the observed salinity profile, and the right panel
shows the corresponding values from the model, both from July
14, 2007. The major difference between the profiles was again
the surface salinity, being 21 in the model compared with 25 in
the observations. The black lines in Figure 8 are the calculated
vertical distributions of cod eggs based on the buoyancy distri-
bution shown in Figure 5 and the observed and modeled salinity
profiles, respectively. Both panelsshow strong similarities in the
vertical distribution of the eggs. Almost no eggs were located
above 5 m, and the maximum egg concentration was between
10 and 20 m, declining below 20 m for both cases. The pattern at
this station was representative of all the stations sampled during
this survey. It also demonstrated that the vertical distribution of
eggs can be realistically reproduced by the model system.
Hydrography and Circulation
The daily mean salinity at 1 m depth on April 25 in 1960
and 1989 is shown in Figure 9. In late April, the river runoff
is relatively high, and the period covers the main part of the
cod spawning period. Both years show progressively increasing
salinity from head to mouth in all fjord branches. The results
showed a gradient across the fjord in Sørfolda, but to a much
lesser degree in Nordfolda. The cross-fjord difference was more
pronounced in 1989 than in 1960. The salinity was generally
higher in 1960 compared with 1989. In April 1989, there was
a pronounced difference between Sørfolda and Nordfolda, with
FIGURE 9. Modeled daily mean salinity at 1 m depth on April 25 in (a) 1960 and (b) 1989.
RETENTION OF COASTAL COD EGGS 287
FIGURE 10. Vertical distributions of cod eggs according to (a) the modeled salinity profiles and (b) the modeled along-fjord current speeds (positive direction
towards the ocean) in April 1960 and April 1989 at the position marked with a red star in Figure 1.
the lowest salinity present in Sørfolda, reflecting the large dif-
ference in freshwater input between Sørfolda and Nordfolda.
The low-salinity surface layer, which covers a large part of
the fjord system, is accompanied by strong currents in the upper
layer directed out of the fjord. These are characteristics of the
estuarine circulation and describe the general pattern in the
fjord system. When the river runoff is low at the beginning
of the ice melt season, the difference between Sørfolda and
Nordfolda is apparent but not very strong. As the freshwater
discharge increases during spring, the difference becomes more
pronounced and was always more distinct in 1989.
Transport of Eggs as a Function of Buoyancy
The vertical distribution of cod eggs according to the local
salinity profile is shown in Figure 10a as monthly averages from
April 1960 (left panel) and 1989 (right panel). The main differ-
ence between 1960 and 1989 was the surface salinity, which
was highest in the cold and dry year of 1960. Some cod eggs
were located at the surface in 1960, while the maximum con-
centration was at 5 m depth. However, in the warm and wet
year of 1989, all the eggs were positioned below 2.5 m, with
the highest concentration occurring around 7.5 m depth. The
vertical egg distribution along with the current profile is shown
in Figure 10b. The outflowing surface layer was about 20 m
deep in 1960, compared with 10 m in 1989. A greater portion
of eggs was thus situated within the outgoing surface layer in
1960 compared with 1989.
The trajectories from a random selection of eggs in buoy-
ancy group 2 are shown in Figure 11. The eggs were released on
April 15 in 1960 and 1989 and advected for 21 d, and the black
boxes indicate the four different release positions. The trajecto-
ries during 1960 covered the entire fjord system. The spawning
areas of Vinkfjord and Sørfolda showed large dispersals of eggs,
both within the fjord branches and out through the mouth. The
eggs released in Leirfjorden and Nordfolda remained within a
small radius from their initial position. In 1989, only eggs from
Vinkfjord showed large dispersion; all other spawning areas had
a high degree of retention (Figure 11b).
The main results are summarized in Tables 1 and 2, which
show the mean distance traveled by cod eggs from spawning
areas after 21 d of advection, with the SD values in parentheses.
The results between 1960 and 1989 as a function of the buoy-
ancy group, spawning time, and spawning area are compared in
Table 1, while results are divided in Table 2 into spawning times
as a function of the buoyancy group and spawning area. The
results demonstrate that the SD was comparable to the mean
value in all cases, indicating high variability. Buoyancy group
1, which included the lightest eggs, was subjected to the longest
transport during both years and all spawning times. Heavier
eggs were transported shorter distances. This pattern was evi-
dent during both 1960 and 1989 (Table 1). A two-way analy-
sis of variance (ANOVA) method showed that the 2 years were
significantly different at a 95% confidence level after accounting
for buoyancy variations (P = 0.0418) but not significantly dif-
ferent when including spawning time (P = 0.1153) or spawning
area (P = 0.3895). The results indicate that seasonal variations
(P = 0.0181) in spawning were more important for the disper-
sal of cod eggs than were interannual variations. The largest
288 MYKSVOLL ET AL.
FIGURE 11. Trajectories of a random selection of eggs in buoyancy group 2 released on April 15 and transported for 21 d in (a) 1960 and (b) 1989. The black
boxes indicate spawning areas.
change in transport occurred between April 1 and May 1. Also,
the spawning area was an important variable controlling disper-
sal (P = 0.0081). In particular, spawning in Vinkfjord differed
significantly from that in the other spawning areas.
The data in Table 2 are averages of those for 1960 and
1989 and focus on seasonal variations as a function of the
buoyancy group and spawning area. The two-way ANOVA
analyses show that both spawning time (P = 0.0029) and
buoyancy (P = 0.0002) were important factors affecting the
spreading of cod eggs. The two first spawning times showed
a larger spread than the final two. All of the buoyancy groups
except group 5 were significantly different from each other.
When combining spawning time with spawning area, the sea-
TABLE 1. Mean distance [km] travelled by cod eggs from spawning areas
for 21 days, standard deviation in parenthesis, comparing 1960 and 1989.
1960 1989
Buoyancy Gr 1 13.01 (12.45) 10.12 (11.37)
Buoyancy Gr 2 10.31 (10.83) 9.24 (10.80)
Buoyancy Gr 3 7.82 (9.05) 6.46 (8.43)
Buoyancy Gr 4 4.74 (5.92) 3.71 (3.79)
Buoyancy Gr 5 5.01 (4.70) 4.83 (4.03)
15 March 7.69 (8.02) 7.56 (9.75)
1 April 10.25 (11.24) 8.73 (12.04)
15 April 7.90 (11.04) 5.89 (6.22)
1May 4.81 (6.81) 4.47 (6.04)
Sørfolda 2.82 (7.29) 1.94 (5.49)
Leirfjorden 4.92 (6.27) 3.36 (4.33)
Nordfolda 4.
27 (6.58) 5.27 (7.33)
Vinkfjord 10.19 (9.38) 9.44 (9.67)
sonality (P = 0.1135) was no longer important; only location
remained important (P = 0.0007). The Vinkfjord spawning area
significantly differed from all others. If Vinkfjord was removed
from the analyses, seasonality was again important (P =
0.0103) together with location (P = 0.015). This indicates
that changes during the spawning season were not important
in Vinkfjord but were significant in Sørfolda, Leirfjorden, and
Nordfolda. The seasonal changes were evident as differences
between the two first spawning times and the last two. Without
Vinkfjord, a significant difference was also apparent between
the spawning areas in Sørfolda and Nordfolda.
DISCUSSION
Model Evaluation
The model reproduced the strong stratification characteristic
of Norwegian fjords with considerable river runoff. The thick-
ness of the low-salinity surface layer showed good correspon-
dence between the model and observations. This suggests that
the river forcing in the model setup was realistic and that the
model captured the upper water circulation well. Warner et al.
(2005b) used ROMS in a shallow (15 m) estuary and showed
good agreement between the model results and observations.
The surface salinity was generally lower in the model than
in the observations. Both unresolved vertical mixing and coarse
boundary conditions might have contributed to this discrep-
ancy. Small-scale mixing originating from internal waves and
complex topography were not well represented and could have
made a considerable contribution to the overall vertical salin-
ity structure. The Mellor–Yamada 2.5 closure scheme was used
in this study, but several earlier studies have shown that the
RETENTION OF COASTAL COD EGGS 289
TABLE 2. Mean distance [km] travelled by cod eggs from spawning areas for 21 days, standard deviation in parenthesis, as a function of spawning time.
15 March 1 April 15 April 1 May
Buoyancy Gr 1 13.46 (11.58) 15.08 (13.70) 9.07 (11.31) 8.65 (11.05)
Buoyancy Gr 2 10.85 (10.63) 14.62 (13.89) 8.25 (10.79) 5.38 (8.00)
Buoyancy Gr 3 7.15 (8.45) 10.08 (11.98) 6.76 (8.88) 4.57 (5.65)
Buoyancy Gr 4 4.48 (5.12) 4.40 (5.39) 4.46 (5.28) 3.58 (3.64)
Buoyancy Gr 5 6.92 (5.41) 5.24 (4.85) 4.29 (3.91) 3.23 (3.30)
Sørfolda 2.78 (7.21) 3.57 (9.40) 1.83 (5.17) 1.34 (3.
77)
Leirfjorden 6.44 (8.46) 4.91 (6.34) 2.87 (4.07) 2.34 (2.32)
Nordfolda 5.63 (7.29) 7.23 (10.20) 3.28 (4.99) 3.30 (5.34)
Vinkfjord 7.48 (7.73) 11.78 (11.11) 12.36 (11.10) 7.64 (8.17)
results are insensitive to different closure schemes (Li et al.
2005; Warner et al. 2005a, 2005b). Coarse boundary conditions
with low temporal resolution will probably affect the circula-
tion in the intermediate layer. Nonlocal wind aligned with the
coast creates upwelling and downwelling at the coast. Density
variations at the coast can cause large volume fluxes out of or
into the fjord (Asplin et al. 1999). Skogen et al. (2009) found
that the exchange of water between the Hardangerfjord and the
coast was the most important factor providing nutrients to the
system. Instabilities and mixing will then be created at the in-
terface between the intermediate layer and the upper layer. Li
et al. (2005) also reported that ROMS was less accurate under
conditions of strong stratification.
The difference between the observed temperature and the
modeled temperature was linked to the strong model stratifi-
cation. The model displayed a two-layer structure, while the
observations continuously decrease from high temperatures at
the surface downward. The strong halocline in the model pre-
vented the heat input at the surface from penetrating deeper and
distributed the heat equally in the surface layer.
The wind forcing from ERA-40, with 1
◦
resolution, did not
capture the complex wind structure in this fjord system. A com-
parison between wind from ERA-40 and from observations from
the Norwegian Meteorological Institute () is shown
in Figure 12. The observations are from Skrova, a coastal sta-
tion located in Vestfjorden and Kobbelv, a fjord station located
at the head of Leirfjorden. The figure shows the frequency of
wind speed, ranging from 1 to 15 m/s, during the period from
March 1 until May 31, 1989. The observations from Skrova
were similar to ERA-40, indicating that the most common wind
speeds were between 2 and 6 m/s for both data sets. Stronger
winds (8–12 m/s) were also represented in both time series. At
the fjord station the most common wind speeds were between
0 and 2 m/s, and no observations were above 7 m/s. The wind
forcing from ERA-40 had no spatial variability between these
two sites. This comparison illustrates that the wind forcing from
ERA-40 represents the coastal area well, but performs poorly
inside the fjord. Steep and complex topography surrounding the
fjord causes local variations in both wind speed and direction,
which are not resolved by the forcing field. The total effect of
these processes is not known. Some places will experience lee
effects and others strong jet effects. Svendsen and Thompson
(1978) recognized that the wind stress inside the fjord is not
correlated with the wind stress at the coast. The steep mountain
surrounding the fjord will steer the wind along the fjord axis,
causing the wind to be directed straight into or out of the fjord
(Svendsen 1995).
The difference in surface salinity between the model and
the observations did not affect the vertical distribution of cod
eggs (Figure 8) because the neutral buoyancy of the eggs was
considerably higher than both the observed and modeled sur-
face salinities. Although the model was not able to match the
observed surface salinity exactly, the salinity structure below
the surface layer corresponded well with the observations. The
corresponding vertical distribution of cod eggs based on the ob-
servations was well reproduced by the model. This demonstrates
that the model is suitable for studying the horizontal transport
of cod eggs as a function of vertical distribution. Stenevik et al.
FIGURE 12. Wind speeds at Skrova and Kobbelv comparing observations
from the Norwegian Meteorological Institute () and the forcing
used in the model run from ERA-40.
290 MYKSVOLL ET AL.
(2008) showed that the local salinity profile is the most impor-
tant factor controlling the vertical distribution of coastal cod
eggs.
Hydrography and Circulation
The model results show that Nordfolda was generally more
saline than Sørfolda (Figure 9). This difference is caused mainly
by higher freshwater input to Sørfolda. When the total river
runoff is low, this difference is present but not as pronounced.
Aure and Pettersen (2004) also observed the difference between
the fjords during the fall, showing that this is a general feature.
The surface layer was shallower and had lower salinity in
1989 than in 1960 (Figure 10a, b). The most significant change
in the model forcing between the years is the river runoff. Much
energy is needed to mix all of this freshwater downward, so it
remains at the surface, forming a thin fresh layer. Wind stress is
an important factor that provides energy for mixing at the surface
(Klinck et al. 1981; Leth 1995; Gibbs et al. 2000). Svendsen and
Thompson (1978) argue that strong stratification in a fjord can
trap the wind-stress response at the near-surface layer. The wind
forcing in the model had little variability between the years,
implying that the modeled difference in surface layer thickness
was caused by the river runoff.
Transport of Eggs as a Function of Buoyancy
Eggs from the Norwegian coastal cod spawned inside
Sørfolda and Nordfolda attained a subsurface vertical distribu-
tion, avoiding the surface (Figure 10a, b). The vertical position
of eggs is controlled by the specific gravity of eggs relative to the
local salinity structure. By “choosing” to spawn in an estuarine
environment with low surface salinity, the coastal cod affect the
vertical distribution of their eggs. This spawning strategy causes
local retention of eggs within the fjord system (Figure 11). If the
coastal cod spawn outside the fjord in the marine environment
with higher surface salinities, their eggs would attain a pelagic
distribution and would be subjected to large dispersal with the
Norwegian Coastal Current (Sundby 1983). Vestfjorden, just
outside the fjord system, is the main spawning area for the
Arcto-Norwegian cod that spread their eggs and larvae over
large areas (Vikebø et al. 2005). These model results support
the hypothesis by Asplin et al. (1999) that species can adapt
their spawning depth and buoyancy of eggs to reduce dispersal
of early life stages. Several studies have shown evidence for
retention of cod eggs in Norwegian fjords (Salvanes et al. 2004;
Espeland et al. 2007; Jorde et al. 2007; Knutsen et al. 2007) but
few have explored the underlying physical mechanism. Genetic
research has confirmed the existence of several genetically
differentiated coastal cod broodstocks (Jørstad 1984; Pogson
and Fevolden 2003; Dahle et al. 2006; Øresland and Andr
´
e
2008; Stransky et al. 2008). For species with long egg and larval
stages the potential for offshore transport is large (Cowen et al.
2000), suggesting that persistent physical mechanisms that
cause retention are necessary to maintain genetic separation.
Strong retention mechanisms for eggs within a fjord sup-
port the indications that the genetic difference between fjord
populations is larger than the difference between a fjord pop-
ulation and a coastal population (Pogson and Fevolden 2003).
The model results showed that most of the eggs were retained
within the fjord, and a small portion was transported out, but
no eggs were seen drifting back into the fjord. Only the lightest
eggs situated in the low-salinity outflowing layer were trans-
ported out of the fjord. As long as they are transported at this
depth, the currents are directed out of most fjords. This indi-
cates a low connectivity between fjords during the egg stage.
However, frequent shifts between northerly and southerly winds
on the coast that cause up- and downwelling could counteract
this mechanism and enhance genetic exchange between neigh-
boring fjords (Asplin et al. 1999). Bucklin et al. (2000) found
that the genetic structure of plankton between fjords depend on
species behavior. Passively drifting species (e.g., the copepod
Calanus finmarchicus) show no significant genetic differentia-
tion between fjord populations, while resident species (e.g., the
copepod Acartia clausi) show a marked difference.
Interannual variations in river runoff can cause small changes
in the vertical distribution of cod eggs and larger changes in the
vertical current structure (Figure 10b). The cod eggs attained
subsurface distributions in both 1960 and 1989, which were
shifted 2–3 m down in 1989. This change was mainly due to
lower salinities in the surface layer in 1989. This difference
was present toward the end of the spawning period (late April
and May) when the ice melt season had started. The shift in
the vertical distribution together with a shallower outflowing
layer caused stronger retention during this period for the lightest
buoyancy egg groups during 1989 (Figure 11). For the heavier
fractions of eggs, retention occurred during both years. Early
in the spawning season (late March and early April) the pattern
of retention was the opposite, and the strongest retention oc-
curred in 1960. One explanation for this difference is a shift in
the onset of the ice melt season. Before ice melting starts, the
potential for offshore transport is small; this explains the high
egg retention that occurred during the early spawning season
in 1960. When the melting starts and the estuarine circulation
develops, the possibility for advection out of the fjord increases.
Consequently, there was an increased loss of light eggs during
the late part of the spawning season in 1960 and during the early
part of the spawning season in 1989. The river runoff demon-
strated that the melting started about 1 month earlier in the warm
year, 1989, than it did in the cold year, 1960. High river runoff
during the period of ice melt produces a thin surface layer with
low salinities. Most of the eggs are then negatively buoyant in
the surface layer and sink below the strong outflow. This is the
reason for the increased retention at the end of the spawning
period in 1989. These results indicate that there is a “window”
of about 1 month during which a small portion of the lightest
cod eggs is able to leave the fjord system. This “window” is
open before the estuarine circulation is well established and co-
incided with relatively high surface salinities. The timing for
RETENTION OF COASTAL COD EGGS 291
opening this “window” can change between years as a function
of precipitation and temperature, which both contribute to the
river runoff. The exact spawning time for coastal cod is not well
known but probably continues for several months during spring
(Kjesbu 1988). A possible match between maximized spawn-
ing and the “window” of leakage could have a negative effect
on local recruitment. Otter
˚
a et al. (2006) showed differences
in spawning time between cod broodstocks from four regions
in Norway kept under identical conditions. This indicates that
the subpopulations of cod might have adapted their spawning
behavior to the local environment.
Though this study included two different and extreme years,
the total difference in retention was not large. The major dif-
ference was the timing of the leakage. This suggests that the
retention mechanism is robust within the observed range. The
field data from 2007 (Figure 2), which was a year of medium
river runoff, also indicate retention of cod eggs in the inner part
of the fjord system. Unfortunately, the ship was not able to enter
the inner part of Nordfolda where the model indicated reten-
tion of eggs. The model results show that the light eggs had a
higher probability of being transported offshore than were the
heavier eggs (Table 1). Progressively heavier eggs were trans-
ported decreasing distances until they reached buoyancy group
4 (32.7–33.4), after which increased buoyancy no longer had an
effect. This might be the reason why the coastal cod have devel-
oped eggs that are heavier than those of the Arcto-Norwegian
cod (Kjesbu et al. 1992), which spawn just outside of the fjord
system. When the light eggs are transported out of the fjord sys-
tem, they are probably lost from the local population unless the
pelagic juvenile cod actively migrate back into the ecosystem
where they were spawned. Only heavy eggs that remain inside
the fjord, in the vicinity of the spawning ground, are likely to
contribute to the local recruitment.
The cod eggs released in Vinkfjord were spread out and cov-
ered a larger area than those in all the other spawning grounds.
This feature was evident for all buoyancy groups and at all times
(Tables 1 and 2). In Figure 1, Vinkfjord is marked as a spawning
area, but not as a nursery area. This background information
supports the results provided by the model, implying that this
was not an artifact created by the model. One reason for the
strong dispersal from Vinkfjord might be the low river input to
the fjord branch. As described earlier, the river runoff affects the
vertical distribution of cod eggs and enhances retention. If this
mechanism is not present in Vinkfjord, the dispersal is larger
than elsewhere in thefjord system. After removing the Vinkfjord
spawning area from the ANOVA analysis, a difference between
Nordfolda and Sørfolda became evident. This difference was
also related to the river runoff, which can be seen in Figure 4.
The lower panel shows the smaller amount of freshwater enter-
ing Nordfolda than Sørfolda, and also starting earlier during the
winter. This explains the weaker retention in Nordfolda and the
large dispersal early in the spawning season.
Transport of anchovy Engraulis capensis eggs as a function
of buoyancy has been studied in upwelling systems with both
ROMS and individual-based models by Parada et al. (2003) and
Brochier et al. (2008). They show that the buoyancy of eggs,
which affects the vertical distribution, is important for deter-
mining retention even though the egg stage only lasts 1–4 d. An
upwelling system is similar to an estuarine system regarding the
vertical current structure. Strong currents at the surface are di-
rected away from the coast, and below the currents are directed
toward the coast. The vertical positioning in relation to this
strong vertical gradient is important for determining retention
success (Sundby et al. 2001). North and Houde (2006) investi-
gated retention of white perch Morone americana and striped
bass M. saxatilis early life stages in Chesapeake Bay during
2 years of different freshwater discharge. In this system, the lar-
val recruitment is strongly linked to the physics of the estuarine
turbidity maximum (ETM) (North and Houde 2001). During
a year with discharge below average, negative consequences
were observed for fish early-stage retention and survival. This
is an example of fish that take advantage of physical phenomena
and increase local retention and recruitment. Most of the mod-
eling simulations performed to explore retention mechanisms
have been applied to fish with short egg-stage durations (1–4 d).
Ouellet (1997) sampled cod eggs in the Gulf of St. Lawrence
and found that egg development at 0
◦
C lasted for approximately
40 d. Temperature strongly affects the cod egg stage duration
(Page and Frank 1989) and causes egg stages to be long at high
latitudes such as in northern Norway. Werner et al. (1993) in-
vestigated the retention of cod early life stages on Georges Bank
with the egg-stage duration of 20 d. Their results indicate that
larvae located within the surface Ekman layer were subjected to
offshore transport and loss from Georges Bank. The retention
increases strongly when spawning takes place at shallow waters
northeast of the bank. The work by Werner et al. (1993) is simi-
lar to what has been presented here regarding specific spawning
behavior that can enhance the retention of cod eggs with long
egg-stage durations.
The interaction between egg buoyancy and the physical en-
vironment is an important mechanism determining the dispersal
and local recruitment of Norwegian coastal cod. Observations
show that the physical environment is changing, going from a
cold and dry climate around 1960–1970 toward a warm and wet
climate from about 1990 onwards. This trend is expected to con-
tinue as a result of the observed and predicted global warming.
Regional downscaling of climate models together with hydro-
logical models show an increase in the annual mean discharge
between 10% and 20% for the period 2071–2100 compared with
1961–1990 for a specific river in Sørfolda (Roald et al. 2006).
In particular, during the spring season, the increase reached
50–70%, varying with different projections of greenhouse gas
emission and climate model used. The results from our study
showed that the highest probability for leakage of cod eggs was
during a limited time period linked to the onset of the melting
season, which is dependent on precipitation and temperature in
any particular year. In the warm and wet year of 1989, this
“window” of leakage opened early in the spawning season.
292 MYKSVOLL ET AL.
Because the climate is continuing to get warmer and wetter
this “window” is moving further into the early part of the spring
season. Assuming that the spawning period for coastal cod stays
constant, the “window” will have closed by the time the spawn-
ing starts, and the quantity of eggs transported out of the system
will decrease. In this way, climate might enhance the genetic
differentiation between coastal subpopulations. However, high
temperatures are accompanied by enhanced low-pressure activ-
ity in northern Norway, and climate models predict stronger and
more frequent passages of low-pressure systems. Strong winds
along the coast will increase mixing and might enhance the fre-
quency of upwelling events with the potential to transport the
upper layer out of the fjord (Asplin et al. 1999). These pro-
cesses might increase the offshore transport of early life stages,
meaning that the total effect of climate change is not apparent.
Even though the retention of cod eggs within the fjord sys-
tem is strong, some light eggs are subjected to offshore transport
for a limited time period. The fate of these eggs is unknown.
Will they survive and contribute to the Arcto-Norwegian cod
population? Will they be transported to unfavorable areas and
die? Or will they actively migrate back to their spawning habi-
tats as pelagic juveniles or adults? If these eggs contribute to
the recruitment of the Arcto-Norwegian cod population, this
offshore transport will counteract the genetic differentiation be-
tween the fjord and the oceanic Atlantic cod stock. Moreover, it
is important to emphasize that the transport of eggs from Arcto-
Norwegian cod spawning areas into the Norwegian coastal cod
areas is much less likely to occur. Therefore, a potential gene
flow will be directed only one way, from the Norwegian coastal
cod populations to the Arcto-Norwegian cod population. This
gene flow might change in a future warmer climate and possibly
enhance the genetic differentiation.
ACKNOWLEDGMENTS
We acknowledge Ingeborg Kleivane at The Norwegian Water
Resources and Energy Directorate (NVE) for providing hydro-
logical data, and Gyda Lor
˚
as at the Norwegian Directorate of
Fisheries for local information about spawning and nursery ar-
eas. We also thank Karen Gjertsen for editing the figures and
Lars Asplin for valuable discussion. This work received finan-
cial support from the Bjerknes Centre for Climate Research. We
thank two anonymous reviewers for constructive comments that
helped to significantly improve the manuscript.
REFERENCES
Ådlandsvik, B. 2000. VertEgg: a toolbox for simulation of vertical distribution
of fish eggs. Institute of Marine Research, Bergen, Norway.
Ådlandsvik, B., and S. Sundby. 1994. Modeling the transport of cod larvae from
the Lofoten area. ICES (International Council for the Exploration of the Sea)
Marine Science Symposia 198:379–392.
Albretsen, J., and L. P. Røed. 2010. Decadal long simulations of mesoscale
structures in the northern North Sea/ Skagerrak using two ocean models.
Ocean Dynamics 60:933–935.
Asplin, L., A. G. V. Salvanes, and J. B. Kristoffersen. 1999. Nonlocal wind-
driven fjord-coast advection and its potential effect on plankton and fish
recruitment. Fisheries Oceanography 8:255–263.
Aure, J., and R. Pettersen. 2004. Miljøundersøkelser i Norske fjorder
1975–2000. [Environmental investigations in Norwegian fjords 1975–2000.]
Fisken og Havet 8:1–176. (In Norwegian).
Bergstad, O. A., T. Jørgensen, and O. Dragesund. 1987. Life history and ecology
of the gadoid resources of the Barents Sea. Fisheries Research 5:199–161.
Brochier, T., C. Lett, J. Tam, P. Fr
´
eon, R. Colas, and P. Ay
´
on. 2008. An
individual-based model study of anchovy early life history in the northern
Humboldt Current system. Progress in Oceanography 79:313–325.
Bucklin, A., S. Kaartvedt, M. Guarnieri, and U. Goswani. 2000. Population
genetics of drifting (Calanus spp.) and resident (Acartia clausi) plankton in
Norwegian fjords. Journal of Plankton Research 22:1237–1251.
Budgell, W. P. 2005. Numerical simulation of ice-ocean varibility in the Barents
Sea region towards dynamical downscaling. Ocean Dynamics 55:370–387.
Cowen, R. K., K. M. M. Lwiza, S. Sponaugle, C. B. Paris, and D. B. Olson. 2000.
Connectivity of marine populations: open or closed? Science (Washington,
D.C.) 287:857–859.
Dahle, G., K. E. Jørstad, H. E. Rusaas, and H. Otter
˚
a. 2006. Genetic charac-
teristics of broodstock collected from four Norwegian coastal cod (Gadus
morhua) populations. ICES (International Council for the Exploration of the
Sea) Journal of Marine Science 63:209–215.
Dyer, K. R. 1997. Estuaries: a physical introduction, 2nd edition. Wiley, New
Yo rk .
Ellertsen, B., P. Fossum, P. Solemdal, and S. Sundby. 1989. Relation between
temperature and survival of eggs and first-feeding larvae of northeast Arctic
cod (Gadus morhua L.). Rapports et Proces-Verbaux des Reunions Conseil
International pour l’Exploration de la Mer 191:209–219.
Engedahl, E., B. Ådlandsvik, and E. A. Martinsen. 1998. Production of monthly
mean climatology archives for the Nordic Seas. Journal of Marine Systems
14:1–26.
Espeland, S. H., A. F. Gundersen, E. M. Olsen, H. Knutsen, J. Gjøsæter, and
N. C. Stenseth. 2007. Home range and elevated egg densities within an
inshore spawning ground of coastal cod. ICES (International Council for the
Exploration of the Sea) Journal of Marine Science 64:920–928.
Farmer, D. M., and H. J. Freeland. 1983. The physical oceanography of fjords.
Progress in Oceanography 12:147–220.
Fridgeirsson, E. 1978. Embryonic development of five species of gadoid fishes
in Icelandic waters. Rit Fiskideildar 5:1–68.
Gammelsrød, T., Ø. Leikvin, V. Lien, W.P.Budgell,H.Loeng,andW. Malowski.
2009. Mass and heat transports in the NE Barents Sea: observations and
models. Journal of Marine Systems 75:56–69.
Gibbs, M. T., M. J. Bowman, and D. E. Dietrich. 2000. Maintenance of near-
surface stratification in Doubtful Sound, a New Zealand fjord. Estuarine,
Coastal, and Shelf Science 51:683–704.
Haidvogel, D. B., H. Arango, W. P. Budgell, B. D. Cornuelle, E. Curchitser, E.
Di Lorenzo, K. Fennel, W. R. Geyer, A. J. Hermann, L. Lanerolle, J. Levin,
J. C. McWilliams, A. J. Miller, A. M. Moore, T. M. Powell, A. F. Shchepetkin,
C. R. Sherwood, R. P. Signell, J. C. Warner, and J. Wilkin. 2008. Ocean
forecasting in terrain-following coordinates: formulation and skill assessment
of the regional ocean modeling system. Journal of Computational Physics
227:3595–3624.
Han, W., A. M. Moore, J. Levin, B. Zhang, H. G. Arango, E. Curchitser, E.
Di Lorenzo, A. L. Gordon, and J. Lin. 2009. Seasonal surface ocean circula-
tion and dynamics in the Philippine Archipelago region during 2004–2008.
Dynamics of Atmospheres and Oceans 47:114–137.
Hermann, A. J., S. Hinckley, E. L. Dobbins, D. B. Haidvogel, N. A. Bond,
C. Mordy, N. Kachel, and P. J. Stabeno. 2009. Quantifying cross-shelf and
vertical nutrient flux in the Coastal Gulf of Alaska with a spatially nested,
coupled biophysical model. Deep-Sea Research Part II: Topical Studies in
Oceanography 56:2474–2486.
ICES (International Council for the Exploration of the Sea). 2009. Report of the
Arctic fisheries working group. ICES, C.M. 2009/ACOM:02, Copenhagen.
RETENTION OF COASTAL COD EGGS 293
Jakobsen, T. 1987. Coastal cod in northern Norway. Fisheries Research
5:223–234.
Jorde, P. E., H. Knutsen, S. H. Espeland, and N. C. Stenseth. 2007. Spa-
tial scale of genetic structuring in coastal cod Gadus morhua and geo-
graphic extent of local populations. Marine Ecology Progress Series 343:229–
237.
Jørstad, K. 1984. Genetic analyses of cod in northern Norway. Pages 745–760
in E. Dahl, D. S. Danielsen, E. Moksness, and P. Solemdal, editors. The prop-
agation of cod (Gadus morhua L.). Institute of Marine Research Biological
Station, Arendal, Norway.
Kjesbu, O. S. 1988. Fecundity and maturity of cod. ICES (International Council
for the Exploration of the Sea), C.M.1988/G:28, Copenhagen.
Kjesbu, O. S., H. Kryvi, S. Sundby, and P. Solemdal. 1992. Buoyancy variations
in eggs of Atlantic cod in relation to chorion thickness and egg size: theory
and observations. Journal of Fish Biology 41:581–599.
Klinck, J. M., J. J. O’Brien, and H. Svendsen. 1981. A simple model of
fjord and coastal circulation interaction. Journal of Physical Oceanography
11:1612–1626.
Knutsen, H., P. E. Jorde, C. Andre, and N. C. Stenseth. 2003. Fine-scaled
geographical population structuring in a highly mobile marine species: the
Atlantic cod. Molecular Ecology 12:385–394.
Knutsen, H., E. M. Olsen, L. Cianneli, S. H. Espeland, J. A. Knutsen, J. H.
Simonsen, S. Skreslet, and N. C. Stenseth. 2007. Egg distribution, bottom
topography and small-scale cod population structure in a coastal marine
system. Marine Ecology Progress Series 333:249–255.
Leth, O. K. 1995. A study on the effect of local wind on the dynamics of the
upper layer in the inner part of Malangen. Pages 185–194 in H. R. Skjoldal,
C. Hopkins, K. E. Erikstad, and H. P. Leinaas, editors. Ecology of fjords and
coastal waters. Elsevier, Amsterdam.
Li, M., L. Zhong, and W. C. Boicourt. 2005. Simulations of Chesapeake Bay
estuary: sensitivity to turbulence mixing parameterizations and comparison
with observations. Journal of Geophysical Research 110:C12004.
Mohus, Å., and M. Haakstad. 1984. Straumbukta i Sørfold, en kortfattet hy-
drografisk og hydrokjemisk kartlegging. [Straumbukta in Sørfold a brief hy-
drographic and hydrochemical survey.] Nordland distriktshøgskole, Bodø,
Norway. (In Norwegian).
Mullon, C., P. Freon, C. Parada, C. van der Lingen, and J. Hugget. 2003. From
particles to individuals: modelling the early stages of anchovy (Engraulis
capensis/encrasicolus) in the southern Benguela. Fisheries Oceanography
12:396–406.
North, E. W., and E. D. Houde. 2001. Retention of white perch and striped bass
larvae: biological-physical interactions in Chesapeake Bay estuarine turbidity
maximum. Estuaries 24:756–769.
North, E. W., and E. D. Houde. 2006. Retention mechanisms of white perch
(Morone americana) and striped bass (Morone saxatilis) early-life stages in
an estuarine turbidity maximum: an integrative fixed-location and mapping
approach. Fisheries Oceanography 15:429–450.
Øresland, V., and C. Andr
´
e. 2008. Larval group differentiation in Atlantic cod
(Gadus morhua) inside and outside the Gullmar Fjord. Fisheries Research
90:9–16.
Otter
˚
a, H., A. L. Agnalt, and K. E. Jørstad. 2006. Differences in spawning time
of captive Atlantic cod from four regions of Norway, kept under identical con-
ditions. ICES (International Council for the Exploration of the Sea) Journal
of Marine Science 63:216–223.
Ouellet, P. 1997. Characteristics and vertical distribution of Atlantic cod (Gadus
morhua) eggs in the northern Gulf of St. Lawrence, and the possible effect
of cold water temperature on recruitment. Canadian Journal of Fisheries and
Aquatic Sciences 54:211–223.
Page, F. H., and K. T. Frank. 1989. Spawning time and eggs stage duration
in northwest Atlantic haddock (Melanogrammus aeglefinus) stocks with em-
phasis on Georges Bank and Browns Bank. Canadian Journal of Fisheries
and Aquatic Sciences 46:68–81.
Parada, C., C. D. van derLingen, C. Mullon, and P. Penven. 2003. Modelling the
effectof buoyancy on the transport of anchovy (Engraulis capensis) eggs from
spawning to nursery grounds in the southern Benguela: an IBM approach.
Fisheries Oceanography 12:170–184.
Pedersen, T. 1984. Variation of peak spawning of Arcto-Norwegian cod (Gadus
morhua L.) during the time period 1929–1982 based on indices estimated
from fishery statistics. Pages 301–316 in E. Dahl, D. S. Danielsen, E. Mok-
sness, and P. Solemdal, editors. The propagation of cod (Gadus morhua L.).
Institute of Marine Research Biological Station, Arendal, Norway.
Pogson, G. H., and S. E. Fevolden. 2003. Natural selection and the genetic
differentiationofcoastalandArcticpopulationsoftheAtlanticcodinnorthern
Norway: a test involving nucleotide sequence variation at the pantophysin
(PanI) locus. Molecular Ecology 12:63–74.
Roald, L. A., S. Beldring, T. E. Skaugen, E. J. Førland, and R. Benestad.
2006. Climate change impacts on streamflow in Norway. Norwegian Water
Resources and Energy Directorate, Consultancy Report A 1-2006, Oslo.
Sælen, O. H. 1967. Some features of the hydrography of Norwegian fjords.
Pages 63–70 in G. H. Lauff, editor. Estuaries. American Association for the
Advancement of Science, Washington, D.C.
Salvanes, A. G. V., J. E. Skjæraasen, and T. Nilsen. 2004. Sub-populations of
coastal cod with different behavior and life history strategies. Marine Ecology
Progress Series 267:241–251.
Shchepetkin, A. F., and J. C. McWilliams. 2005. The regional ocean modeling
system (ROMS): a split-explicit, free-surface, topography following coordi-
nate oceanic model. Ocean Modelling 9:347–404.
Skogen, M. D., M. Eknes, L. C. Asplin, and A. D. Sandvik. 2009. Modelling
the environmental effects of fish farming in a Norwegian fjord. Aquaculture
298:70–75.
Smedsrud, L. H., W. P. Budgell, A. D. Jenkins, and B. Ådlandsvik. 2006.
Fine-scale sea-ice modelling of the Storfjorden polynya, Svalbard. Annals of
Glaciology 44:73–79.
Stenevik, E. K., S. Sundby, and A. L. Agnalt. 2008. Buoyancy and vertical
distribution of Norwegian coastal cod (Gadus morhua) eggs from different
areas along the coast. ICES (International Council for the Exploration of the
Sea) Journal of Marine Science 65:1198–1202.
Stigebrandt, S. 1981. A mechanism governing the estuarine circulation in
deep, strongly stratified fjords. Estuarine, Coastal, and Shelf Science 13:197–
211.
Stransky, C., H. Baumann, S. E. Fevolden, A. Harbitz, H. Høie, K. H. Nedreaas,
A. B. Salberg, and T. H. Skarstein. 2008. Separation of Norwegian coastal cod
and Northeast Arctic cod by outer otolith shape analysis. Fisheries Research
90:26–35.
Sundby, S. 1982. [Investigations in Vestfjorden 1978: freshwater budget and
wind conditions]. Fisken og Havet 1:1–30. (In Norwegian with English sum-
mary.)
Sundby, S. 1983. A one-dimensional model for the vertical distribution of
pelagic fish eggs in the mixed layer. Deep-Sea Research Part A: Oceano-
graphic Research Papers 30:645–661.
Sundby, S. 1991. Factors affecting the vertical distribution of eggs. ICES (In-
ternational Council for the Exploration of the Sea) Marine Science Symposia
192:33–38.
Sundby, S., A. J. Boyd, L. Hutchings, M. J. O’Toole, K. Thorisson, and A.
Thorsen. 2001. Interaction between cape hake spawning and the circulation
in the northern Benguela upwelling ecosystem. South African Journal of
Marine Science 23:317–336.
Svendsen, H. 1995. Physical oceanography of coupled fjord-coast systems in
northern Norway with special focus on frontal dynamics and tides. Pages
149–164 in H. R. Skjoldal, C. Hopkins, K. E., Erikstad, and H. P. Leinaas,
editors. Ecology of fjords and coastal waters. Elsevier, Amsterdam.
Svendsen, H., and R.O.R.Y. Thompson. 1978. Wind-driven circulation in a
fjord. Journal of Physical Oceanography 8:703–712.
Thygesen, U. H., and B. Ådlandsvik. 2007. Simulating vertical turbulent disper-
sal with finite volumes and binned random walks. Marine Ecology Progress
Series 347:145–153.
Vikebø, F., S. Sundby, B. Ådlandsvik, and Ø. Fiksen. 2005. The combined
effect of transport and temperature on distribution and growth of larvae and
294 MYKSVOLL ET AL.
pelagic juveniles of Arcto-Norwegian cod. ICES (International Council for
the Exploration of the Sea) Journal of Marine Science 62:1375–1386.
Warner, J. C., W. R. Geyer, and J. A. Lerczak. 2005a. Numerical modeling of
an estuary: a comprehensive assessment. Journal of Geophysical Research
110:C05001.
Warner, J. C., C. R. Sherwood, H. G. Arango, and R. P. Signell. 2005b. Perfor-
mance of four turbulence closure models implemented using a generic length
scale method. Ocean Modelling 8:81–113.
Werner, F. E., F. H. Page, D. R. Lynch, J. W. Loder, R. G. Lough,
R. I. Perry, D. A. Greenberg, and M. M. Sinclair. 1993. Influence of
mean advection and simple behavior on the distribution of cod and
haddock early life stages on Georges Bank. Fisheries Oceanography 2:
43–64.
Winsor, P., and D. C. Chapman. 2004. Pathways of Pacific water across the
Chukchi Sea: a numerical model study. Journal of Geophysical Research
109:C03002.