Long term changes in fish assemblage structure in the yellow river estuary ecosystem, china
Bạn đang xem bản rút gọn của tài liệu. Xem và tải ngay bản đầy đủ của tài liệu tại đây (620.56 KB, 15 trang )
BioOne sees sustainable scholarly publishing as an inherently collaborative enterprise connecting authors, nonprofit publishers, academic institutions, research
libraries, and research funders in the common goal of maximizing access to critical research.
Long-Term Changes in Fish Assemblage Structure in the Yellow River Estuary
Ecosystem, China
Author(s): Xiujuan ShanPengfei SunXianshi JinXiansen Li and Fangqun Dai
Source: Marine and Coastal Fisheries: Dynamics, Management, and Ecosystem Science, 5():65-78. 2013.
Published By: American Fisheries Society
URL: />BioOne (www.bioone.org) is a nonprofit, online aggregation of core research in the biological, ecological, and
environmental sciences. BioOne provides a sustainable online platform for over 170 journals and books published
by nonprofit societies, associations, museums, institutions, and presses.
Your use of this PDF, the BioOne Web site, and all posted and associated content indicates your acceptance of
BioOne’s Terms of Use, available at www.bioone.org/page/terms_of_use.
Usage of BioOne content is strictly limited to personal, educational, and non-commercial use. Commercial inquiries
or rights and permissions requests should be directed to the individual publisher as copyright holder.
Marine and Coastal Fisheries: Dynamics, Management, and Ecosystem Science 5:65–78, 2013
C
American Fisheries Society 2013
ISSN: 1942-5120 online
DOI: 10.1080/19425120.2013.768571
ARTICLE
Long-Term Changes in Fish Assemblage Structure
in the Yellow River Estuary Ecosystem, China
Xiujuan Shan
Key Laboratory for Sustainable Utilization of Marine Fisheries, Ministry of Agriculture,
Yellow Sea Fisheries Research Institute, Chinese Academy of Fishery Sciences, Qingdao 266071, China
Pengfei Sun
Key Laboratory for Sustainable Utilization of Marine Fisheries, Ministry of Agriculture,
Yellow Sea Fisheries Research Institute, Chinese Academy of Fishery Sciences, Qingdao 266071,
China; and College of Marine Sciences, Shanghai Ocean University, Shanghai 201306, China
Xianshi Jin*
Key Laboratory for Sustainable Utilization of Marine Fisheries, Ministry of Agriculture,
Yellow Sea Fisheries Research Institute, Chinese Academy of Fishery Sciences, Qingdao 266071, China
Xiansen Li and Fangqun Dai
Key Laboratory for Fishery Resources and Eco-environment, Shandong Province,
Yellow Sea Fisheries Research Institute, Chinese Academy of Fishery Sciences, Qingdao 266071, China
Abstract
The Yellow River estuary ecosystem is an important spawning ground for many species found in the Bohai Sea
and Yellow Sea and contributes substantially to the fishery resource structure and biological reproduction in the
northern China Sea. Based on long-term ecosystem surveys in the Yellow River estuary during the main spawning
period (May) of most fishery species from 1959 to 2011, the responses of the ecosystem, including regime shifts in
species composition, biomass, diversity, and other related factors, were analyzed in this study. Since the 1980s, the
dominant large-size species of high economic value (e.g., Largehead Hairtail Trichiurus lepturus) have been replaced by
short-lived, low-trophic-level, planktivorous pelagic species (e.g., Scaly Hairfin Anchovy Setipinna taty and Japanese
Anchovy Engraulis japonicus). Currently, traditional commercially targeted fishes, such as the Largehead Hairtail,
Red Seabream Pagrus major, and Pacific Herring Clupea pallasii, are locally extinct. There has been a rapid shift of
dominant species from highly valued, high-trophic-level, large-sized demersal species with complicated age structures
to low-value, low-trophic-level, small-sized pelagic species with simple age structures; this shift has resulted in major
changes to the ecological cycle and restoration of fishery resources. The fish catch declined from 421.66 kg/h in 1959
to 0.25 kg/h in 2008 and then increased to 3.62 kg/h in 2011. Diversity and evenness indices showed a continuously
increasing trend during 1959–2011. The Yellow River estuary may be significantly compromised by overfishing,
climate change, dam construction, and pollution, resulting in the decline of traditional fishing industries and reduced
biodiversity in this ecosystem.
Subject editor: Suam Kim, Pukyong National University, Busan, South Korea
*Corresponding author:
Received August 30, 2012; accepted January 11, 2013
65
66 SHAN ET AL.
Estuaries play an essential role as feeding, spawning, and
breeding grounds for many fishes, including freshwater and
marine species, and they are important for many resident
estuarine species because they offer a favorable habitat and
support the migratory routes for catadromous and anadromous
species (Elliott and McLusky 2002; Martinho et al. 2007,
2008). However, estuarine ecosystems have been suffering
from eutrophication, overfishing, climate change, and general
environmental degradation (Martinho et al. 2008). Thus, several
studies on ecosystem health have been conducted (James et al.
2008; Selleslagh et al. 2009; Nicolas et al. 2010), including
long-term studies that are used to analyze trends in fish assem-
blages (Elliott et al. 2007; Purcell et al. 2010). Overfishing and
climate change are increasingly threatening the world’s marine
ecosystems, and the effects of fishing on marine ecosystems
worldwide have consequences for populations and communi-
ties (Pauly et al. 2002; Myers and Worm 2003; Jennings and
Blanchard 2004). It is important to identify the dynamics of
the fish community in response to climatic regime shifts and
anthropogenic activities (Yasunaka and Hanawa 2002).
The Yellow River estuary ecosystem is a spawning zone for
many commercial species of the Bohai Sea and Yellow Sea; it
also constitutes the major fishing ground in the northern China
Sea. In recent years, with a growing population and increasing
economic development along the Bohai Sea coast, the Yellow
River estuary ecosystem has greatly changed (Zhao et al.
2000), resulting in further impacts on the growth, survival, and
reproduction of fishery species (Liu et al. 2003). These impacts,
coupled with high fishing intensity—particularly the rapid
development of bottom-trawl prawn fisheries—have led to an
abundance of juveniles of commercial species in the catch.
The demersal fisheries have declined, and due to high fishing
intensity the major fishery stocks have changed through
cascading trophic chain reactions, particularly regime shifts of
dominant species and variations in individual size and age (Jin
and Tang 1998; Jin and Deng 2000; Wang 2009). However,
long-term variations in fish assemblage diversity and trophic
spectrum structure in the Yellow River estuary ecosystem have
not been fully addressed.
Fish assemblage diversity is the basis of survival and develop-
ment for some societies, as fish supply high-quality protein and
improve the dietary structure. Conservation of fish assemblage
diversity is related to the future of sustainable development,
so it is necessary to understand the processes and mechanisms
of long-term variations in biodiversity. These variations are
of worldwide concern, and the measures to be implemented
in management initiatives aimed at sustainable fisheries and
biodiversity conservation should be fully considered. Species
composition and richness describe qualitative variations of fish
species; biomass and productivity refer to the quantity and rate
of production. Stability can refer to the temporal constancy of
a community, resistance to environmental change, or resilience
after a disturbance. Based on long-term fishery survey data col-
lected in May (the spawning period for most of the Bohai Sea and
Yellow Sea fish species that spawn in the Yellow River estuary),
the present study involved analysis of variations in species
composition and fish assemblage diversity, as well as trophic
spectrum structure, stability, and related factors, over the past
50 years.
METHODS
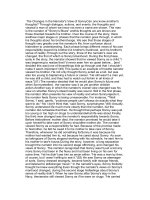
Study Area and Field Sampling Procedures
The Yellow River estuary ecosystem (Figure 1) is located
in the southern Bohai Sea (south to 38
◦
50
N; 119
◦
30
Eto
120
◦
30
E) and accounts for approximately 10% of the total
Bohai Sea area. The estuary is characterized by a shallow-water
shelf, where the water depth is less than 15 m, and the sedi-
ments are composed of soft mud and sand. The Yellow River
estuary is an important ecological zone because the Yellow, Xi-
aoqing, Bailang, Guangli, Wei, and Jiaolai rivers enter the sea
at this location. These rivers deliver abundant freshwater and
terrestrial materials, such as sediment and nutrients, thereby
providing resources for the high productivity in this area. The
estuary forms the main spawning grounds and habitats for many
commercial species of the Yellow Sea and Bohai Sea, such as
the Small Yellow Croaker Larimichthys polyactis, Largehead
Hairtail Trichiurus lepturus, Yellow Drum Nibea albiflora, and
Red Seabream Pagrus major. The Yellow River estuary also
supports the Bohai Sea fishing industry, supplying up to 40%
of the Bohai Sea total catch. The coastal waters of the Yellow
River estuary are bounded by a heavily urbanized area, the flu-
vial plain along the estuary is surrounded by agricultural land,
and the freshwater from the Yellow River is greatly regulated
by dams and rainfall.
In the present study, fish assemblage data were obtained
from bottom-trawl surveys in May of 1959, 1982, 1993, 1998,
2003, 2008, and 2011 at 20 designated stations (Figure 1). Two
trawlers (∼200-hp vessels) were deployed for 1- or 2-h tows;
CPUE was standardized to1hateach station (for fish species
FIGURE 1. Sampling stations in the Yellow River estuary ecosystem.
CHANGES IN FISH ASSEMBLAGE STRUCTURE 67
only). All specimens were sorted at the species level and were
counted and weighed on-board. Only fish were included in the
analysis. The same net was used for all sampling; the mesh size
for the net opening was 6.3 cm, the depth of the net opening
was 6 m, the width of the net opening was 22.6 m, the mesh
size of the cod end was 2 cm, and the trawling speed was
approximately 4.82 km/h (2.6 knots). During each sampling
cruise, duplicate water samples were collected to measure
water temperature (with a reversal thermometer) and salinity
(with an induction salinometer).
Data Analysis
Functional groups.—Functional groups were determined
based on feeding habits and adult mobility (Bellwood et al.
2004; Micheli and Halpern 2005). The fish species in the Yel-
low River estuary were divided into eight functional groups:
planktivores (G1), planktivores/benthivores (G2), benthivores
(G3), benthivores/piscivores (G4), omnivores (G5), mobile pis-
civores (G6), elasmobranchs (G7), and roving piscivores (G8;
Bellwood et al. 2004; Zhuang et al. 2006; Zhang et al. 2007;
Jiang 2008).
Diversity indices.—The variation in fish species compo-
sition was examined by using cluster analysis based on the
Bray–Curtis similarity matrix calculated from square-root-
transformed biomass (kg/h) data (Clarke and Warwick 2001).
Species richness was estimated with Margalef’s richness index
(R; Margalef 1958). The Shannon–Weaver diversity index (H
;
Shannon and Weaver 1949) and Lande’s index (1 − λ; Lande
1996) were used to assess species diversity. Pielou’s evenness
index (J
; Pielou 1975) was used to determine evenness. All of
the biodiversity indices were calculated from relative biomass
(kg/h).
Trophic category and mean trophic level index.—Fish species
were stratified into five trophic categories (from planktivores
to roving piscivores) based on trophic level and food habits:
(1) trophic levels less than 3.0 (e.g., Dotted Gizzard Shad
Konosirus punctatus and Redeye Mullet Liza haematocheila);
(2) trophic levels ≥ 3.0 but less than 3.5 (e.g., Japanese
Anchovy Engraulis japonicus, Scaly Hairfin Anchovy Setip-
inna taty, and Osbeck’s Grenadier Anchovy Coilia mystus);
(3) trophic levels ≥ 3.5 but less than 4.0 (e.g., Silver Pomfret
Pampus argenteus and Marbled Flounder Pseudopleuronectes
yokohamae); (4) trophic levels ≥ 4.0 but less than 4.5 (e.g., Fat
Greenling Hexagrammos otakii and most of the flatfishes); and
(5) trophic levels ≥ 4.5 but less than 5.0 (e.g., Japanese Seabass
Lateolabrax japonicus, Monkfish Lophius litulon [also known
as Yellow Goosefish], Mottled Skate Raja pulchra, and Mi-iuy
Croaker Miichthys miiuy). Trophic level information for each
species was based on the literature and prey analysis (Yang
et al. 2001; Zhang 2005).
The mean trophic level (MTL) of fish landings can be used
as an index of sustainability in exploited marine ecosystems
(Pauly et al. 2002). The MTL for the fish community not only
depended on the trophic level of each species but also reflected
the proportion of biomass for each species. In the present study,
the MTL of each fish community was estimated according to
Tian et al. (2006),
MTL =
n
i=1
TL
i
Y
i
Y
,
where Y
i
represents the catch of species i in every sampling
period, Y represents the sum of catch for the total number of
species n in every sampling period; and TL
i
is the trophic level
for species i. The MTL values were compared with values from
similar studies in the Bohai Sea (Yang et al. 2001; Zhang 2005).
Climatic and oceanographic indices.—The Southern Oscil-
lation Index (SOI; www.bom.gov.au/climate/current/soihtm1.
shtml), monthly sea surface temperature (SST) anomalies
(www.coaps.fsu.edu/pub/JMA
SST Index/), and warm and
cold SST phases (www.coaps.fsu.edu/jma.shtml) were chosen
as the climatic indices for the western Pacific Ocean. These
indices were well documented and associated with interannual–
interdecadal variability not only of atmospheric and oceanic
conditions but also of marine ecosystems in the North Pacific
(Beamish et al. 2000; Tian et al. 2004). Data on Yellow River
runoff, sediments, and basinwide precipitation in each year were
obtained from the Bulletin of Sediments and Runoff for the
Yellow River (YRCC 1950–2009). The El Ni
˜
no–Southern Os-
cillation (ENSO) events identified from the SOI and SST data
correspond well with lows in annual water and sediment flux
to the western Pacific Ocean, showing that climate oscillation
dominates short-term (interannual) fluctuations in sediment flux
and rainfall.
RESULTS
Species Composition and Dominant Species
In total, 77 fish species belonging to 33 families were col-
lected in the Yellow River estuary ecosystem during 1959–2011.
Eight fish species (10.4% of species) were collected during ev-
ery sampling year. With the exception of the Silver Pomfret and
Small Yellow Croaker, most of these eight species were pelagic
fishes, including the Japanese Anchovy, Scaly Hairfin Anchovy,
Smallhead Hairtail Eupleurogrammus muticus, Dotted Gizzard
Shad, Madura Anchovy Thryssa kammalensis, and White Gun-
nel Pholis fangi. Species composition analysis indicated that
for more than 99% of the total weight of fish catch, there were
extreme changes in fish species composition during 1959–2011
(Table 1).
In 1959, fish catch mostly consisted of commercial species,
such as the Largehead Hairtail, Small Yellow Croaker, Tongue
Sole, Tiger Puffer, White Croaker, and Japanese Seabass. The
Largehead Hairtail was the predominant species of the total
catch, with a CPUE reaching 330.03 kg/h. The CPUE for the
Small Yellow Croaker was 65.20 kg/h. The Largehead Hairtail
and Small Yellow Croaker catches accounted for 93.9% of the
68 SHAN ET AL.
TABLE 1. Top-ten fish species composition (average catch [kg/h] and contribution to total fish catch [%]) for each sampling year in the Yellow River estuary
ecosystem, 1959–2011.
1959 1982 1993 1998 2003 2008 2011
Species kg/h % kg/h % kg/h % kg/h % kg/h % kg/h % kg/h %
Largehead Hairtail Trichiurus lepturus 330.03 78.4 0.26 0.8
Small Yellow Croaker Larimichthys
polyactis
65.20 15.5 0.46 1.4 0.32 6.5 0.01 5.1 0.60 16.7
Tongue Sole Cynoglossus semilaevis 7.99 1.9 0.03 0.8
Tiger Puffer Fugu rubripes 3.56 0.9 0.19 5.2
Bartail Flathead Platycephalus indicus 3.49 0.8 0.03 0.9 0.05 1.1
White Croaker Argyrosomus
argentatus (Pennahia argentata)
2.98 0.7
Japanese Seabass Lateolabrax
japonicus
1.17 0.3 6.57 4.2 0.79 21.8
Rayfish (Ocellate Spot Skate) Raja
porosa (Okamejei kenojei)
0.93 0.2 0.63 1.9
Silver Pomfret Pampus argenteus 0.68 0.2 0.23 0.7 0.16 4.7 0.35 7.1 0.07 29.2 0.23 6.4
Red Tonguesole Cynoglossus joyneri 0.67 0.2 0.04 1.1
Finespot Goby Chaeturichthys
stigmatias
0.08 1.6
Bighead Croaker Collichthys niveatus 2.12 1.3
White Gunnel Pholis fangi 0.02 7.2 0.19 5.3
Japanese Anchovy Engraulis
japonicus
40.66 25.8 22.64 68.1 0.61 17.7 0.01 1.5
Smallhead Hairtail Eupleurogrammus
muticus
0.18 5.2 0.03 0.6 0.01 5.9
Dotted Gizzard Shad Konosirus
punctatus
0.88 2.7 0.32 9.3 0.05 1.1 0.01 4.1 0.04 1.0
Monkfish (Yellow Goosefish) Lophius
litulon
0.05 1.0 0.25 6.8
Flathead Mullet (Striped Mullet)
Mugil cephalus
1.75 1.1
Bluefin Leatherjacket Navodon
septentrionalis
0.02 9.3
Yellow Drum Nibea albiflora 16.83 10.7
Eel Goby Odontamblyopus rubicundus 0.08 1.5
Olive Flounder Paralichthys olivaceus 1.62 1.0
Marbled Flounder Pseudopleuronectes
yokohamae
1.70 1.1
Japanese Sardinella Sardinella zunasi 6.79 4.3 0.40 1.2
Japanese Spanish Mackerel
Scomberomorus niphonius 0.35 1.0 0.04 14.2
Scaly Hairfin Anchovy Setipinna taty 67.21 42.7 2.45 7.4 0.57 16.5 2.28 46.1 0.03 13.0 0.64 17.8
Purple Puffer Takifugu vermicularis 4.21 2.7
Madura Anchovy Thryssa
kammalensis
4.05 12.2 1.20 35.0 1.57 31.7 0.01 4.0 0.43 11.8
Moustache Thryssa Thryssa mystax 0.04 1.1
Hound Needlefish Tylosurus giganteus
(Tylosurus crocodilus)
0.07 1.9
Total 416.70 99.0 149.46 94.8 32.35 97.7 3.21 93.1 4.86 98.3 0.23 93.5 3.40 93.9
CHANGES IN FISH ASSEMBLAGE STRUCTURE 69
total CPUE, whereas for other species the CPUE was below
10 kg/h and the catch was not above 2% of the total catch.
The dominant species in 1982 were mainly pelagic fishes; the
Japanese Anchovy and Scaly Hairfin Anchovy were the most
common species, accounting for 68.5% of the total catch. The
Yellow Drum was also a dominant species. In 1993, the Japanese
Anchovy, Madura Anchovy, and Scaly Hairfin Anchovy were
the dominant species; the combined catch of the three species
accounted for 87.7% of the total catch, but the CPUEs of these
species had sharply declined in comparison with the CPUEs
observed in 1982, particularly for the Scaly Hairfin Anchovy.
The CPUE of Japanese Anchovy declined from 40.66 kg/h in
1982 to 22.64 kg/h in 1993; the CPUE of Scaly Hairfin Anchovy
decreased from 67.21 kg/h in 1982 to 2.45 kg/h in 1993. In
1998, the CPUE for Madura Anchovy was greater than 1 kg/h,
whereas the CPUEs for all other species did not exceed 1 kg/h;
the dominant fishes were pelagic species.
In 2003, the CPUE was 2.28 kg/h for the Scaly Hairfin An-
chovy and 1.57 kg/h for the Madura Anchovy; these two species
accounted for 77.9% of the total catch. In 2008, the predomi-
nant fishes were pelagic species, including the Silver Pomfret,
Japanese Spanish Mackerel, and Scaly Hairfin Anchovy; how-
ever, the CPUE was below 0.1 kg/h for each species. In 2011,
the Japanese Anchovy and Madura Anchovy were the dominant
species, and the Small Yellow Croaker and Japanese Seabass
again were among the most common species in the catch, but
CPUEs for all species were less than 1 kg/h and were equiv-
alent to less than 1% of the CPUEs observed in 1959. During
the study period (1959–2011), the CPUE of every species de-
clined, most noticeably after 1998, when most of the species
had CPUEs below 1 kg/h. The dominant species changed from
large-sized commercial species in 1959 to small-sized pelagic
species beginning in 1982. In addition, some Chondrichthyes
species, such as the Rayfish (also known as the Ocellate Spot
Skate) and Spotless Smooth-hound Mustelus griseus, were not
observed during recent sampling years.
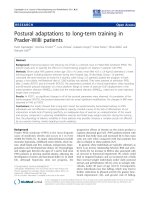
Dynamics in Abundance
Figure 2a represents the dynamics of fish catch and species
composition in the Yellow River estuary ecosystem during
1959–2011. Average fish catch decreased from 1959 to 2008
and then increased from 2008 to 2011. The highest fish catch
(421.66 kg/h) was obtained in 1959, and catch reached its low-
est value (0.25 kg/h) in 2008. Demersal species were the main
component of the fish catch structure in 1959, whereas in 1982
the percentage of demersal fish in the catch had greatly de-
clined. Correspondingly, the proportion of pelagic fish in the
total catch increased, peaking in 1993 and then stabilizing from
1998 to 2008. The contribution of demersal species to the total
catch gradually increased after 1993; during 2011, the propor-
tion of demersal fish in the total catch exceeded the proportion
of pelagic fish.
Table 2 shows the family-level composition of the fish catch
in the Yellow River estuary during 1959–2011. Engraulidae
FIGURE 2. Dynamics of (a) the average fish catch and (b) the mean trophic
level (MTL) of fish catch in the Yellow River estuary from 1959 to 2011.
was the common dominant family in the fish catch during all
sampling years (except 1959), particularly from 1982 to 2005.
Engraulidae accounted for more than 50% of the total catch.
Trichiuridae (78.4%) and Sciaenidae (16.3%) shared dominance
in the fish catch composition during 1959, with lesser contribu-
tions from Cynoglossidae, Tetraodontidae, and Platycephalidae.
In 1982, the fish catch mainly consisted of Engraulidae (68.6%)
and Sciaenidae (12.8%), followed by Clupeidae, Percidae, and
Tetraodontidae; other families contributed less than 2% of the
total catch. In 1993, Engraulidae (87.7%) was the dominant fish
family in the catch, followed by Clupeidae, Rajidae, Sciaenidae,
and Trichiuridae. During 1998, Engraulidae (69.4%) and Clu-
peidae (9.9%) were the predominant families in the catch, fol-
lowed by Trichiuridae and Stromateidae. In 2003, Engraulidae
(78.5%) was again the dominant family represented in the total
catch, followed by Stromateidae and Sciaenidae. During 2008,
Stromateidae (29.8%), Engraulidae (18.8%), and Polynemidae
(14.5%) were the dominant families in the total catch. The total
catch in 2011 primarily included Engraulidae (30.9%), Perci-
dae (21.8%), and Sciaenidae (16.9%) as the dominant families,
along with contributions from Lophiidae and Stromateidae.
Trophic and Community Structure
The MTL decreased from 1959 to 1998, increased slightly
in 2003, maintained a stable level from 2003 to 2008, and then
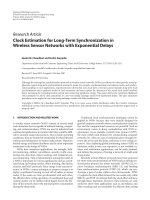
increased again in 2011 (Figure 2b). Figure 3 shows the trophic
structure of the fish catch in the Yellow River estuary ecosys-
tem. There were some differences among sampling years, so
the fish catch at different trophic levels was calculated by using
log
10
transformed CPUE. In 1959, the fish catch was mainly
70 SHAN ET AL.
TABLE 2. Family-level composition of the fish catch (kg/h) in the Yellow River estuary ecosystem during 1959–2011.
Family 1959 1982 1993 1998 2003 2008 2011
Trichiuridae 330.06 0.47 0.18
Engraulidae 108.06 29.14 2.38 3.88 0.05 1.12
Sciaenidae 68.69 20.10 0.61 0.32 0.61
Cynoglossidae 8.79 1.29
Clupeidae 7.77 1.28 0.34
Percidae 1.17 6.57 0.79
Tetraodontidae 3.56 4.51
Platycephalidae 3.49 1.32
Pleuronectidae 1.95
Mugilidae 1.75
Paralichthyidae 1.62
Triglidae 1.38
Stromateidae 0.16 0.35 0.07 0.23
Rajidae 0.63
Lophiidae 0.25
Polynemidae 0.04
Zoarcidae 1.12
Other 3.74 1.53 1.10 0.37 0.39 0.09 0.62
distributed at trophic levels 3.5–4.5 (particularly 4.0–4.5), fol-
lowed by 4.5–5.0; thus, the trophic level of the fish catch was
relatively high in that sampling year. During 1982, the trophic
level of the fish catch was also 3.5–4.5, but the most abundant
trophic level was 3.5–4.0. In addition, fish from trophic levels
lower than 3.5 accounted for a high proportion of the catch
in 1982. Correspondingly, the proportion of the fish catch at
trophic levels 4.0–5.0 decreased. In 1993, the fish catch rep-
resenting trophic levels 3.0–4.5 showed a distribution pattern
similar to that seen in 1982, but the catch from trophic levels
less than 3.0 and greater than 4.5 decreased. In 1998, the fish
catch greatly decreased, and the trophic level of the catch was
mainly distributed at 3.0–4.0. During that year, the fish catch at
trophic levels 4.0–4.5 decreased, and the fish catch representing
trophic levels less than 3.0 and greater than 4.5 also decreased.
In 2003 and 2008, the trophic level of the fish catch showed
similar trends as were observed in 1998; however, in 2008, few
individuals at trophic levels 4.5–5.0 were present in the catch.
During 2011, the trophic level of the catch showed similar trends
as in 1993, with fish being mainly distributed at trophic levels
3.0–4.5 (particularly 3.5–4.0).
The functional groups included the fish species with a total
weight greater than 100 g in each survey, and functional groups
were determined by feeding habits and the motility of adults.
Table 3 shows the functional group structure of the fish catch
from 1959 to 2011. In 1959, the fish catch by weight consisted
primarily of G6, followed by G4 and G5; the observed fish
species were mainly distributed in G1 and G4, followed by G6.
Although G1 encompassed the highest number of species, the
total catch weight contribution from G1 was just 1.0%. In 1982,
the fish catch by weight consisted mainly of G1, followed by G5
and G2; however, the observed species were mainly distributed
in G1, G2, and G3. During 1993, G1, G5, and G7 accounted
for high proportions of the fish catch by weight; high numbers
of species from G1, G3, and G6 were observed. In 1998, G1,
G3, and G6 contributed high proportions of the catch weight;
the percentage of observed species was highest for G1, G3, and
G5. In 2003 and 2008, functional group distribution patterns
showed a similar trend. Groups G1, G3, and G5 accounted for
high proportions of the fish catch by weight as well as high
percentages of the observed fish species. In 2011, the highest
fish catch percentages by weight were from G1, G5, and G8;
however, G1, G3, and G6 contributed the greatest numbers of
species.
A cluster analysis dendrogram based on Bray–Curtis similar-
ity in fish weight was used to assess similarity between sampling
years (Figure 4). The similarity analysis indicated significant
differences in the fish catch from 1959 to 2011. Excluding the
2008 sampling results, relatively high similarity in fish catch
was detected between proximate sampling years. The greatest
similarity was observed between the 2003 and 2011 fish catches,
whereas the lowest similarity was found between fish catch in
1959 and catches observed during the other years.
Species Diversity
The total number of species in the fish community was an
unambiguous index of species richness. The highest species
number was observed in 1982, followed by 1998 and 1959;
the lowest species number was found in 2008; and the species
number in the other sampling years was relatively stable at
CHANGES IN FISH ASSEMBLAGE STRUCTURE 71
FIGURE 3. Trophic structure of the fish catch in the Yellow River estuary from 1959 to 2011 (x-axis labels indicate the trophic levels).
approximately 25 species. The number of families in the fish
catch from 1959 to 2011 showed the same fluctuating trend
as species number (Figure 5a). The indices H
,1− λ, J
, and
Margalef’s R showed the comprehensive characteristics of
FIGURE 4. Cluster analysis dendrogram based on Bray–Curtis similarity (%)
between samples of fish assemblages in the Yellow River estuary from 1959 to
2011.
the fish community’s ecological diversity and heterogeneity.
Margalef’s R increased from 1959 to 1993, decreased through
2003, slightly increased in 2008, and exhibited another decrease
in 2011. The value of J
slightly increased over the study period;
however, H
and 1 − λ both showed a fluctuating, increasing
trend from 1959 to 2011. The two diversity indices (H
and 1 −
λ) increased from 1959 to 1982, decreased in 1993, increased
in 1998, and decreased through 2003; H
increased in 2008 and
then remained stable between 2008 and 2011, whereas 1 − λ
greatly increased from 2008 to 2011 (Figure 5b).
DISCUSSION
Variations in Community Structure and Diversity
In the Yellow River estuary, no more than 40 fish species
were collected during the main spawning season in each study
year from 1959 to 2011, with the exception of the 1982 season,
during no more than 25 families were collected. According
to the survey analysis, the fish species composition changed
in the Yellow River estuary. Only a few species were found
72 SHAN ET AL.
TABLE 3. Functional group composition of fish in the Yellow River estuary ecosystem during 1959–2011 (G1 = planktivores; G2 = planktivores/benthivores;
G3 = benthivores; G4 = benthivores/piscivores; G5 = omnivores; G6 = mobile piscivores; G7 = elasmobranchs; G8 = roving piscivores).
Trophic structure
Year Variable G1 G2 G3 G4 G5 G6 G7 G8
1959 Weight (kg/h) 4.28 3.99 1.41 9.15 68.56 331.37 2.04 0.07
Weight (%) 1.0 1.0 0.3 2.2 16.3 78.7 0.5 0.1
Species (%; n = 32) 18.8 9.4 9.4 18.8 12.5 15.6 12.5 3.1
1982 Weight (kg/h) 117.52 8.38 1.69 4.68 17.82 6.97 0.10 0.24
Weight (%) 74.7 5.3 1.1 3.0 11.3 4.4 0.1 0.2
Species (%; n = 47) 22.9 14.6 22.9 14.6 10.4 6.3 2.1 6.3
1993 Weight (kg/h) 31.04 0.07 0.32 0.06 0.57 0.10 0.63 0.00
Weight (%) 94.7 0.2 1.0 0.2 1.7 0.3 1.9 0.0
Species (%; n = 29) 33.3 7.4 22.2 7.4 11.1 14.8 3.7 0.0
1998 Weight (kg/h) 3.03 0.00 0.09 0.07 0.05 0.18 0.01 0.01
Weight (%) 88.2 0.0 2.7 2.0 1.5 5.3 0.1 0.3
Species (%; n = 35) 39.4 0.0 27.3 9.1 12.1 6.1 3.0 3.0
2003 Weight (kg/h) 4.37 0.00 0.16 0.01 0.32 0.03 0.00 0.05
Weight (%) 88.6 0.0 3.3 0.1 6.5 0.6 0.0 1.0
Species (%; n = 25) 50.0 0.0 20.8 8.3 8.3 4.2 0.0 8.3
2008 Weight (kg/h) 0.19 0.00 0.02 0.00 0.02 0.01 0.00 0.01
Weight (%) 75.5 0.0 9.2 0.0 7.0 5.6 0.0 1.4
Species (%; n = 19) 58.8 0.0 17.7 0.0 11.8 5.9 0.0 5.9
2011 Weight (kg/h) 1.58 0.19 0.09 0.05 0.61 0.05 0.01 0.25
Weight (%) 56.1 6.7 3.0 1.9 21.7 1.8 0.1 8.8
Species (%; n = 25) 36.0 4.0 20.0 8.0 8.0 12.0 4.0 8.0
FIGURE 5. Changes in (a) the number of fish species or families and (b) fish
diversity in the Yellow River estuary from 1959 to 2011 (indices: R = Margalef’s
richness index; J
= Pielou’s evenness index; H
= Shannon–Weaver diversity
index; 1 − λ = Lande’s diversity index).
consistently in every sampling year, and most of these were
pelagic species, including the Japanese Anchovy, Scaly Hairfin
Anchovy, Smallhead Hairtail, Dotted Gizzard Shad, Madura
Anchovy, and White Gunnel; two benthopelagic species, the
Silver Pomfret and Small Yellow Croaker, were also collected in
each study year. Values of J
, H
, and 1 − λ gradually increased
from 1959 to 2011, but Margalef’s R fluctuated, increasing
from 1959 to 1993, decreasing through 2003, and increasing
again in 2008. The high diversity of fish might be related to
high primary production in this estuary, which forms the major
spawning grounds and habitat for many commercial species in
the Bohai Sea and Yellow Sea. In 1959, the dominant species
in the fish catch were the Largehead Hairtail and Small Yellow
Croaker, accounting for 93.9% of the total catch and exhibiting
CPUEs greater than 60 kg/h. In recent years, pelagic species
were the dominant species in the fish catch, but their CPUEs
were less than 1 kg/h. Similar results were found during a
study of the fishery resource structure and dynamics of the
dominant species composition in Laizhou Bay (Jin and Deng
2000) and during a study of the ichthyoplankton composition in
Laizhou Bay (Wang 2009). The larval abundance was primarily
a measure of the spawning biomass and reproductive effort
of the adult stock in each year, and long-term trends in larval
abundance reflected trends in adult biomass. Several studies
have shown that larval abundance is a good indicator of adult
biomass (Moser et al. 2000, 2001).
CHANGES IN FISH ASSEMBLAGE STRUCTURE 73
In the present study, Engraulidae was the common dominant
family in the fish catch during the study years (except 1959),
particularly from 1982 to 2003. The engraulid catch accounted
for more than 50% of the total catch. Two families, Trichiuri-
dae (78.4%) and Sciaenidae (16.3%), were predominant com-
ponents of the fish catch during 1959. In 2008, Stromateidae
(29.8%), Engraulidae (18.8%), and Polynemidae (14.5%) were
the dominant families in the total catch. Engraulidae (30.9%),
Percidae (21.8%), and Sciaenidae (16.9%) were the dominant
families in the total catch during 2011. Correspondingly, the
MTL of the fish catch decreased from 1959 to 1998, increased
slightly in 2003, maintained a stable level from 2003 to 2008,
and then increased in 2011. Fish species in the catch were mainly
distributed at trophic levels 3.5–4.5 from 1959 to 1993; there-
after, the MTL of the fish catch was mainly distributed from 3.0
to 4.0. Over the study period, the functional groups G6 and G5
were replaced by G1 and G2. In addition, distinct differences
were found in the fish catch from 1959 to 2011 based on Bray–
Curtis similarity analysis. The fish community structure in the
Yellow River estuary ecosystem became simpler; regime shifts
of the fish community increased, which would be helpful in
restoring pelagic fish resources with high restoration potential
(Jin and Deng 2000). Thus, with the increase in human activities
and climate change, the fishery resource structure and the dom-
inant species composition in the Yellow River estuary changed,
the average fish catch declined, and small-sized, low-trophic-
level pelagic fishes became the dominant species in the catch.
Threats to Fish Assemblage Structure
Changes in the fish assemblage structure within the Yellow
River estuary are mainly due to human-induced disturbance
and climate change. The anthropogenic activities include over-
fishing, dam construction, land reclamation, and eutrophica-
tion. Climate change includes alterations in SST, rainfall, and
other related factors. Overfishing, dam construction, and climate
change are among the most serious problems contributing to the
variations in fish assemblage structure and fisheries.
Overfishing.—Overfishing is considered the key reason for
the decline of fish stock abundance in the Yellow River estu-
ary (Jin and Tang 1998; Jin and Deng 2000). For example, the
biomass of the fishery resources declined continuously from
423.6 kg·haul
−1
·h
−1
in 1959 to 164.6 kg·haul
−1
·h
−1
in 1982,
37.7 kg·haul
−1
·h
−1
in 1993, and less than 8 kg·haul
−1
·h
−1
in
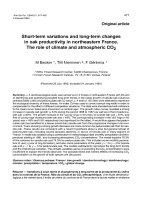
1998–2008, largely due to overfishing (Jin et al. 2013). Fig-
ure 6D illustrates the decrease in fish abundance with increasing
total fishing effort in the Bohai Sea, particularly for the Japanese
Anchovy and Scaly Hairfin Anchovy. Although small-sized fish-
ing vessels (hp < 50 kW) dominated the fishing industry in the
Yellow River estuary, they were characterized by high fishing
intensity (total hp in 2010 was approximately 40 times that in
1959) due to the greater availability of fishing gears. Nonselec-
tive fishing gears had serious impacts on juveniles of the fishery-
targeted species and greatly destroyed their habitats, thereby
causing some migrant species to be extirpated and leading to a
sharp decline in the fishery resources (Zhang et al. 2010b). The
changes in the Yellow River estuary’s fish assemblage structure
directly impacted the recruitment and fisheries in the Bohai Sea
and Yellow Sea (Jin and Deng 2000).
Overfishing is now widely recognized as one of the most
significant anthropogenic activities (Edgar et al. 2005). Over-
fishing not only has direct impacts on the stock fluctuation of
target species at high trophic levels (Hutchings and Baum 2005)
but also affects fish communities and ecosystems via cascad-
ing ecosystem effects (Pinnegar et al. 2000). Overfishing also
results in a decrease in the MTL of catches (Pauly et al. 1998)
by altering the extent of top-down regulation of fish assem-
blage structure (Tegner and Dayton 2000). Overfishing causes
changes in the food habits of some dominant species and alters
food chains and food webs in marine ecosystem (Pauly et al.
1998; Jin et al. 2010); it also impacts the spatial and tempo-
ral distributions of some species. Previous studies have shown
that fishing has depleted 50–70% of marine fish populations
(Hilborn et al. 2003), and the trophic level in the global fish-
ery catch decreased from 3.3 in the 1950s to 3.1 in 1994. In
recent decades, the trophic level has decreased by 0.1 every
10 years (Pauly et al. 1998). Correspondingly, the trophic level
in the Bohai Sea decreased from 4.1 in 1959 to 3.4 in 1998–
1999, and this decrease was higher than that observed worldwide
(Zhang and Tang 2004). Because fisheries tend to target large,
commercially important species, the removal of large, top-level
predators can effectively reduce the amount of predation risk for
smaller individuals, leading to an increased abundance of non-
target species. Nontarget species, particularly those with earlier
maturity and smaller size, are generally more resistant to fishing
pressure (Piet et al. 2009). Consequently, fluctuations in these
small pelagic fishes change the biological structure of the com-
munity or ecosystem via the “wasp-waist” middle-trophic-level
mechanism (Cury et al. 2000). The Japanese Anchovy, which
is the key species of the food web and the main commercial
species in the Yellow River estuary, has greatly declined since
1993, thus accelerating the changes in the estuarine food web
and trophic levels (Jin and Deng 2000). These changes led to
the succession in fisheries from long-lived, high-trophic-level,
piscivorous fish to short-lived, low-trophic-level, planktivorous
pelagic fish (Jin and Tang 1998; Pauly et al. 1998; Jin and Deng
2000; Savenkoff et al. 2007; Jin et al. 2010), and fisheries de-
creased to the point that some stocks in the ecosystem collapsed
(Jackson et al. 2001).
In addition, studies have shown that the decline in Small Yel-
low Croaker stock abundance due to overfishing has caused the
average body length of this species in the Yellow Sea to greatly
decrease from 20 cm in the 1960s to 10 cm in the 2000s; a
simpler age structure found in the Small Yellow Croaker popu-
lation was also attributed to overfishing (Johannessen et al. 2001;
Zhang et al. 2010a; Shan et al. 2011). Maturation patterns were
seriously affected by continuous high fishing intensity, possi-
bly leading to reversible changes in the age and length at 50%
maturity (Ernande et al. 2004; Li 2011). The fishing-induced
74 SHAN ET AL.
FIGURE 6. Correlation of (D) fish catch (kg/h) in the Yellow River estuary and (A) the Southern Oscillation Index (SOI), (B) monthly sea surface temperature
(SST) anomalies, (C) warm and cold SST phases, (E) annual basinwide precipitation (mm/year) in the Yellow River drainage basin, and (F) annual water discharge
(pink line; 10
9
m
3
/year) and annual sediment flux (deep-blue line;10
9
metric tons/year) at Lijin during 1950–2011 (green bars show the years of construction for
main dams on the Yellow River).
change in the ecosystem by selectively harvesting immature
fish or only mature fish in populations has been characterized
(Engelhard et al. 2004). Overfishing can lead to a decrease in
stock abundance (Chen and Mello 1999); can affect population
parameters, including growth rate, size (Hutchings and Baum
2005; de Roos et al. 2006), reproductive age, and age structure
(Rochet 1998; Bianchi et al. 2000); and can cause variations in
genetic structure (de Roos et al. 2006). This signals significant
changes in the structure and function of the ecosystem.
Climate change.—There is considerable evidence that
pelagic species naturally dominate global ecosystems and that
the large fluctuations in small pelagic species are driven by
climate change rather than fishing (Rijnsdorp et al. 2009; Al-
heit and Bakun 2010). In recent years, the fishery catch from
the Bohai Sea was approximately 1.3 million metric tons, in-
cluding 0.5 million metric tons from the Yellow River estu-
ary. The dominant species in the catch were mainly warmwater
and warm-temperate pelagic species, and the fishery abundance
CHANGES IN FISH ASSEMBLAGE STRUCTURE 75
increased during warm periods or 1–2 years after a warm period
(Figure 6A–E). Recent studies have revealed that regime shifts,
decadal-scale variability in atmospheric and oceanic environ-
ments, or a combination of these strongly influence the dynam-
ics of fish stocks and ecosystems (Stige et al. 2006; Perry et al.
2010), particularly for pelagic species. In addition, long-term
variability in the abundance of larval fish is strongly affected by
climate; there was an 85% increase in larval abundance from the
cold period to the warm period, and 71% had a significant rela-
tionship with environmental signals (Tian et al. 2004). Growing
evidence suggests that the dynamics of the demersal fish com-
munity are linked with climate variability (Attrill and Power
2002; Tian et al. 2004). In the present study, an understanding
of the link between fishery species and climate change includes
(1) changes in distribution due to the changes in SST (Perry
et al. 2010; Dulvy et al. 2008; Brander 2010); (2) changes in the
trophic structure via changes in primary and secondary produc-
tion (Salen-Picard et al. 2002); (3) changes in stock abundance,
such as recruitment, growth, survival, reproduction, and migra-
tion behavior (Reist et al. 2006; P
¨
ortner et al. 2007; Li 2011);
and (4) changes in the diversity of the fish community (Butchart
et al. 2010; Powers et al. 2010). Previous studies have shown that
the spawning, recruitment, and distribution of fish were closely
related to climatic indices, such as the North Atlantic Oscillation
and ENSO (Alheit et al. 2005; Rojas-Mendez et al. 2008). The
growth of zooplankton and phytoplankton also changed with the
increase in SST and further affected the predator–prey relation-
ship. For example, changes in SST caused a mismatch between
the fish spawning period and the algal bloom in spring, leading
to starvation of the larvae and juveniles and further impacting
the fish community structure, distribution, and abundance (Fan
et al. 2001). Such changes in turn lead to changes in the ma-
rine ecosystem (Reid et al. 2001; Beaugrand et al. 2004). For
example, distribution of the Skipjack Tuna Katsuwonus pelamis
increased with the expansion of the ENSO warm pool, and the
Skipjack Tuna fishing grounds extended to 6,000 km along the
equator (Lehodey et al. 1997); furthermore, distribution areas of
the Peruvian Anchovy Engraulis ringens extended to southern
Peru, and their abundance decreased during the ENSO period.
The abundance of other pelagic species (e.g., Pacific Sardine
Sardinops sagax, Chilean Jack Mackerel Trachurus murphyi
[also known as Inca Scad], Chub Mackerel Scomber japonicus,
and Longnose Anchovy Anchoa nasus) increased during and af-
ter the ENSO period, and the Shannon–Weaver diversity index
increased from 0.87 to 1.23–1.70 during the ENSO period in
1997–1998 (
˜
Niquen and Bouchon 2004). The dynamics of Pa-
cific Herring Clupea pallasii corresponded to the 36-year wet–
dry period and 36 years of atmospheric circulation (Tang 1981).
Other threats.—The recent trend in Asia has been toward
more and larger dams. Through 2006, a total of 2,752 dams
or reservoirs were built in the Yellow River basin; collectively,
these reservoirs hold more than 77,500 million m
3
, including
22 mid-size and large reservoirs that hold more than 68,200
million m
3
and thus account for 88% of the total water stor-
age. The Sanmenxia, Liujiaxia, Longyangxia, and Xiaolangdi
dams were constructed in 1960, 1968, 1985, and 1999, respec-
tively, causing declines in sediment flux and runoff into the
sea (Figure 6F); zero flow was observed in the Yellow River
during 1997. The decreases in sediment flux and runoff were
directly responsible for coastal erosion in the Yellow River estu-
ary basin; additionally, degradation of ecological service func-
tion and the frequency of pollution accidents and harmful algal
blooms have increased. Consequently, the marine ecological
environment has been destroyed, which directly threatens bio-
logical reproduction in and ecological security of the inshore
ecosystem (Tang et al. 2010). With the decrease in runoff from
the Yellow River, the diversity, abundance, and recruitment of
fishery species in the Bohai Sea decreased, particularly for the
fleshy prawn Fenneropenaeus chinensis. Changes in sediment
flux into the sea caused alterations in the Yellow River estuary
coastline, thereby changing the circulation fields in the coastal
waters. These changes further impacted the distribution of fleshy
prawn eggs and juveniles, eventually leading to the loss of fleshy
prawn eggs and juvenile habitat in Laizhou Bay (Huang and Su
2002). In addition, some studies have reported that the changes
in Yellow River runoff were related to climate changes in the
basin. Precipitation accounted for 40–50% of the changes in
Yellow River runoff (Wang et al. 2006). Based on an analysis of
runoff, water consumption, and precipitation at the main hydro-
logical stations from 1950 to 2005, Wang et al. (2006) reported
that the global ENSO occurrence directly affected basinwide
precipitation and accounted for 51% of the changes in Yellow
River runoff, whereas dam construction accounted for 49%.
Land reclamation, eutrophication, pollution, and aquaculture
in the coastal waters are also serious problems in the Yellow
River estuary, as they contribute to the decline in fish biodiver-
sity and the changes in fish assemblage structure. The effects
of these anthropogenic factors on fish assemblage structure in
the Yellow River estuary have been discussed in detail by other
authors (Zhao et al. 2000; Cui et al. 2005; Li 2011). Land recla-
mation, eutrophication, pollution, and aquaculture in coastal wa-
ters have destroyed the spawning grounds and habitats of many
species and have affected fish migration by causing changes
in hydrological characteristics, leading to declines in fishery
resources.
Conclusions
Fish assemblage structure and fish diversity in the Yellow
River estuary ecosystem have changed, and the estuary is at
risk for being significantly compromised by overfishing, cli-
mate change, dam construction, and pollution. These problems
are causing the decline of traditional fishing industries and a
reduction in biodiversity in the Yellow River estuary. Currently,
certain traditional commercially targeted fishes (e.g., Large-
head Hairtail, Red Seabream, and Pacific Herring) are locally
extinct, and the dominant species have rapidly shifted from
highly valued, high-trophic-level, large-sized demersal species
with complicated age structures to low-value, low-trophic-level,
76 SHAN ET AL.
small-sized pelagic species with simple age structures, result-
ing in major disruption of the ecological cycle and hindering the
restoration of fishery resources.
ACKNOWLEDGMENTS
This work was supported by the National Key Basic Re-
search of the Ministry of Science and Technology of China
(Grant Number 2010CB951204), the Special Fund for Agro-
Scientific Research in the Public Interest (Grant Number
200903005), the Promotive Research Fund for Excellent Young
and Middle-aged Scientists of Shandong Province (Grant Num-
ber BS2012HZ030), and the Taishan Scholar Program of Shan-
dong Province.
REFERENCES
Alheit, J., and A. Bakun. 2010. Population synchronies within and between
ocean basins: apparent teleconnections and implications as to physical–
biological linkage mechanisms. Journal of Marine Systems 79:267–285.
Alheit, J., C. M
¨
ollmann, J. Dutz, G. Kornilovs, P. Loewe, V. Mohrholz, and N.
Wasmund. 2005. Synchronous ecological regime shifts in the central Baltic
and the North Sea in the late 1980s. ICES Journal of Marine Science 62:1205–
1215.
Attrill, M. J., and M. Power. 2002. Climatic influence on a marine fish assem-
blage. Nature 417:275–278.
Beamish, R. J., G. A. McFarlane, and J. R. King. 2000. Fisheries climatol-
ogy: understanding decadal scale processes that naturally regulate British
Columbia fish populations. Pages 94–139 in P. J. Harrison and T. R. Parsons,
editors. Fisheries oceanography: an integrative approach to fisheries ecology
and management. Blackwell Science, London.
Beaugrand, G. 2004. The North Sea regime shift: evidence, causes, mechanisms
and consequences. Progress in Oceanography 60:245–262.
Bellwood, D. R., T. P. Hughes, C. Folke, and M. Nystr
¨
om. 2004. Confronting
the coral reef crisis. Nature 429:827–833.
Bianchi, G., H. Gislason, K. Graham, L. Hill, X. Jin, K. Koranteng, S.
Manickchand-Heileman, I. Pay
´
a, K. Sainsbury, F. Sanchez, and K. Zwanen-
burg. 2000. Impact of fishing on size composition and diversity of demersal
fish communities. ICES Journal of Marine Science 57:558–571.
Brander, K. 2010. Impacts of climate change on fisheries. Journal of Marine
Systems 79:389–402.
Butchart, S. H. M., M. Walpole, B. Collen, A. van Strien, J. P. W. Scharle-
mann, R. E. A. Almond, J. E. M. Baillie, B. Bomhard, C. Brown, J. Bruno,
K. E. Carpenter, G. M. Carr, J. Chanson, A. M. Chenery, J. Csirke, N. C.
Davidson, F. Dentener, M. Foster, A. Galli, J. N. Galloway, P. Genovesi, R.
D. Gregory, M. Hockings, V. Kapos, J. F. Lamarque, F. Leverington, J. Loh,
M. A. McGeoch, L. McRae, A. Minasyan, M. Hern
´
andez Morcillo, T. E. E.
Oldfield, D. Pauly, S. Quader, C. Revenga, J. R. Sauer, B. Skolnik, D. Spear,
D. Stanwell-Smith, S. N. Stuart, A. Symes, M. Tierney, T. D. Tyrrell, J. C.
Vi
´
e, and R. Watson. 2010. Global biodiversity: indicators of recent declines.
Science 328:1164–1168.
Chen, Y., and L. G. S. Mello. 1999. Growth and maturation of cod (Gadus
morhua) of different year classes in the northwest Atlantic, NAFO subdivision
3Ps. Fisheries Research 42:87–101.
Clarke, K. R., and R. M. Warwick. 2001. Change in marine communities: an
approach to statistical analysis and interpretation, 2nd edition. PRIMER-E,
Plymouth, UK.
Cui, Y., B. J. Chen, and J. F. Chen. 2005. [Evaluation on self-pollution of marine
culture in the Yellow Sea and Bohai Sea]. Chinese Journal of Applied Ecology
16:180–185. (In Chinese.)
Cury, P., A. Bakun, R. J. M. Crawford, A. Jarre, R. A. Qui
˜
nones, L. J. Shannon,
and H. M. Verheye. 2000. Small pelagics in upwelling systems: patterns of
interaction and structural changes in “wasp-waist” ecosystems. ICES Journal
of Marine Science 57:603–618.
de Roos, A. M., D. S. Boukal, and L. Persson. 2006. Evolutionary regime shifts
in age and size at maturation of exploited fish stocks. Proceedings of the
Royal Society of London B 273:1873–1880.
Dulvy, N. K., S. I. Rogers, S. Jennings, V. Stelzenm
¨
uller, S. R. Dye, and
H. R. Skjoldal. 2008. Climate change and deepening of the North Sea fish
assemblage: a biotic indicator of warming seas. Journal of Applied Ecology
45:1029–1039.
Edgar, G. J., C. R. Samson, and N. S. Barrett. 2005. Species extinction in the
marine environment: Tasmania as a regional example of overlooked losses in
biodiversity. Conservation Biology 19:1294–1300.
Elliott, M., and D. S. McLusky. 2002. The need for definitions in understanding
estuaries. Estuarine, Coastal and Shelf Science 55:815–827.
Elliott, M., A. K. Whitfield, I. C. Potter, S. J. M. Blaber, D. P. Cyrus, F. G.
Nordlie, and T. D. Harrison. 2007. The guild approach to categorizing estu-
arine fish assemblages: a global review. Fish and Fisheries 8:241–268.
Engelhard, G. H., and M. Heino. 2004. Maturity changes in Norwegian spring-
spawning herring Clupea harengus: compensatory or evolutionary responses?
Marine Ecology Progress Series 272:245–256.
Ernande, B., U. Dieckmann, and M. Heino. 2004. Adaptive changes in har-
vested populations: plasticity and evolution of age and size at maturation.
Proceedings of the Royal Society of London B 271:415–423.
Fan, W., Y. H. Cheng, and X. Q. Shen. 2001. Effects of climate changes and
human activities on fishery resources. Journal of Fishery Sciences of China
8:91–94.
Hilborn, R., T. P. Quinn, D. E. Schindler, and D. E. Rogers. 2003. Biocomplexity
and fisheries sustainability. Proceedings of the National Academy of Sciences
of the USA 100:6564–6568.
Huang, D. J., and J. L. Su. 2002. The effects of the Huanghe River Delta on the
circulation and transportation of larvae. Acta Oceanologica Sinica 24:104–
111.
Hutchings, J. A., and J. K. Baum. 2005. Measuring marine fish biodiversity:
temporal changes in abundance, life history, and demography. Philosophical
Transactions of the Royal Society of London B 360:315–338.
Jackson, D. A., P. R. Peres-Neto, and J. D. Olden. 2001. What controls who is
where in freshwater fish communities—the roles of biotic, abiotic, and spatial
factors. Canadian Journal of Fisheries and Aquatic Sciences 58:157–170.
James, N. C., A. K. Whitfield, and P. D. Cowley. 2008. Long-term stability of
the fish assemblages in a warm-temperate South African estuary. Estuarine,
Coastal and Shelf Science 76:723–738.
Jennings, S., and J. L. Blanchard. 2004. Fish abundance with no fishing: predic-
tions based on macroecological theory. Journal of Animal Ecology 73:632–
642.
Jiang, Y. Z. 2008. Variations in fish community structure and biodiversity in
the northern East China Sea. Master’s thesis. Chinese Academy of Sciences,
Beijing.
Jin, X. S., and J. Y. Deng. 2000. Variations in community structure of fishery re-
sources and biodiversity in the Laizhou Bay, Shandong. Biodiversity Science
8:65–72.
Jin, X. S., X. J. Shan, X. S. Li, J. Wang, Y. Cui, and T. Zuo. 2013. Long-term
changes in the fishery ecosystem structure of Laizhou Bay, China. Science
China Earth Sciences 56:366–374. DOI: 10.1007/s11430-012-4528-7.
Jin, X. S., and Q. S. Tang. 1998. Fishery resource structure, quantity distribution
and their dynamics in the Bohai Sea. Journal of Fishery Sciences of China
5:18–24.
Jin, X. S., B. Zhang, and Y. Xue. 2010. The response of the diets of four carniv-
orous fishes to variations in the Yellow Sea ecosystem. Deep-Sea Research,
Part II 57:996–1000.
Johannessen, A., S. A. Iversen, X. Jin, F. Li, and X. Zhao. 2001. Biological
investigations of anchovy and some selected fish species caught during the
R/V “Bei Dou” surveys 1984–1999. Marine Fisheries Research 22:45–56.
Lande, R. 1996. Statistics and partitioning of species diversity, and similarity
among multiple communities. Oikos 76:5–13.
CHANGES IN FISH ASSEMBLAGE STRUCTURE 77
Lehodey, P., M. Bertignac, J. Hampton, A. Lewis, and J. Picaut. 1997. El Ni
˜
no
southern oscillation and tuna in the western Pacific. Nature 389:715–718.
Li, Z. L. 2011. Interannual changes in biological characteristics and population
dynamics of small Yellow Croaker Larimichthys polyactis, Pacific Cod Gadus
macrocephalus and Anglerfish Lophius litulon in the Bohai Sea and Yellow
Sea. Doctoral dissertation. Chinese Academy of Science, Beijing.
Liu, Z., H. Wei, and S. N. Jiang. 2003. [Characteristics of seasonal variation of
monthly mean temperature and salinity fields in the Bohai Sea and analysis
of the related dynamics]. Periodical of Ocean University of China 33(1):7–4.
(In Chinese.)
Margalef, D. R. 1958. Information theory in ecology. General System 3:36–71.
Martinho, F., R. Leit
˜
ao, J. M. Neto, H. Cabral, F. Lagard
`
ere, and M. A. Pardal.
2008. Estuarine colonization, population structure and nursery functioning
for 0-group Sea Bass (Dicentrarchus labrax), flounder (Platichthys flesus)
and sole (Solea solea) in a mesotidal temperate estuary. Journal of Applied
Ichthyology 24:229–237.
Martinho, F., R. Leit
˜
ao, J. M. Neto, H. N. Cabral, J. C. Marques, and M. A.
Pardal. 2007. The use of nursery areas by juvenile fish in a temperate estuary,
Portugal. Hydrobiologia 587:281–290.
Micheli, F., and B. S. Halpern. 2005. Low functional redundancy in coastal
marine assemblages. Ecology Letters 8:391–400.
Moser, H. G., R. L. Charter, P. E. Smith, D. A. Ambrose, W. Watson, S. R.
Charter, and E. M. Sandknop. 2001. Distributional atlas of fish larvae and eggs
in the Southern California Bight region: 1951–1998. California Cooperative
Oceanic Fisheries Investigations Atlas 34.
Moser, H. G., R. L. Charter, W. Watson, D. A. Ambrose, J. L. Butler, S. R.
Charter, and E. M. Sandknop. 2000. Abundance and distribution of rockfish
(Sebastes) larvae in the Southern California Bight in relation to environmental
conditions and fishery exploitation. California Cooperative Oceanic Fisheries
Investigations Reports 41:132–147.
Myers, R. A., and B. Worm. 2003. Rapid worldwide depletion of predatory fish
communities. Nature 423:280–283.
Nicolas, D., J. Lobry, O. Le Pape, and P. Bo
¨
et. 2010. Functional diversity in
European estuaries: relating the composition of fish assemblages to the abiotic
environment. Estuarine, Coastal and Shelf Science 88:329–338.
˜
Niquen, M., and M. Bouchon. 2004. Impact of El Ni
˜
no events on pelagic
fisheries in Peruvian waters. Deep-Sea Research, Part II 51:563–574.
Pauly, D., V. Christensen, J. Dalsgaard, R. Froese, and F. Torres Jr. 1998. Fishing
down marine food webs. Science 279:860–863.
Pauly, D., V. Christensen, S. Gu
´
enette, T. J. Pitcher, U. R. Sumaila, C. J. Walters,
R. Watson, and D. Zeller. 2002. Towards sustainability in world fisheries.
Nature 418:689–695.
Perry, R. I., P. Cury, K. Brander, S. Jennings, C. M
¨
ollmann, and B. Planque.
2010. Sensitivity of marine systems to climate and fishing: concepts, issues
and management responses. Journal of Marine Systems 79:427–435.
Pielou, E. C. 1975. Ecological diversity. Wiley, New York.
Piet, G. J., R. van Hal, andS. P. R. Greenstreet. 2009. Modelling the direct impact
of bottom trawling on the North Sea fish community to derive estimates of
fishing mortality for non-target fish species. ICES Journal of Marine Science
66:1985–1998.
Pinnegar, J. K., N. V. C. Polunin, P. Francour, F. Badalamenti, R. Chemello,
M. L. Harmelin-Vivien, B. Hereu, M. Milazzo, M. Zabala, G. D’Anna, and
C. Pipitone. 2000. Trophic cascades in benthic marine ecosystems: lessons
for fisheries and protected-area management. Environmental Conservation
27:179–200.
P
¨
ortner, H. O., and R. Knust. 2007. Climate change affects marine fishes through
the oxygen limitation of thermal tolerance. Science 315:95–97.
Powers, J. E. 2010. Fisheries: measuring biodiversity in marine ecosystems.
Nature 468:385–386.
Purcell, K. M., P. L. Klerks, and P. L. Leberg. 2010. Adaptation to sea level rise:
does local adaptation influence the demography of coastal fish populations?
Journal of Fish Biology 77:1209–1218.
Reid, P. C., M. de Fatima Borges, and E. Svendsen. 2001. A regime shift in
the North Sea circa 1988 linked to changes in the North Sea Horse Mackerel
fishery. Fisheries Research 50:163–171.
Reist, J. D., F. J. Wrona, T. D. Prowse, M. Power, J. B. Dempson, R. J. Beamish,
J. R. King, T. J. Carmichael, and C. D. Sawatzky. 2006. General effects of
climate change on Arctic fishes and fish populations. Ambio 35:370–380.
Rijnsdorp, A. D., M. A. Peck, G. H. Engelhard, C. M
¨
ollmann, and J. K. Pin-
negar. 2009. Resolving the effect of climate change on fish populations. ICES
Journal of Marine Science 66:1570–1583.
Rochet, M. J. 1998. Short-term effects of fishing on life history traits of fishes.
ICES Journal of Marine Science 55:371–391.
Rojas-Mendez, J. A., and C. J. Robinson Mendoza. 2008. Effects of ENSO
1997–1998 on the distribution of small pelagic fish off the west coast of Baja
California. International Journal of Environment and Health 2:45–63.
Salen-Picard, C., A. M. Darnaude, D. Arlhac, and M. L. Harmelin-Vivien. 2002.
Fluctuations of macrobenthic populations: a link between climate-driven river
run-off and sole fishery yields in the Gulf of Lions. Oecologia 133:380–388.
Savenkoff, C., M. ECastonguay, D. Chabot, M. O. Hammill, H. Bourdages, and
L. Morissette. 2007. Changes in the northern Gulf of St. Lawrence ecosystem
estimated by inverse modelling: evidence of a fishery-induced regime shift?
Estuarine, Coastal and Shelf Science 73:711–724.
Selleslagh, J., R. Amara, P. Laffargue, S. Lesourd, M. Lepage, and M. Girardin.
2009. Fish composition and assemblage structure in three eastern English
Channel macrotidal estuaries: a comparison with other French estuaries. Es-
tuarine, Coastal and Shelf Science 81:149–159.
Shan, X. J., Z. L. Li, F. Q. Dai, and X. S. Jin. 2011. Seasonal and annual
variations in biological characteristics of small Yellow Croaker Larimichthys
polyactis in the central and southern Yellow Sea. Progress in Fishery Sciences
32(6):1–8.
Shannon, C. E., and W. Weaver. 1949. The mathematical theory of communi-
cation. University of Illinois Press, Urbana.
Stige, L. C., G. Ottersen, K. Brander, K. S. Chan, and N. C. Stenseth. 2006.
Cod and climate: effect of the North Atlantic oscillation on recruitment in the
North Atlantic. Marine Ecology Progress Series 325:227–241.
Tang, Q. S. 1981. A preliminary study on cause of generation fluctuation of the
Yellow Sea Herring Clupea harengus pallasi. Transactions of Oceanology
and Limnology 2:38–45.
Tang, Q. S., J. L. Su, and J. Zhang. 2010. China GLOBEC II: a case study of
the Yellow Sea and East China Sea ecosystem dynamics. Deep-Sea Research,
Part II 57:993–995.
Tegner, M. J., and P. K. Dayton. 2000. Ecosystem effects of fishing in kelp forest
communities. ICES Journal of Marine Science 57:579–589.
Tian, Y. J., H. Kidokoro, and T. Watanabe. 2006. Long-term changes in the
fish community structure from the Tsushima warm current region of the
Japan/East Sea with an emphasis on the impacts of fishing and climate
regime shift over the last four decades. Progress in Oceanography 68:
217–237.
Tian, Y. J., Y. Ueno, M. Suda, and T. Akamine. 2004. Decadal variability in the
abundance of Pacific Saury and its response to climatic/oceanic regime shifts
in the northwestern subtropical Pacific during the last half century. Journal
of Marine Systems 52:235–257.
Wang, A. Y. 2009. Preliminary study of the ichthyoplankton assemblage struc-
ture in Laizhou Bay in spring and its correlation with environmental factors.
Master’s thesis. Ocean University of China, Qingdao.
Wang, H. J., Z. S. Yang, Y. Saito, J. P. Liu, and X. X. Sun. 2006. Interannual and
seasonal variation of the Huanghe (Yellow River) water discharge over the
past 50 years: connections to impacts from ENSO events and dams. Global
and Planetary Change 50:212–225.
Yang, J. M. 2001. A study on food and trophic levels of Baohai Sea fish. Modern
Fisheries Information 16(10):10–19.
Yasunaka, S., and K. Hanawa. 2002. Regime shifts found in the northern hemi-
sphere SST field. Journal of the Meteorological Society of Japan 80:119–135.
YRCC (Yellow River Conservancy Commission). 1950–2009. Bulletin of
sediments and runoff for the Yellow River, 60 reports. Available:
(April 2013).
Zhang, B. 2005. Preliminary studies on marine food web and trophodynam-
ics in China coastal seas. Doctoral dissertation. Ocean University of China,
Qingdao.
78 SHAN ET AL.
Zhang, B., and Q. S. Tang. 2004. The studies on trophic class of the major
species at high trophic level in the Bohai, the Yellow Sea and the East China
Sea. Advances in Marine Sciences 22:393–404.
Zhang, B., Q. S. Tang, and X. S. Jin. 2007. Functional groups of fish assemblages
and their major species at high trophic level in the East China Sea. Journal of
Fishery Sciences of China 14:939–948.
Zhang, G. Z., X. S. Li, X. S. Jin, J. C. Zhu, and F. Q. Dai. 2010a. Changes of
biological characteristics of small Yellow Croaker (Larimichthys polyactis)
in the central and southern Yellow Sea. Acta Ecologica Sinica 30:6854–6861.
Zhang, X., X. M. Zhang, and T. X. Gao. 2010b. Comparative analysis on catch
composition with two fishing gears at Yellow River estuary in spring. South
China Fisheries Science 6:59–67.
Zhao, Z. Y., and L. H. Kong. 2000. Environmental status quo and protec-
tion countermeasures in Bohai marine areas. Research of Marine Science
13(2):23–27.
Zhuang, P., Y. H. Wang, and S. F. Li. 2006. Fishes of the Yangtze River estuary.
Shanghai Science and Technology Press, Shanghai, China.