Feeding ecology of the sandbar shark in south carolina estuaries revealed through δ13 c and δ15 n stable isotope analysis
Bạn đang xem bản rút gọn của tài liệu. Xem và tải ngay bản đầy đủ của tài liệu tại đây (293.44 KB, 15 trang )
BioOne sees sustainable scholarly publishing as an inherently collaborative enterprise connecting authors, nonprofit publishers, academic institutions, research
libraries, and research funders in the common goal of maximizing access to critical research.
Feeding Ecology of the Sandbar Shark in South Carolina Estuaries Revealed
through δ
13
C and δ
15
N Stable Isotope Analysis
Author(s): David S. ShiffmanBryan S. FrazierJohn R. KucklickDaniel AbelJay BrandesGorka Sancho
Source: Marine and Coastal Fisheries: Dynamics, Management, and Ecosystem Science, 6():156-169.
2014.
Published By: American Fisheries Society
URL: />BioOne (www.bioone.org) is a nonprofit, online aggregation of core research in the biological, ecological, and
environmental sciences. BioOne provides a sustainable online platform for over 170 journals and books published
by nonprofit societies, associations, museums, institutions, and presses.
Your use of this PDF, the BioOne Web site, and all posted and associated content indicates your acceptance of
BioOne’s Terms of Use, available at www.bioone.org/page/terms_of_use.
Usage of BioOne content is strictly limited to personal, educational, and non-commercial use. Commercial inquiries
or rights and permissions requests should be directed to the individual publisher as copyright holder.
Marine and Coastal Fisheries: Dynamics, Management, and Ecosystem Science 6:156–169, 2014
C
American Fisheries Society 2014
ISSN: 1942-5120 online
DOI: 10.1080/19425120.2014.920742
ARTICLE
Feeding Ecology of the Sandbar Shark in South Carolina
Estuaries Revealed through ␦
13
Cand␦
15
NStable
Isotope Analysis
David S. Shiffman*
Grice Marine Laboratory, College of Charleston, 205 Fort Johnson Road, Charleston,
South Carolina 29412, USA; and Abess Center for Ecosystem Science and Policy, University of Miami,
1365 Memorial Drive, Coral Gables, Florida 33146, USA
Bryan S. Frazier
South Carolina Department of Natural Resources, 217 Fort Johnson Road, Charleston,
South Carolina 29412, USA
John R. Kucklick
National Institute of Standards and Technology/Hollings Marine Laboratory, 331 Fort Johnson Road,
Charleston, South Carolina 29412, USA
Daniel Abel
Department of Marine Sciences, Coastal Carolina University, Post Office Box 261954, Conway,
South Carolina 29526, USA
Jay Brandes
Skidaway Institute of Oceanography, 10 Ocean Science Circle, Savannah, Georgia 31411, USA
Gorka Sancho
Grice Marine Laboratory, College of Charleston, 205 Fort Johnson Road, Charleston, South Carolina
29412, USA
Abstract
Stable isotope ratios of carbon and nitrogen (δ
13
Candδ
15
N) from muscle samples were used to examine the
feeding ecology of a heavily exploited shark species, the Sandbar Shark Carcharhinus plumbeus. Two hundred and
sixty two Sandbar Sharks were sampled in five South Carolina estuaries. There were no significant differences in
average δ
13
Corδ
15
N signatures between estuaries, between sampling years, or between male and female Sandbar
Sharks, suggesting that these variables do not affect diet. A potential ontogenetic diet shift between young-of-year and
juvenile Sandbar Sharks in South Carolina, similar to a shift previously described in Virginia and Hawaii populations,
is suggested by significant differences in average δ
13
C and average δ
15
N signatures between these age-classes. Results
confirm that Sandbar Sharks in South Carolina are generalist predators and that juvenile Sandbar Sharks have a
wider diet breadth than young-of-year sharks, a pattern common in elasmobranchs. Sandbar Shark diet in South
Carolina is similar to that found in previous stomach content analysis studies. This study also demonstrates that
nonlethal sampling methods can be applied to sharks to obtain diet and trophic information, including the detection
of ontogenetic shifts in diet.
Subject editor: Donald Noakes, Thompson Rivers University, British Columbia, Canada
*Corresponding author:
Received September 17, 2013; accepted April 1, 2014
156
FEEDING ECOLOGY OF THE SANDBAR SHARK IN SOUTH CAROLINA 157
Many species of sharks (subclass Elasmobranchii) are eco-
logically important animals because of their role as predators
in marine environments (Chapman et al. 2006), though decades
of global overfishing have led to reported population declines
in many shark species (Dulvy et al. 2008). The U.S. National
Marine Fisheries Service plans to eventually institute a new
ecosystem-based fishery management plan to improve the man-
agement of U.S. shark species (SEDAR 2006). Ecosystem-based
fisheries management plans differ from traditional fishery man-
agement by focusing not just on a target population but also on
diet, trophic interactions, and environment (Pikitch et al. 2004).
One shark species of particular concern to the National Ma-
rine Fisheries Service is the heavily exploited Sandbar Shark
Carcharhinus plumbeus (SEDAR 2006). Sandbar Sharks, which
are seasonally abundant in South Carolina (Castro 1993; Abel
et al. 2007; Ulrich et al. 2007), have declined in population size
in the western North Atlantic by 60–80%; but populations have
begun to stabilize since 2007 due to catch restrictions (Romine
et al. 2011; SEDAR 2011). Sandbar Sharks are born near the
mouths of shallow estuaries in late May or early June and enter
the estuaries as primary nurseries, remaining there until October
or November (Castro 1993; Ulrich et al. 2007). After overwinter-
ing offshore, young juvenile Sandbar Sharks return to estuaries
the following spring and utilize them as secondary nurseries.
(Conrath and Musick 2008).
The traditional method for characterizing shark diet is stom-
ach content analysis, which has typically involved opening the
shark’s stomach and identifying the prey items found inside
(Cortes 1999). Alternative nonlethal methods, such as gastric
lavage and stomach eversion, have also been utilized (Shur-
dak and Gruber 1989). Stomach content analysis provides high-
resolution “snapshot” diet data (Hyslop 1980; Pinnegar and Pol-
unin 1999), though there are many limitations to the method.
For example, predatory fishes often have a high percentage of
empty stomachs (Arrington et al. 2002), which can result in
having to lethally sample a larger number of specimens in or-
der to accumulate enough prey items to characterize a species’
diet. Additionally, sharks may regurgitate due to capture stress,
which increases the number of animals with empty stomachs
(Stevens 1973).
An alternative method to study elasmobranch diet is stable
isotope analysis (Hussey et al. 2011; Hussey et al. 2012;
Shiffman et al. 2012). This method utilizes the isotopic
signatures of carbon and nitrogen isotopes in tissues to examine
trophic status and other relevant ecological relationships, such
as sources of carbon to the food web (Peterson and Fry 1987).
This technique can provide long-term, temporally integrated
diet estimates compared with stomach content analysis, which
reflects only recently ingested prey (Pinnegar and Polunin
1999). Gathering samples for stable isotope analysis can also
be nonlethal and minimally invasive when restricted to the use
of certain tissues (Sanderson et al. 2009).
This study examines the ratios of carbon (
13
C/
12
C) and ni-
trogen (
15
N/
14
N) stable isotopes in muscle tissue of Sandbar
Sharks in South Carolina’s estuaries. Carbon isotopic ratio lev-
els are commonly slightly enriched relative to a food source,
approximately 0–1‰ relative to a standard with each trophic
level increase, while nitrogen isotopic ratios typically enrich
approximately 3.4‰ per trophic level (Minagawa and Wada
1984; Peterson and Fry 1987). Carbon isotopic ratios are there-
fore useful to differentiate between food web carbon sources
(i.e., benthic versus pelagic, coastal versus offshore) and indi-
cate diet, while nitrogen isotopic ratios can indicate different
trophic levels (Peterson and Fry 1987; Post 2002).
While the values of 3.4‰ and 0–1‰ are typical diet–tissue
discrimination factors, these values can vary significantly by
study species and tissue. A review of diet–tissue discrimination
factors (Caut et al. 2009) found that the mean discrimination fac-
tor for nonelasmobranch fish muscle is approximately 2.5‰ for
nitrogen isotopes and 1.8‰ for carbon isotopes. Recent research
on elasmobranchs has shown that the diet–tissue discrimination
factor values can be slightly different for these fishes, ranging
from 2.4‰ for nitrogen isotopes and 0.9‰ for carbon isotopes
in the muscle of the Sand Tiger Carcharias taurus (Hussey et al.
2010) to 3.7‰ for nitrogen isotopes and 1.7 ‰ for carbon iso-
topes in the muscle of the Leopard Shark Triakis semifasciata
(Kim et al. 2012).
Though Sandbar Shark diet has never been characterized in
South Carolina, stomach content analyses have been conducted
on Sandbar Sharks from the coastal waters of the Hawaiian
Islands (McElroy et al. 2006) and the estuarine and coastal wa-
ters of Virginia (Medved et al. 1985; Ellis and Musick 2007).
These past studies noted an ontogenetic shift in diet in both re-
gions, with young-of-year (age-0) Sandbar Sharks preying pri-
marily on benthic crustaceans, including blue crab Callinectes
sapidus and mantis shrimp Squilla empusa, and older, larger ju-
veniles relying increasingly on small elasmobranchs and teleost
fishes. However, Sandbar Sharks have many allopatric subpopu-
lations (Compagno et al. 2005) and it is unknown if this diet shift
occurs throughout their entire range. Other shark species, such as
the Shortfin Mako Isurus oxyrinchus (Stevens 1984; Cliff et al.
1990; Maia et al. 2006) and the Spiny Dogfish Squalus acanthias
(Ellis et al. 1996; Smith and Link 2010), are known to consume
radically different types of prey in various parts of their range.
Determining whether ontogenetic diet shifts occur is
important to consider when attempting to create effective
ecosystem-based fisheries management plans (Lucifora et al.
2009; Simpfendorfer et al. 2011). Stable isotope analysis
comparing δ
13
C and δ
15
N tissue signatures of individuals of
different age-classes within the same species has been used to
detect ontogenetic diet shifts in animals such as the green sea
turtle Chelonia mydas (Arthur et al. 2008) and Red Snapper
Lutjanus campechanus (Wells et al. 2008), though rarely in wild
populations of sharks. Though detecting an ontogenetic shift
in diet was not the focus of their studies, Matich et al. (2010)
noted a difference in inter-tissue isotopic signature variability
between smaller and larger Bull Sharks Carcharhinus leucas
and Vaudo and Heithaus (2011) noted differences in average
isotopic signatures between different size-classes of three
species of coastal elasmobranchs. Ontogenetic diet shifts in
158 SHIFFMAN ET AL.
sharks have been detected using other analyses of isotopic data
that involved either sacrificing sharks to obtain liver samples
or opportunistically utilizing vertebrae samples from sharks
sacrificed for other studies (MacNeil et al. 2005; Estrada et al.
2006; Hussey et al. 2011; Malpica-Cruz et al. 2013).
Since many shark species are live bearing, the maternal con-
tribution of isotopes to age-0 sharks must be considered when
analyzing isotopic signatures of age-0 specimens (McMeans
et al. 2009; Vaudo et al. 2010; Olin et al. 2011). Maternal in-
vestment results in higher δ
15
N and either higher or lower δ
13
C
values in age-0 sharks relative to mothers (McMeans et al. 2009;
Vaudo et al. 2010). Maternal contribution can also be detected
by analyzing the change in isotopic signature of age-0 sharks
over time as they shift to a dietary-influenced isotopic signa-
ture (Shaw 2013). Additionally, while isotope turnover rates are
generally slow in shark muscle (requiring up to 2 years for com-
plete turnover), significant and ecologically relevant changes
in Sandbar Shark muscle isotopic signature (∼2‰ for
13
C and
∼5‰ for
15
N) are detectable within 2 months of a diet switch
(Logan and Lutcavage 2010). Isotopic turnover rates must also
be considered when analyzing isotopic ratios from species that
undergo seasonal migrations, such as Sandbar Sharks that mi-
grate between estuarine and offshore waters (Castro 1993; Abel
et al. 2007).
The goals of this study were to use δ
13
C and δ
15
N stable
isotope signatures of muscle tissue to characterize the diets and
trophic levels of Sandbar Sharks in South Carolina estuaries and
coastal waters and to determine if there are any ontogenetic, sex-
based, or geographic differences in diet and trophic level. The
South Carolina estuarine systems sampled differ geographically
and ecologically from the more northern habitats of Virginia
(Dame et al. 2000) and the reef-dominated habitats of Hawaii,
where previous stomach content analyses of this species have
been conducted. Isotopic data from sympatric potential prey
species in South Carolina were also analyzed.
METHODS
Sample collection.—Sandbar Shark muscle samples were ob-
tained opportunistically from three coastal shark surveys. Sand-
bar Sharks were captured using longlines by the South Carolina
Department of Natural Resources (SCDNR) Cooperative At-
lantic States Shark Pupping and Nursery survey, the SCDNR
Adult Red Drum Sciaenops ocellatus survey, and the Coastal
Carolina University shark survey. Five South Carolina estuaries
were sampled from May through November in 2009 and 2010:
Winyah Bay, Bulls Bay, Charleston Harbor, St. Helena Sound,
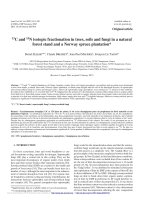
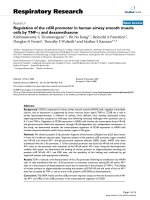
and Port Royal Sound (Figure 1). All Sandbar Sharks captured
were sexed, measured (both fork length [FL] and stretch total
length [TL]), tagged through the dorsal fin with Dalton roto-tags,
and released. Dorsal muscle samples of approximately 2 g were
taken from the captured Sandbar Sharks prior to release using
a 2.0-mm disposable biopsy punch (Premier Medical Products
Unipunch). Muscle samples were kept on ice in 2.0-mL cry-
ovials while in the field and upon return to the laboratory were
frozen at −80
◦
C until processing.
FIGURE 1. Sampling sites in South Carolina estuaries and coastal waters.
The dots represent longline and gillnet survey locations from the SCDNR Co-
operative Atlantic States Shark Pupping and Nursery survey (COASTSPAN),
while the stars represent the longline survey locations from the SCDNR Adult
Red Drum project.
Young of year were defined as Sandbar Sharks less than
1 year old (age 0) and were identified by the presence of
umbilical scarring and a FL less than 580 mm (Ulrich et al.
2007). Juveniles were older than 1 year (>580 mm FL) and had
no umbilical scarring but had not yet reached the reproductively
mature size of approximately 1,400 mm FL (Sminkey and Mu-
sick 1996). Sandbar Sharks over 1,400 mm FL were considered
adults, and since only eight adult sharks were captured during
this study, adults were excluded from most analyses. Samples of
co-occurring possible prey species in South Carolina estuarine
waters, including a variety of invertebrate and fish species,
were obtained opportunistically from SCDNR inshore fisheries
surveys. Whenever possible, samples of each prey species were
obtained from multiple estuaries, but individuals from different
estuaries were grouped together for analysis.
Sample processing.—Residual skin, shell, or scales were re-
moved from biopsy samples (Sandbar Sharks and co-occurring
possible prey were analyzed to elucidate Sandbar Shark diet)
using a scalpel so that only muscle tissue was analyzed (follow-
ing Davenport and Bax 2002). Preliminary analysis was per-
formed to determine whether urea removal and lipid removal
were needed. This consisted of processing multiple samples
from the same individual shark in four different ways (no lipid
removal and no urea removal, urea removal and no lipid removal,
lipid removal and no urea removal, and removal of both lipids
and urea) and comparing results. This process was repeated for
samples from 10 individual sharks.
To remove urea, all elasmobranch muscle tissue (Sandbar
Sharks as well as rays and sharks analyzed as potential prey
species) were sonicated three times in 1.0 mL of deionized
water for 15 min, decanting the water in between each sonication
(Kim and Koch 2011). Preliminary analysis indicated that urea
removal lowered δ
15
N signatures in elasmobranch muscle by
FEEDING ECOLOGY OF THE SANDBAR SHARK IN SOUTH CAROLINA 159
an average of 0.5‰ and therefore urea removal was performed
on all elasmobranch muscle tissue (Sandbar Sharks and co-
occurring potential prey species) analyzed in this study.
Lipid extraction is occasionally performed on muscle tissues
(MacNeil et al. 2005), but preliminary trials indicated that this
method had no effect on the δ
13
C signatures of shark muscle
(δ
13
C signatures of the samples analyzed in the preliminary tri-
als were extremely similar and considered equal between lipid
extraction and nonlipid extraction processing methods). Addi-
tionally, C:N ratios were low for Sandbar Sharks (approximately
1.2), suggesting low lipid content (Post et al. 2007). Therefore
lipid extraction was not utilized on elasmobranch samples in
this study. Lipid extraction was, however, utilized on all mus-
cle samples from nonelasmobranch co-occurring potential prey
species. One milliliter of dichloromethane was added to each
sample tube containing nonelasmobranch muscle tissue, tubes
were placed in an ultrasonic water bath for 15 min, and the
dichloromethane was then decanted, repeating the process a to-
tal of three times (John Kucklick, National Institutes of Science
and Technology, personal communication).
All samples were then lyophilized (SP Scientific Virtis Gen-
esis) overnight and homogenized into a fine powder using a
Biospec mini bead-beater 8 with 1.0-mm beads. Aliquots of
these powdered samples (1 mg) were measured, placed into
tin capsules, and analyzed using a Thermo Flash EA cou-
pled to a ThermoFisher Scientific Delta V Plus Isotope-ratio
mass spectrometer located at the isotope laboratory at the Ski-
daway Institute of Oceanography (Savannah, Georgia), which
has a precision of ±0.1 for both carbon and nitrogen isotopes.
Sample stable isotope values were calibrated against internally
calibrated laboratory chitin powder standards (−0.90‰
15
N,–
18.95‰
13
C), which are cross-checked against the U.S. Geo-
logical Survey 40 international isotope standard and National
Institute of Standards and Technology Standard Reference Ma-
terial 8542 ANU-Sucrose.
Statistical analysis.—Stable isotope ratios were expressed
in parts per thousand (‰), a ratio of the isotopes in a sample
relative to a reference standard. Delta notation (δ) is defined
using the following equation:
δX =
R
sam
R
sta
− 1
· 1,000‰,
where X is defined as the heavy isotope, either
13
Cor
15
N, R
sam
is the ratio of heavy to light isotopes within each sample, and
R
sta
is the heavy to light ratio in a reference standard.
Isotopic data (δ
13
C and δ
15
N) from each muscle sample were
analyzed by sampling month, sampling year, sex, location (es-
tuary), and age-class. Differences in δ
13
C and δ
15
N between
sampling months, sampling years, sexes, estuaries, and age-
classes were assessed by multiple-factor analysis of variance
(ANOVA). First, all Sandbar Sharks were compared. Second,
in order to avoid maternal input bias in age-0 sharks (Olin
et al. 2011) and recent offshore feeding bias in migrating ju-
venile sharks, only samples collected after July 15th (approxi-
mately 2 months after juvenile Sandbar Sharks typically reenter
the estuary and most young of year have been born, Ulrich
et al. 2007) were compared. This was considered to be enough
time for the Sandbar Sharks’ slow muscle isotopic turnover rate
(Logan and Lutcavage 2010) to reflect evidence of an estuar-
ine diet-influenced isotope signature, though likely not enough
time to allow for full isotopic equilibrium to the estuarine en-
vironment. Sandbar Sharks captured after July 15 are referred
to as “summer–fall” sharks hereon. Finally, to account for the
unbalanced sample design, multiple ANOVAs were performed
focusing on each variable to avoid interaction effects (i.e., al-
most all age-0 sharks were captured in just two estuaries, com-
plicating analysis by estuary, and certain estuaries were sampled
more in certain months, complicating analysis by month). Tests
were run for both the complete set of all Sandbar Sharks and
for summer–fall sharks only, and a Holm correction was used
on the resulting P-values to reduce the chance of type I error.
We hypothesized significant differences in both δ
13
C and δ
15
N
between age-classes, which would indicate an ontogenetic diet
shift, but did not expect differences between sampling years,
sampling months, or sampling locations. Statistical calculations
throughout the study were performed using R (R Development
Core Team 2010).
Metrics for comparison of isotope ratios between age-classes
followed methods by Layman et al. (2007a). Metrics include
δ
15
N range and δ
13
C range (the difference between the largest
and smallest δ
15
N and δ
13
C values within each age-class), and
total occupied niche area (the convex hull area of the polygon
represented by all of the δ
13
Corδ
15
N data for each age-class).
Unlike raw isotopic data, these values are suitable for compar-
isons between species from different habitats.
The relative trophic position of Sandbar Sharks was calcu-
lated using Post’s (2002) formula. The species used to estimate
δ
15
N
base
was Summer Flounder Paralichthys dentatus, a sec-
ondary consumer that was assigned a trophic level of 3.0. A
value of 3.7 was used for the initial value of
15
N, the increase
in the ratio of
15
N associated with one increasing trophic level,
following Kim et al. (2012). Trophic position calculation re-
quires appropriately selected diet–tissue discrimination factors.
The primary diet–tissue discrimination factor utilized comes
from Kim et al. (2012), to date the only discrimination factors
calculated for elasmobranchs using completely controlled feed-
ing conditions. For the purpose of testing sensitivity, trophic
position calculations were also run with diet–tissue discrimi-
nation factors from Hussey et al. (2010), a “semicontrolled”
feeding study, and the mean values for nonelasmobranch fishes
from Caut et al. (2009).
Current stable isotopic analytical techniques do not allow
for the precise determination of the specific prey species con-
sumed by generalist predators. Though several advanced statis-
tical mixing models exist, many have very precise data require-
ments that were not met by this study due to the opportunistic
sampling regime (samples were provided by the SCDNR inshore
160 SHIFFMAN ET AL.
TABLE 1. Biological and demographic data for all Sandbar Sharks sampled (total) and those from summer–fall (SF) months.
Location, sex,
and length Total age-0 Total juvenile Total adult SF age-0 SF juvenile SF adult
Winyah Bay 1 64 6 1 63 4
Bulls Bay 27 34 0 19 13 0
Charleston Harbor 0 38 0 0 28 0
Port Royal Sound 0 12 1 0 12 1
St. Helena Sound 49 29 1 38 24 1
All estuaries 77 180 8 58 140 6
Males 43 69 2 31 53 2
Females 34 111 6 27 89 4
Minimum TL (mm) 550 715 1,684 561 715 1,684
Mean TL (mm) 645 1,113 1,785 647 1,175 1,738
Maximum TL (mm) 713 1,681 2,000 713 1,681 1,800
fisheries survey whenever possible, and samples obtained did
not include primary producers). The sample size of many prey
species was insufficient to infer diet with accuracy using many
mixing models, and baseline data (i.e., primary producer car-
bon signature) was unavailable. Multiple samples of each prey
species were averaged together with the assumption that speci-
mens from different estuaries had similar isotopic signatures.
RESULTS
A total of 262 Sandbar Sharks were sampled in South
Carolina waters for this study, including 177 juveniles, 77 young
of year, and 8 adults (Table 1). All but one young of year were
captured in Bulls Bay and St. Helena Sound, while juveniles
were captured in all sampled estuaries (Table 1). The δ
15
Nsig-
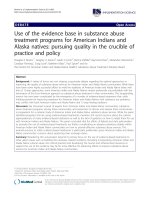
natures of age-0 Sandbar Sharks were significantly lower in
summer–fall than in spring (Figure 2; Table 2) and did not de-
crease any further within the course of this study, validating the
choice of sampling approximately 2 months after most young
of year are born (a July 15th cutoff) for reducing maternal con-
tribution bias to age-0 Sandbar Sharks.
Initial multifactor ANOVA analysis of summer–fall Sandbar
Sharks (Table A.1 in the appendix) indicated significant dif-
ferences in δ
15
N between estuaries (F = 8.6, P < 0.001) and
no significant differences between age-classes (F = 2.01, P =
0.15). Analysis of summer–fall Sandbar Sharks indicated sig-
nificant differences in δ
13
C between age-classes (F = 8.2, P =
0.005), estuaries (F = 12.9, P < 0.005), month (F = 8.4, P <
0.005), and year (F = 19.35, P < 0.005).
To account for the unbalanced sampling design (i.e., uneven
numbers of young of year between estuaries, unequal sampling
of different estuaries in different months), each variable’s effect
on δ
15
N and δ
13
C was also analyzed with individual ANOVAs
(Table A.2 in the appendix). When only young of year (n =
53) and juveniles (n = 140) captured after July 15 (summer–
fall) were analyzed separately to minimize potential maternal
input or offshore feeding signals (Olin et al. 2011), ANOVA
results indicated no significant differences for δ
15
Norδ
13
Csig-
natures between years (Table A.2 in the appendix). When only
summer–fall juveniles or only summer–fall young of year were
compared between estuaries, there were no significant differ-
ences in δ
13
Corδ
15
N between estuaries (Table A.2 in the ap-
pendix). The significant differences between estuaries appear
to have been driven not by real isotopic differences between
different estuaries, but by unequal catch rates of young of year
between estuaries (Table 1), providing additional support to our
decision to utilize multiple individual ANOVAs to analyze this
dataset.
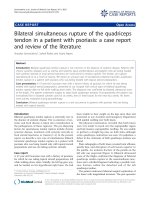
When all summer–fall Sandbar Sharks were pooled together
from both years and all estuaries, δ
15
N and δ
13
C varied signif-
icantly between young of year and juveniles (Figure 3), with
higher δ
15
N values (F = 6.4, P = 0.048) and more negative
FIGURE 2. Box plot of mean δ
15
N signature of age-0 Sandbar Sharks by
capture month. The black squares represent the means, the box dimensions
represent the 25th–75th percentile ranges, and the whiskers show the 10th–
90th percentile ranges. Boxes labeled with the same letter are not significantly
different.
FEEDING ECOLOGY OF THE SANDBAR SHARK IN SOUTH CAROLINA 161
TABLE 2. Carbon and nitrogen stable isotopic signatures for Sandbar Shark muscle tissue from each life history stage. Values from all Sandbar Sharks, those
collected before July 15th (spring), and those collected after July 15th (summer–fall) are shown.
δ
13
C(‰) δ
15
N(‰)
Category N Mean Range SD Mean Range SD
All sharks
Age-0 77 −17.5 −16.0 to −19.0 0.56 14.8 12.6 to 16.7 0.85
Juvenile 180 −18.5 −15.8 to −20.4 0.85 14.6 12.0 to 16.6 0.79
Adult 8 −18.1 −17.4 to −19.8 0.75 14.8 13.9 to 15.9 0.76
Summer–fall sharks
Age-0 53 −17.4 −16.0 to −19.0 0.60 14.5 12.6 to 16.5 0.89
Juvenile 140 −18.5 −16.2 to −20.3 0.83 14.8 12.0 to 16.6 0.81
Adult 6 −18.2 −17.4 to −19.8 0.83 14.8 13.9 to 15.9 0.89
Spring sharks
Age-0 22 −17.4 −16.6 to −18.2 0.60 14.6 13.4 to 16.1 0.87
Juvenile 40 −18.7 −17.2 to −20.4 0.76 14.5 12.4 to 16.0 0.77
Adult 2 −17.7 −17.5 to −17.8 0.13 14.9 14.8 to 15.0 0.08
δ
13
C values (F = 62.9, P < 0.001) in juveniles than in young
of year (Table A.2 in the appendix). Adults were excluded from
this analysis due to low sample size.
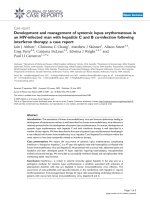
Juveniles had a larger δ
15
N range (4.5 versus 4.0), δ
13
C range
(4.1 versus 3.0), and total occupied niche area (14.1 versus
7.1) than young of year (Figure 4). Layman metrics of δ
15
N
range, δ
13
C range, and total occupied niche area were very
similar when comparing these metrics calculated for all Sand-
bar Sharks with those calculated for only summer–fall Sandbar
Sharks (nearly all of the outer points of the convex hull were
summer–fall sharks), and the results presented here represent
all Sandbar Sharks. Adults were excluded from Layman metric
analysis due to small sample size. Regression analysis showed
statistically significant effects of total length on both δ
13
C ratio
FIGURE 3. Mean δ
15
Nandδ
13
C values (error bars are ± 1 SE) of summer–fall
Sandbar Sharks.
(T = 4.18, P < 0.0005) and δ
15
N ratio (T = 3.6, P < 0.0005)
(Figure 5).
When using diet–tissue discrimination factors from Kim et al.
(2012), age-0 Sandbar Sharks in South Carolina were assigned a
trophic position of 3.8, while juveniles and adults were assigned
a trophic position of 3.9 using the formula from Post (2002).
The use of discrimination factors from Caut et al. (2009) re-
sulted in trophic positions of 4.1 for young of year and 4.3 for
juveniles and adults, and the use of discrimination factors from
Hussey et al. (2010) resulted in trophic position calculations of
FIGURE 4. Values of δ
15
Nandδ
13
C from individual muscle samples of all
Sandbar Sharks. Polygons represent the total occupied niche area (and overlap)
of all age-0 and juvenile Sandbar Sharks.
162 SHIFFMAN ET AL.
FIGURE 5. Regression of δ
15
N (top panel) and δ
13
C (bottom panel) by stretch
total length for summer–fall Sandbar Sharks.
4.2 for young of year and 4.3 for juveniles and adults. No differ-
ence in trophic position was found between using all Sandbar
Sharks and only summer–fall Sandbar Sharks, so all samples
were pooled for trophic analysis.
The potential prey samples collected included 146 specimens
of 21 species (Table 3). All specimens of a single species were
pooled for prey analysis to generate mean isotopic values for
that species (Table 3). Benthic invertebrates identified as being
important to the diet of age-0 Sandbar Sharks and squid Loligo
sp. identified as being important to the diet of juveniles in Vir-
ginia by Ellis and Musick (2007) are approximately one trophic
level (using diet–tissue discrimination factors from Kim et al.
FIGURE 6. Mean isotopic values of age-0 and juvenile Sandbar Sharks and
co-occurring potential prey species. The squares represent Sandbar Sharks (CPJ
are juveniles, CPY are young of year), circles represent invertebrates, trian-
gles represent elasmobranchs, and pluses represent teleost fishes. See Table 3
for species abbreviations. Filled arrows indicate species identified as being an
important part of the diet of age-0 Sandbar Sharks by Ellis and Musick 2007,
empty arrows indicate important prey species for juveniles identified by Ellis
and Musick 2007, and crosshatched arrows indicate prey species identified as
being important by Medved et al. 1985 (which did not distinguish by age-class).
2012) below age-0 Sandbar Sharks, suggesting that diets are
similar between the regions (Figure 6).
DISCUSSION
Our results suggest the presence of an ontogenetic diet shift
between age-0 and juvenile Sandbar Sharks in South Carolina
estuarine waters, indicated by differences in average δ
15
N and
δ
13
C signatures between these two age-classes. This ontoge-
netic diet shift is consistent with young of year feeding mainly
on small benthic animals (crustaceans such as mantis shrimp
and blue crab, elasmobranchs such as Atlantic Stingray, and
teleosts such as Summer Flounder) during the first year of life
and expanding their diets to include additional pelagic animals
(teleosts such as Atlantic Menhaden and invertebrates such as
squid Loligo spp.) during the juvenile years. This diet shift, from
mostly benthic invertebrates to mostly pelagic teleosts, has been
previously described from stomach content analyses of Sandbar
Sharks in Hawaii (McElroy et al. 2006) and Virginia (Ellis and
Musick 2007). Caution should be utilized interpreting these data
due to concerns about maternal contribution influencing the age-
0 values and offshore feeding influencing the juvenile values,
since the time for complete tissue isotopic turnover (Kim et al.
2012) exceeded the 2 months allowed by this study. However,
the many similarities between our conclusions and previous
stomach-content-based Sandbar Shark diet analysis, including
evidence of an ontogenetic diet shift from benthic invertebrates
to pelagic teleosts, give us confidence in the robustness of our
results.
FEEDING ECOLOGY OF THE SANDBAR SHARK IN SOUTH CAROLINA 163
TABLE 3. Carbon and nitrogen stable isotopic signatures of all South Carolina potential prey samples. Blue crab size is carapace width, and ray size is disc
width. All other sizes are total length.
Average δ
13
C(‰) δ
15
N(‰)
Species size
Species code (cm) N Mean Range SD Mean Range SD
Rays
Atlantic Stingray Dasyatis
sabina
DS ∼30 1 −18.8 10.8
Cownose Ray Rhinoptera
bonasus
RB ∼75 5 −19.9 −19.7 to −20.3 0.25 12.1 11.6 to 12.3 0.38
Smooth Butterfly Ray Gymnura
micrura
GM ∼30 3 −17.9 −16.7 to −19.6 1.53 12.8 12.2 to 13.6 0.69
Teleosts
Striped Anchovy Anchoa
hepsetus
AH 6.4 6 −20.5 −19.7 to −21.5 0.63 12.8 11.7 to 13.0 0.50
Bluefish Pomatomus saltatrix PS ∼20 4 −18.5 −17.7 to −19.8 0.98 15.8 14.8 to 16.5 0.72
Summer Flounder Paralichthys
dentatus
PD 10.1 10 −19.3 −17.6 to −22.2 1.52 11.7 9.6 to 12.7 0.82
Ladyfish Elops saurus ES 15 1 −18.0 12.6
Atlantic Menhaden Brevoortia
tyrannus
BT ∼15 11 −21.0 −19.2 to −22.7 1.24 10.5 9.3 to 11.6 0.75
Striped Mullet Mugil cephalus MC ∼25 5 −15.3 −12.9 to −16.7 1.57 8.7 6.8 to 9.4 1.15
Red Drum Sciaenops ocellatus SO 24 3 −15.7 −15.6 to −
15.9 0.14 11.2 10.9 to 11.4 0.21
Spanish Mackerel
Scomberomorus maculatus
SM 48.4 2 −19.0 −18.8 to −19.2 0.31 13.6 13.4 to 13.8 0.29
Spot Leiostomus xanthurus LX 16.2 16 −18.6 −15.8 to −21.5 1.28 11.6 10.4 to 13.0 0.81
Spotted Seatrout Cynoscion
nebulosus
CN 12.9 6 −18.3 −17.6 to −19.8 0.75 11.8 11.1 to 13.3 0.76
Star Drum Stellifer lanceolatus SL 12.4 10 −19.2 −18.7 to −19.9 0.38 12.2 11.7 to 12.4 0.28
Southern Kingfish Menticirrhus
americanus
MA 35.5 2 −17.9 −17.6 to −18.3 0.46 12.6 12.5 to 12.7 0.16
Invertebrates
Squid Loligo sp. LS 6.3 16 −19.4 −17.8 to −21.1 1.11 11.8 11.1 to 13.2 0.63
Blue crab Callinectes sapidus CS ∼15 6 −18.4 −16.8 to −19.2 0.84 10.8 8.9 to 12.7 1.39
Brown shrimp Farfantepenaeus
aztecus
FA 10.2 17 −18.5 −16.1 to −22.7 1.74 9.4 7.5 to 10.9 1.21
Mantis shrimp Squilla empusa SE 7.5 8 −18.9 −18.1 to −20.0 0.78 9.7 9.1 to 10.6 0.46
Shark pups
Atlantic Sharpnose Shark
Rhizoprionodon terraenovae
RT 33.4 11 −18.1 −16.6 to −19.2 1.06 14.6 13.0 to 16.5 1.22
Scalloped Hammerhead
Sphyrna lewini
SL 46.5 4
−17.7 −17.4 to −18.4 0.51 17.2 16.5 to 17.9 0.80
The ontogenetic diet shift between summer–fall age-0 and
juvenile Sandbar Sharks in this study was represented by a
difference in δ
15
Nof∼0.3‰ and a difference in δ
13
Cof∼1‰
between the two age-classes. Wells et al. (2008) studied juvenile
and adult Red Snapper and, due to a diet shift from zooplankton
(primary consumers) to small teleosts and benthic crustaceans
(secondary consumers), found a difference of ∼1.3‰ in δ
15
N—
as expected, a larger ontogenetic difference in δ
15
N than what
we observed in Sandbar Sharks in this study because of a larger
transition within the food chain. The change in δ
13
C that Wells
et al. (2008) found (∼1‰) is similar to changes observed in this
study, and in both cases the predator changed feeding habitats
within an ecosystem (benthic to pelagic for summer–fall estuar-
ine Sandbar Sharks, sandy bottom to reef for continental shelf
Red Snapper). Estrada et al. (2006) found a δ
15
N shift of ∼3‰ in
the vertebrae of White Shark Carcharodon carcharias that was
associated with a diet shift from teleosts to marine mammals
that feed on teleosts. MacNeil et al. (2005) found differences
164 SHIFFMAN ET AL.
in δ
15
N comparable to those in this study (∼0.5‰) between
liver and cartilage samples within individual Blue Sharks Pri-
onace glauca and Common Thresher Sharks Alopias vulpinus,
but larger δ
15
N differences (∼3‰) were found between liver
and cartilage samples of Shortfin Makos. Blue and Thresher
sharks switch diets between preferred teleost prey, a lesser diet
change than that of Shortfin Makos, which switch from preying
on cephalopods to piscivorous Bluefish, and therefore have a
larger difference in δ
15
N signature than what was observed in
this study. While regression analysis of total length by δ
15
N and
by δ
13
C showed a significant effect of size on isotopic signature,
the diet transition is not as abrupt as that found in Bluefin Tuna
Thunnus thynnus by Graham et al. (2007).
South Carolina juvenile Sandbar Sharks had a larger δ
15
N
range, δ
13
C range, and total occupied niche area than age-0
sharks, indicating a more diverse diet among juvenile individu-
als (Layman et al. 2007a). This is consistent with the increase in
diet diversity observed in adult Sandbar Sharks in Hawaiian wa-
ters (McElroy et al. 2006). Additionally, the high degree of over-
lap in total occupied niche area between young of year and ju-
veniles suggests that while Sandbar Sharks consume additional
prey species as they grow, older and larger juvenile sharks still
consume preferred young-of-year prey. This feeding strategy has
been observed in multiple shark species (Grubbs 2010), such as
the Tiger Shark Galeocerdo cuvier (Lowe et al. 1996), Broad-
nose Sevengill Shark Notorynchus cepedianus (Ebert 2002),
Lemon Shark Negaprion brevirostris (Wetherbee et al. 1990),
and Bonnethead Sphyrna tiburo (Bethea et al. 2007). The sample
sizes between young of year and juveniles are significantly dif-
ferent, which could influence these calculations, but Vaudo and
Heithaus (2011) performed a bootstrapping analysis and found
asymptotes at a sample size of approximately 25–30, less than
our smaller sample size, for several different coastal elasmo-
branch species.
As a higher total occupied niche area indicates a higher diet
breadth, the generalist feeding behavior of juvenile Sandbar
Sharks observed in western North Atlantic estuaries (Ellis and
Musick 2007) is reflected in the relatively high Layman metrics
calculated in this study compared with other marine species.
Layman metrics have been calculated for few other elasmo-
branch species to date. The δ
15
N range, δ
13
C range, and total oc-
cupied niche area calculations for the juvenile Sandbar Sharks
in this study were larger than those for 9 of the 10 studied
coastal elasmobranch species in Australia (Vaudo and Heithaus
2011). The Indo-Pacific Spotted Eagle Ray Aetobatus ocella-
tus, the largest batoid found in coastal Australian waters and the
only local species with jaw morphology capable of crushing the
shells of bivalve and gastropod prey, displayed higher Layman
metric values than the Sandbar Sharks in our study (Vaudo and
Heithaus 2011). Additionally, a marine piscivorous teleost in
the coastal Bahamas, the Gray Snapper Lutjanus griseus, has a
total occupied niche area of 8.9 (Layman et al. 2007b), interme-
diate to that of age-0 (7.1) and juvenile (14.1) Sandbar Sharks
in South Carolina. It is important to note that the present study
grouped together Sandbar Sharks from different estuaries while
Vaudo and Heithaus (2011) sampled in a single system, which
may artificially increase the isotopic niche width of our samples
if there are significant differences in baseline isotopic signatures
between estuaries sampled in this study. Future calculations of
Layman metrics for other marine predatory fishes will allow for
interesting comparisons between species and habitats.
This study assigned age-0 Sandbar Sharks a mean trophic
level of 3.8 and juvenile Sandbar Sharks a mean trophic level of
3.9 using the formula from Post (2002) and diet–tissue discrim-
ination factors from Kim et al. (2012). Adult Sandbar Sharks,
which annually migrate between coastal and offshore waters,
had a trophic level of 3.9 (despite a small sample size [n = 8]
that limits our confidence in these results), indicating a sim-
ilar diet to the juveniles. Based on seven Sandbar Shark diet
studies included in a meta-analysis by Cortes (1999), four of
which included adults (Wass 1973; Cliff et al. 1988; Stevens
and McLaughlin 1991; Stillwell and Kohler 1993), Sandbar
Sharks had a mean trophic level of 4.1, not a significantly dif-
ferent value from our calculation of 3.8 (χ
2
= 0.9, P = 0.75).
Trophic level can increase with increasing total length due to
the ability of larger sharks to capture prey that smaller sharks
cannot (Cortes 1999; Grubbs 2010), which explains the slightly
lower trophic level observed in our study focusing on young of
year and juveniles. The use of diet–tissue discrimination factors
from Caut et al. (2009) and Hussey et al. (2010) resulted in
very similar (but slightly higher) trophic position values, show-
ing that, in this case, the trophic level estimates were relatively
insensitive to diet–tissue discrimination factors.
Differences in the isotopic signature of Sandbar Sharks cap-
tured during April–June from that of summer–fall sharks (Ta-
ble 2) potentially indicated the influence of maternal effects on
the isotopic composition of newborn age-0 sharks (McMeans
et al. 2009; Vaudo et al. 2010) and the influence of recent off-
shore feeding that affected the isotopic composition of recently
arrived juveniles in the months of May and June (Ulrich et al.
2007). Offshore food webs can have a less negative carbon sig-
nature than adjacent estuarine food webs (Leakey et al. 2008),
with differences of up to 4‰, which would influence the iso-
topic signatures of juvenile Sandbar Sharks that had recently
been feeding offshore.
Once unequal capture rates of young of year and juveniles
were taken into account (by analyzing average isotopic signa-
tures of young of year only and juveniles only), no significant
differences were found between estuaries. Similar prey species
were found in each estuary, although local abundance can be
variable (Bill Roumillat, SCDNR, personal communication).
Between-estuary movements of age-0 and juvenile Sandbar
Sharks in Virginia have been observed, but it is more com-
mon for Sandbar Sharks to remain within one estuary during a
summer (Grubbs et al. 2007). Within South Carolina, tagging
recaptures indicate seasonal fidelity to estuaries (Bryan Frazier,
SCDNR, personal communication). No significant differences
in δ
15
Norδ
13
C were found between sexes, which is consistent
FEEDING ECOLOGY OF THE SANDBAR SHARK IN SOUTH CAROLINA 165
with the species’ known life history, as age-0 and juvenile Sand-
bar Sharks are not known to spatially segregate based on sex
within South Carolina estuaries (Ulrich et al. 2007).
The methods utilized in this study have important limita-
tions that must be considered when interpreting these results.
Different carbon signatures between juvenile and age-0 Sandbar
Sharks may reflect a shift from benthic to pelagic feeding within
an estuary, or they may reflect evidence of offshore feeding in
juveniles despite our efforts to correct for this with a July 15th
cutoff date. The use of multiple single-factor ANOVAs, which
were performed to correct for the unbalanced and opportunistic
sampling regime, increases the chance of a type II error. Addi-
tionally, our decision to combine Sandbar Sharks and potential
prey from different estuaries assumes that the baseline isotopic
signature of these estuaries is very similar, which may or may
not be the case. Additional sampling, which would have ideally
included primary producers and multiple individuals of each po-
tential prey species from each estuary, would have resolved this
but was not possible due to the logistical limitations of the study.
Single-tissue stable isotope analysis provides less information
than analyses of multiple tissues, since different tissues have
different turnover rates (MacNeil et al. 2005), though obtaining
samples from commonly used tissues such as liver and verte-
brae usually requires the sacrifice of animals. Finally, whenever
possible, studies should be designed to obtain the data needed
for precise statistical mixing models.
While lethal shark research is sometimes necessary to ob-
tain the data needed by fisheries managers, we agree with
Heupel and Simpfendorfer (2010) and Hammerschlag and
Sulikowski (2011) that nonlethal methods should be used when-
ever possible. No Sandbar Sharks were sacrificed for this project,
and despite utilizing only one tissue type (muscle), our results
showed trends consistent with earlier lethal-sampling dietary re-
search. Sharks have longer isotopic turnover rates than teleosts
(Hesslein et al. 1993; Logan and Lutcavage 2010), and slow
turnover rates have been observed in shark muscle tissue (Mac-
Neil et al. 2005; Logan and Lutcavage 2010). Comparisons of
stable isotope data with detailed stomach content analysis data,
ideally obtained though gastric lavages, can provide compli-
mentary dietary information but are very labor intensive (Vaudo
and Heithaus 2011). Our study is among the first to detect an
ontogenetic diet shift in a wild population of sharks using a
nonlethal, single-tissue stable isotope analysis sample design.
Fisheries managers interested in creating an ecosystem-based
fisheries management plan for the western North Atlantic Ocean
Sandbar Shark population can incorporate data from this study.
Sandbar Shark diet appears consistent between estuaries, sexes,
and years. A benthic-to-pelagic, crustacean-to-teleost ontoge-
netic diet shift similar to the shift documented in Virginia’s and
Hawaii’s Sandbar Shark populations appears to also occur in
South Carolina’s population. Juvenile Sandbar Sharks have a
wider diet breadth than age-0 sharks within South Carolina and
have some of the highest values of diet breadth metrics ever
calculated in an elasmobranch, supporting the idea that they
are generalist predators. We encourage future muscle isotope
studies of this type to reduce unnecessary lethal sampling of
elasmobranchs and to provide basic dietary information to fish-
eries managers.
ACKNOWLEDGMENTS
The authors would like to thank Mariah Boyle, Anabela Maia,
Chuck Bangley, Jeremy Vaudo, Sora Kim, Colin Simpendorfer,
Demian Chapman, R. Dean Grubbs, Bryan Franks, and Enric
Cortes for their assistance with providing valuable information
and multiple literature sources. We would also like to thank
Henry DaVega, Erin Levesque, and Jonathan Tucker from the
SCDNR for their assistance with fieldwork. Bill Roumillat of
the SCDNR provided prey samples and assisted with all stages
of this project. Julie Higgins, Lisa May, and Kevin Beauchesne
from the Hollings Marine Laboratory aided in the processing
of stable isotope samples. This research was supported by grant
F-85-R4, F-77-6 of the Federal Aid in Sport Fish Restoration
program, the Cooperative States Shark Pupping and Nursery
Habitat Survey, the State of South Carolina, and the Department
of Biology of the College of Charleston, in addition to College
of Charleston Faculty Development and Department of Biology
Research and Development grants to Gorka Sancho. The authors
would also like to thank two anonymous reviewers whose feed-
back strengthened the manuscript. The handling of animals in
this study was covered under the College of Charleston IACUC
permit # 2009-021. Certain commercial equipment, instruments,
or materials are identified in this paper to specify adequately
the experimental procedure. Such identification does not imply
recommendation or endorsement by the National Institute of
Standards and Technology, nor does it imply that the materials
or equipment identified are necessarily the best available for the
purpose. This is contribution 420 of the College of Charleston
Graduate Program in Marine Biology and contribution 718 of
the South Carolina Marine Resources Center.
REFERENCES
Abel, D. C., R. F. Young, J. A. Garwood, M. Travaline, and B. K. Yednock.
2007. Observations on the importance of salinity structure to shark popula-
tions and nurseries in two South Carolina estuaries. Pages 109–124 in C. T.
McCandless, N. E. Kohler, and H. L. Pratt, Jr., editors. Shark nursery grounds
of the Gulf of Mexico and the east coast waters of the United States. American
Fisheries Society, Symposium 50, Bethesda, Maryland.
Arrington, D. A., K. O. Winemiller, W. F. Loftus, and S. Akin. 2002. How often
do fishes “run on empty”? Ecology 83:2145–2151.
Arthur, K. E., M. C. Boyle, and C. J. Limpus. 2008. Ontogenetic changes in
diet and habitat use in green sea turtle (Chelonia mydas) life history. Marine
Ecology Progress Series 362:303–311
Bethea, D. M., L. Hale, J. K. Carlson, E. Cortes, C. A. Manire, and J. Gelsle-
ichter. 2007. Geographic and ontogenetic variation in the diet and daily ration
of the Bonnethead Shark from the eastern Gulf of Mexico. Marine Biology
152:1009–1020.
Castro, J. I. 1993. The shark nursery of Bulls Bay, South Carolina, with a
review of the shark nurseries of the southeastern coast of the United States.
Environmental Biology of Fishes 38:37–48.
166 SHIFFMAN ET AL.
Caut, S., E. Angulo, and F. Courchamp. 2009. Variation in discrimination factors
(15N and 13C): the effect of diet isotopic values and applications for diet
reconstruction. Journal of Applied Ecology 46.2:443–453.
Chapman, D. F., E. K. Pikitch, and E. A. Babcock. 2006. Marine parks need
sharks? Science 312:526–527.
Cliff, G., F. J. Dudley, and B. Davis. 1988. Sharks caught in the protective gill
nets off Natal, South Africa. 1. The Sandbar Shark Carcharhinus plumbeus.
South African Journal of Marine Science 7:255–265.
Cliff, G., F. J. Dudley, and B. Davis. 1990. Sharks caught in the protective gill
nets off natal, South Africa. 3. The Shortfin Mako Shark Isurus oxyrinchus.
South African Journal of Marine Science 9:115–126.
Compagno, L., M. Dando, and S. Fowler. 2005. Sharks of the world. Princeton
University Press, Princeton, New Jersey.
Conrath, C. L., and J. A. Musick. 2008. Investigations into depth and temperature
habitat utilization and overwintering grounds of juvenile Sandbar Sharks,
Carcharhinus plumbeus: the importance of nearshore North Carolina waters.
Environmental Biology of Fishes 82:123–131.
Cortes E. 1999. Standardized diet compositions and trophic levels of sharks.
ICES Journal of Marine Science 56:707–717.
Dame, R., M. Alber, D. Allen, M. Mallin, C. Montague, A. Lewitus, A.
Chalmers, R. Gardner, C. Gilman, B. Kjerfve, J. Pinckney, and N. Smith.
2000. Estuaries of the South Atlantic coast of North America: their geo-
graphic signatures. Estuaries 23:789–819.
Davenport, S. R., and N. J. Bax. 2002. A trophic study of a marine ecosystem off
southeastern Australia using stable isotopes of carbon and nitrogen. Canadian
Journal of Fisheries and Aquatic Sciences 59:514–530.
Dulvy, N. K., J. K. Baum, S. Clarke, L. J. Compagno, E. Cortes, A. Domingo,
S. Fordham, S. Fowler, M. P. Francis, C. Gibson, J. Martinez, J. A. Mu-
sick, A. Soldo, J. D. Stevens, and S. Valenti. 2008. You can swim but you
can’t hide: the global status and conservation of oceanic pelagic sharks and
rays. Aquatic Conservation: Marine and Freshwater Ecosystems 18:459–
482.
Ebert, D. A. 2002. Ontogenetic changes in the diet of the Sevengill Shark
(Notorynchus cepedianus). Marine and Freshwater Research 53:517–523.
Ellis, J. K., and J. R. Musick. 2007. Ontogenetic changes in the diet of the Sand-
bar Shark, Carcharhinus plumbeus, in lower Chesapeake Bay and Virginia
coastal waters. Environmental Biology of Fishes 80:51–67.
Ellis, J. R., M. G. Pawson, and S. E. Shackley. 1996. The comparative feeding
ecology of six species of shark and four species of ray (Elasmobranchii) in
the north-east Atlantic. Journal of the Marine Biological Association of the
United Kingdom 76:89–106.
Estrada, J. A., A. N. Rice, L. J. Natanson, and G. B. Skomal. 2006. Use of
isotopic analysis of vertebrae in reconstructing ontogenetic feeding ecology
in White Sharks. Ecology 87:829–834.
Graham, B. S., D. Grubbs, K. Holland, and B. N. Popp. 2007. A rapid ontogenetic
shift in the diet of juvenile Yellowfin Tuna from Hawaii. Marine Biology
150:617–658.
Grubbs, R. D. 2010. Ontogenetic shifts in movement and habitat use. Pages
319–350 in J. Carrier, D. Musick, and M. Heithaus, editors. Sharks and their
relatives II: biodiversity, adaptive physiology, and conservation. CRC Press,
Boca Raton, Florida.
Grubbs, R. D., J. A. Musick, C. L. Conrath, and J. G. Romine. 2007. Long
term movements, migration, and temporal delineation for juvenile Sandbar
Sharks in the Chesapeake Bay region. Pages 87–108 in C. T. McCandless,
N. E. Kohler, and H. L. Pratt Jr., editors. Shark nursery grounds of the Gulf
of Mexico and east coast waters of the United States. American Fisheries
Society, Symposium 50, Bethesda, Maryland.
Hammerschlag, N., and J. Sulikowski. 2011. Killing for conservation: the need
for alternatives to lethal sampling of apex predatory sharks. Endangered
Species Research 14:135–140.
Hesslein, R. A., K. A. Hallard, and P. Ramlal 1993. Replacement of sulfur,
carbon, and nitrogen in tissue of growing Broad Whitefish (Coregonus nasus)
in response to a change in diet. Canadian Journal of Fisheries and Aquatic
Sciences 50:2071–2076.
Heupel, M. R., and C. A. Simpfendorfer. 2010. Science or slaughter: need for
lethal sampling of sharks. Conservation Biology 24:1212–1218
Hussey, N. E., J. Brush, I. D. McCarthy, and A. T. Fisk. 2010. D15N and
D13C diet-tissue discrimination factors for large sharks under semi-controlled
conditions. Comparative Biochemistry and Physiology A 155:445–453.
Hussey, N. E., S. F. Dudley, I. D. McCarthy, G. Cliff, and A. T. Fisk. 2011.
Stable isotope profiles of large marine predators: viable indicators of trophic
position, diet, and movement in sharks? Canadian Journal of Fisheries and
Aquatic Sciences 68:2029–2045.
Hussey, N. E., M. A. Macneil, J. A. Olin, B. C. McMeans, M. J. Kinney,
D. D. Chapman, and A. T. Fisk. 2012. Stable isotopes and elasmobranchs:
tissue types, methods, applications, and assumptions. Journal of Fish Biology
80:1449–1484.
Hyslop, E. J. 1980. Stomach contents analysis- a review of methods and their
application. Journal of Fish Biology 17:411–429.
Kim, S. L., D. R. Casper, F. Galvan-Magana, R. Ochoa-Diaz, S. B. Hernandez-
Aguilar, and P. L. Koch. 2012. Carbon and nitrogen discrimination factors
for elasmobranch soft tissues based on a long term controlled feeding study.
Environmental Biology of Fishes 95:37–52.
Kim, S. L., and P. L. Koch. 2011. Methods to collect, preserve, and prepare
elasmobranch tissues for stable isotope analysis. Environmental Biology of
Fishes 95:53–63.
Layman, C. A., D. A. Arrington, C. G. Montana, and D. M. Post. 2007a.
Can stable isotope ratios provide for community-wide measures of trophic
structure? Ecology 88:42–48.
Layman, C. A., J. P. Quattrochi, C. M. Peyer, and J. E. Allgeier. 2007b. Niche
width collapse in a resilient top predator following ecosystem fragmentation.
Ecology Letters 10:937–944.
Leakey, C. D., M. J. Attrill, S. Jennings, and M. F. Fitzsimons. 2008. Stable
isotopes in juvenile marine fishes and their invertebrate prey from the Thames
estuary and adjacent coastal regions. Estuarine Coastal and Shelf Science
77:513–522.
Logan, J. M., and M. E. Lutcavage. 2010. Stable isotope dynamics in elasmo-
branch fishes. Hydrobiologia 644:231–244.
Lowe, C. G., B. M. Wetherbee, G. L. Crow, and A. Tester. 1996. Ontogenetic
dietary shifts and feeding behavior of the Tiger Shark, Galeocerdo cuvier,in
Hawaiian waters. Environmental Biology of Fishes 47:203–211.
Lucifora, L. O., V. B. Garcia, R. C. Menni, A. H. Escalante, and N. M. Hozbor.
2009. Effects of body size, age and maturity stage on diet in a large shark:
ecological and applied implications. Ecology Research 24:109–119.
MacNeil, M. A., G. B. Skomal, and A. T. Fisk. 2005. Stable isotopes from
multiple tissues reveal diet switching in sharks. Marine Ecology Progress
Series 302:199–206.
Maia, A., N. Queiroz, J. P. Correia, and H. Cabral. 2006. Food habits of the
Shortfin Mako,
Isurus oxyrinchus, off the southwest coast of Portugal. Envi-
ronmental Biology of Fishes 77:157–167.
Malpica-Cruz, L., S. Z. Herzka, O. Sosa-Nishizaki, and M. A. Escobedo-Olvera.
2013. Tissue-specific stable isotope ratios of Shortfin Mako and White Sharks
as indicators of size-based differences in foraging habitat and trophic level.
Fisheries Oceanography 22:429–445.
Matich, P., M. R. Heithaus, and C. A. Layman. 2010. Size-based variation in
intertissue comparisons of stable carbon and nitrogen isotopic signatures of
Bull Sharks and Tiger Sharks. Canadian Journal of Fisheries and Aquatic
Sciences 67:877–885.
McElroy, W. D., B. M. Wetherbee, C. S. Mostello, C. G. Lowe, G. L. Crow,
and R. C. Waas. 2006. Food habits and ontogenetic changes in the diet of the
Sandbar Shark, Carcharhinus plumbeus, in Hawaii. Environmental Biology
of Fishes 76:81–92.
McMeans, B. C., J. A. Olin, and G. W. Benz. 2009. Stable isotope comparisons
between embryos and mothers of a placentatrophic shark species. Journal of
Fish Biology 75:2464–2474.
Medved, R. J., C. E. Stillwell, and J. J. Casey. 1985. Stomach contents of young
Sandbar Sharks Carcharhinus plumbeus in Chincoteague Bay, Virginia. U.S.
National Marine Fisheries Service Fishery Bulletin 83:395–402.
FEEDING ECOLOGY OF THE SANDBAR SHARK IN SOUTH CAROLINA 167
Minagawa, M., and E. Wada. 1984. Stepwise enrichment of 15N along food
chains: further evidence and the relation between d15N and animal age.
Geochimica et Cosmochimica Acta 48:1135–1140.
Musick, J. A., S. Branstetter, and J. Colvocoresses. 1993. Trends in shark
abundance from 1974–1991 for the Chesapeake bight region of the U.S.
mid-Atlantic coast. NOAA Technical Report NMFS 115.
Olin, J. A., N. E. Hussey, M. Fritts, M. R. Heupel, C. A. Simpendorfer,
G. R. Poulakis, and A. T. Fisk 2011. Maternal meddling in neonatal sharks:
implications for interpreting stable isotope analysis in young animals. Rapid
Communications in Mass Spectrometry 25:1008–1016.
Peterson, B. J., and B. Fry. 1987. Stable isotopes in ecosystem studies. Annual
Reviews in Ecological Systems 18:293–320.
Pikitch, E. K., C. Santora, E. A. Babcock, A. Bakun, R. Bonfil, D. O. Conover,
P. Dayton, P. Doukakis, D. Fluharty, B. Heneman, E. D. Houde, J. Link,
P. A. Livingston, M. Mangel, M. K. McAllister, J. Pope, and K. J. Sainsbury.
2004. Ecosystem-based fishery management. Science 305:346–347.
Pinnegar, J. K., and N. V. Polunin. 1999. Differential fractionation of d13C and
d15N among fish tissues: implications for the study of trophic interactions.
Functional Ecology 13:225–231.
Post, D. M. 2002. Using stable isotopes to estimate trophic position: models,
methods, and assumptions. Ecology 83:703–718.
Post, D. M., C. A. Layman, D. A. Arrington, G. Takimoto, J. Quattrochi, and
C. G. Montana. 2007. Getting to the fat of the matter: models, methods and
assumptions for dealing with lipids in stable isotope analyses. Oecologia
152:179–189.
R Development Core Team. 2010. R: a language and environment for statistical
computing, version 2.8.1. R Foundation for Statistical Computing, Vienna.
Available: ./ (June 2014).
Romine, J. G., K. T. Parsons, R. D. Grubbs, J. A. Musick, and T. T. Sutton. 2011.
Standardized catch rates of Sandbar Sharks and Dusky Sharks in the VIMS
longline survey, 1975–2009. South Atlantic Fishery Management Council,
SEDAR 21-DW-18, Charleston, South Carolina.
Sanderson B. L., C. D. Tran, H. J. Coe, V. Pelekis, E. A. Steel, W. L. Reichert.
2009. Nonlethal sampling of fish caudal fins yields valuable stable isotope
data for threatened and endangered fishes. Transactions of the American
Fisheries Society 138:1166–1177.
SEDAR (Southeast Data Assessment and Review). 2006. SEDAR 11 stock
assessment report: large coastal shark complex, Blacktip and Sandbar shark.
SEDAR, North Charleston, South Carolina.
SEDAR (Southeast Data Assessment and Review). 2011. SEDAR 21 stock
assessment report: HMS Sandbar Shark. SEDAR, North Charleston, South
Carolina.
Shaw, A. 2013. Dietary niche overlap of an estuarine predatory fish community
in South Carolina assessed by stable isotope analysis. Master’s thesis. College
of Charleston, Charleston, South Carolina.
Shiffman, D. S., A. J. Gallagher, M. D. Boyle, C. M. Hammerschlag-Peyer, and
N. Hammerschlag. 2012. Stable isotope analysis as a tool for elasmobranch
conservation research: a primer for non-specialists. Marine and Freshwater
Research 63:635–643.
Shurdak, M. E., and S. H. Gruber. 1989. Gastric evacuation of the Lemon Shark
Negaprion brevirostris under controlled conditions. Journal of Experimental
Biology 48:77–82.
Simpfendorfer, C. A., M. R. Heupel, W. T. White, and N. K. Dulvy. 2011. The
importance of research and public opinion to conservation and management
of sharks and rays: a synthesis. Marine and Freshwater Research 62:518–527.
Sminkey, T. R., and J. A. Musick. 1996. Demographic analysis of the Sandbar
Shark, Carcharhinus plumbeus, in the western North Atlantic. U.S. National
Marine Fisheries Service Fishery Bulletin 94:341–347.
Smith, B. E., and J. S. Link. 2010. The trophic dynamics of 50 finfish and
2 squid species on the Northeast US Continental Shelf. NOAA Technical
Memorandum NMFS-NE-216.
Stevens, J. 1973. Stomach contents of the Blue Shark Prionace glauca off
south-west England. Journal of the Marine Biological Association of the
United Kingdom 53:357–361.
Stevens, J. D. 1984. Biological observations on sharks caught by sport fisherman
of New South Wales. Australian Journal of Marine and Freshwater Research
35:573–590.
Stevens, J. D., and K. J. McLoughlin. 1991. Distribution, size and sex com-
position, reproductive biology, and diet of sharks from northern Australia.
Australian Journal of Marine and Freshwater Research 42:151–199.
Stillwell, C. E., and N. E. Kohler. 1993. Food habits of the Sandbar Shark
Carcharhinus plumbeus off the U.S. northeast coast with estimates of daily
ration. U.S. National Marine Fisheries Service Fishery Bulletin 91:138–
150.
Ulrich, G. F., C. M. Jones, W. B. Driggers III, J. M. Drymon, D. Oakley, and C.
Riley. 2007. Habitat utilization, relative abundance, and seasonality of sharks
in the estuarine and nearshore waters of South Carolina. Pages 125–139 in
C. T. McCandless, N. E. Kohler, and H. L. Pratt Jr., editors. Shark nursery
grounds of the Gulf of Mexico and the east coast waters of the United States.
American Fisheries Society, Symposium 50, Bethesda, Maryland.
Vaudo, J. J., and M. R. Heithaus. 2011. Dietary overlap in a nearshore elasmo-
branch mesopredator community. Marine Ecology Progress Series 425:247–
260.
Vaudo, J. J., P. Matich, and M. R. Heithaus. 2010. Mother-offspring isotope
fractionation in two species of placentatrophic sharks. Journal of Fish Biology
77:1724–1727.
Wass, R. C. 1973. Size, growth, and reproduction of the Sandbar Shark Car-
charhinus milberti in Hawaii. Pacific Science 4:305–318.
Wells, R., J. Cowan, and B. Fry. 2008. Feeding ecology of the Red Snapper
Lutjanus campechanus in the northern Gulf of Mexico. Marine Ecology
Progress Series 361:213–225.
Wetherbee, B., S. Gruber, and E. Cortes. 1990. Diet, feeding habits, diges-
tion, and consumption in sharks, with special reference to the Lemon Shark
Negaprion brevirostris. NOAA Technical Report NMFS 90:225–246.
168 SHIFFMAN ET AL.
Appendix: ANOVA Results
TABLE A.1. Results of multifactor ANOVAs comparing the δ
15
Nandδ
13
C signatures of Sandbar Shark muscle samples (summer–fall only). Significant P-values
are indicated in bold italics. As no interaction terms (i.e., δ
13
C × year : sex) were significant, interaction terms were omitted from this table.
Comparison df Mean square FP
δ
13
C × year 1 9.85 19.34 2.9 × 10
−5
δ
13
C × sex 2 0.0374 0.074 0.929
δ
13
C × estuary 4 6.58 12.9 6.08 × 10
−9
δ
13
C × month 4 4.279 8.4 4.4 × 10
−6
δ
13
C × age-class 1 4.18 8.21 0.0048
δ
15
N × year 1 0.198 0.358 0.55
δ
15
N × sex 2 1.329 2.4 0.09
δ
15
N × estuary 4 4.773 8.63 3.4 × 10
−6
δ
15
N × month 4 0.803 1.447 0.22
δ
15
N × age-class 1 1.115 2.01 0.157
TABLE A.2. Results of single-factor ANOVAs comparing the δ
15
Nandδ
13
C signatures of Sandbar Shark muscle samples. Significant P-values are in bold italics.
The column “Corrected P" uses a Holm correction to adjust P-values to account for the increased type I error rate associated with running multiple single-factor
ANOVAs (N = 5 for each of the following: all Sandbar Sharks δ
15
N, all Sandbar Sharks δ
13
C, summer–fall Sandbar Sharks δ
13
C, and summer–fall Sandbar Sharks
δ
15
N). Sample sizes (N) of each group are included and are also found in Table 1. Estuary abbreviations are as follows: WB = Winyah Bay, BB = Bulls Bay, CH
= Charleston Harbor, PRS = Port Royal Sound, and SHS = St. Helena Sound).
Comparison df Mean square FPCorrected P
All Sandbar Sharks
δ
15
N × estuary (age-0: WB N = 1, BB N
= 27, CH and PRS N = 0, SHS N =
47; juvenile: WB N = 64, BB N = 34,
CH N = 38, PRS N = 12, SHS N = 29)
42.9 4.60.001 0.005
δ
15
N × month 6 0.6 1.0 0.42 0.648
δ
15
N × year 1 2.7 4.3 0.039 0.156
δ
15
N × sex 1 1.2 1.8 0.17 0.51
δ
15
N × age-class (age-0: N = 77 versus
juvenile: N = 180)
1 0.6 0.9 0.324 0.648
δ
13
C × estuary (age-0: WB N = 1, BB N
= 27, CH and PRS N = 0, SHS N =
47; juvenile: WB N = 64, BB N = 34,
CH N = 38, PRS N = 12, SHS N = 29)
42.3 4.40.002 0.008
δ
13
C × month 5 1.56 2.9 0.008 0.024
δ
13
C × year 1 1.1 2.1 0.147 0.294
δ
13
C × sex 1 0.2 0.3 0.734 0.734
δ
13
C × age-class (age-0: N = 77 versus
juvenile: N = 180)
1 61.1 114.6 <0.0001 0.0005
Summer–fall Sandbar Sharks
δ
15
N × estuary 4 4.4 7.6 0.0001 0.0005
δ
15
N × month 4 2.3 4.4 0.02 0.06
δ
15
N × year 1 0.2 0.3 0.58 0.58
δ
15
N × sex 1 1.3 1.9 0.149 0.298
δ
15
N × age-class (age-0: N = 58 versus
juvenile: N = 140)
14.1 6.40.012 0.048
FEEDING ECOLOGY OF THE SANDBAR SHARK IN SOUTH CAROLINA 169
TABLE A.2. Continued.
Comparison df Mean square FPCorrected P
δ
13
C × estuary 4 8.4 13.6 <0.0001 <0.0001
δ
13
C × month 4 10.6 18.7 <0.0001 <0.0001
δ
13
C × year 1 0.3 0.4 0.51 1
δ
13
C × sex 1 0.0 0.26 0.974 1
δ
13
C × age-class (age-0: N = 58 versus
juvenile: N = 140)
1 27.0 62.9 <0.0001 <0.0001
Summer–fall age-class-restricted estuary
comparisons
δ
15
N × estuary (age-0 only: WB N = 1,
BB N = 19, CH and PRS N = 0, SHS
N = 38)
1 0.1 0.2 0.70
δ
15
N × estuary (juveniles only: WB N =
63, BB N = 13, CH N = 28, PRS N =
12, SHS N = 24)
3 0.5 1.2 0.31
δ
13
C × estuary (age-0 only: WB N = 1,
BB N = 19, CH and PRS N = 0, SHS
N = 38)
1 1.1 3.8 0.058
δ
13
C × estuary (juveniles only: WB N =
63, BB N = 13, CH N = 28, PRS N =
12, SHS N = 24)
3 1.6 2.5 0.067