Movement patterns and residence of adult winter flounder within a long island estuary
Bạn đang xem bản rút gọn của tài liệu. Xem và tải ngay bản đầy đủ của tài liệu tại đây (372.86 KB, 13 trang )
BioOne sees sustainable scholarly publishing as an inherently collaborative enterprise connecting authors, nonprofit publishers, academic institutions, research
libraries, and research funders in the common goal of maximizing access to critical research.
Movement Patterns and Residence of Adult Winter Flounder within a Long Island
Estuary
Author(s): Skyler R. Sagarese and Michael G. Frisk
Source: Marine and Coastal Fisheries: Dynamics, Management, and Ecosystem Science, 3(1):295-306.
2011.
Published By: American Fisheries Society
URL: />BioOne (www.bioone.org) is a nonprofit, online aggregation of core research in the biological, ecological, and
environmental sciences. BioOne provides a sustainable online platform for over 170 journals and books published
by nonprofit societies, associations, museums, institutions, and presses.
Your use of this PDF, the BioOne Web site, and all posted and associated content indicates your acceptance of
BioOne’s Terms of Use, available at www.bioone.org/page/terms_of_use.
Usage of BioOne content is strictly limited to personal, educational, and non-commercial use. Commercial inquiries
or rights and permissions requests should be directed to the individual publisher as copyright holder.
Marine and Coastal Fisheries: Dynamics, Management, and Ecosystem Science 3:295–306, 2011
C
American Fisheries Society 2011
ISSN: 1942-5120 online
DOI: 10.1080/19425120.2011.603957
ARTICLE
Movement Patterns and Residence of Adult Winter Flounder
within a Long Island Estuary
Skyler R. Sagarese* and Michael G. Frisk
School of Marine and Atmospheric Sciences, Stony Brook University, Stony Brook, New York 11794, USA
Abstract
We implanted individually coded acoustic transmitters into 40 adult winter flounder Pseudopleuronectes ameri-
canus (mean total length = 320 mm; range = 240–423 mm) and monitored them by use of passive acoustic telemetry
from September 2007 to April 2009 to classify spatial and temporal movement patterns and quantify residency in
Shinnecock Bay, eastern Long Island, New York. Overall, 94,250 valid detections were received. Winter flounder
remained inshore, and 89% of the total detections occurred between May and October when bottom water tem-
perature exceeded 15
◦
C. Residency in Shinnecock Bay was dependent on time of release and varied greatly from
a few weeks to more than 6 months; total presence (number of days on which individual fish were detected within
the bay) averaged 22.0 d (range = 1–132 d). Tracked winter flounder were classified as exhibiting three movement
patterns: (1) inner bay movements (short term versus long term), (2) dispersal to offshore waters, and (3) connectivity
to other inshore areas. The first two patterns were consistent with historical notions of spatially overlapping resident
and migratory individuals, whereas fish that displayed the third pattern may have exhibited a larger home range.
These results provide insight into winter flounder movements, residency, and stock structure in a coastal bay of Long
Island and provide important information for management. The interaction of exploitation and divergent migration
behaviors may be a factor contributing to the winter flounder’s decline in Long Island bays; however, more work will
be required to obtain a full understanding of the spatial behavior and stock structure of this species.
Estuaries provide essential habitat and nursery grounds
for many commercially important species, including flatfish.
Decades of coastal land development, pollution, and climate
change have degraded the health of estuarine ecosystems
throughout the northeastern USA (Roman et al. 2000; Roessig
et al. 2004). These impacts, in combination with overfishing,
have resulted in historically low abundance levels of the once-
widespread and abundant winter flounder Pseudopleuronectes
americanus (Taylor and Danila 2005; ASMFC 2006; Mander-
son 2008). The winter flounder population off the south shore
of Long Island, New York, exemplifies a declining trend in in-
shore abundance while the species remains comparatively more
abundant offshore (ASMFC 2009). Declines in winter flounder
stocks have impaired fisheries, especially in New York, where
commercial catch is currently less than 9% of peak levels ob-
Subject editor: Michelle Heupel, James Cook University, Queensland, Australia
*Corresponding author:
Received July 12, 2010; accepted December 8, 2010
served in the 1980s and recreational catch is less than 2% of
peak levels (NMFS 2007; National Marine Fisheries Service,
Fisheries Statistics Division, personal communication).
Traditionally, stocks are defined by the populations’ ge-
ographical occurrence or by human activities that affect the
productivity of the populations or fisheries (Secor 1999). Con-
tingents, defined as subpopulations of fish aggregations that
display divergent migration behaviors or habitat use, may also
exist within a population (Hjort 1914; Secor 1999). Winter
flounder throughout the northeastern USA are separated into
three distinct stocks that display different maximum sizes,
growth rates, and ages at maturity: the Gulf of Maine, south-
ern New England–Middle Atlantic Bight, and Georges Bank
stocks (Brown and Gabriel 1998; Klein-MacPhee 2002). How-
ever, inshore residence of winter flounder in New York has been
295
296 SAGARESE AND FRISK
suggested (Lobell 1939; Poole 1966; Howe et al. 1976). Two
distinct behavioral groups have historically been identified: an
inshore contingent that is present in coastal bays year-round
(i.e., “bay fish” or “resident fish”), and an offshore contingent
of larger individuals that travel inshore during winter to spawn
(i.e., “offshore fish” or “dispersive fish”; Lobell 1939; Perlmut-
ter 1947; Secor 1999). Both groups overlap in spatial distribu-
tion during spawning, although it is unclear whether temporal
variation exists (Lobell 1939; Perlmutter 1947; Yencho 2009).
After spawning in early spring, some winter flounder disperse,
while others remain resident (Lobell 1939; Perlmutter 1947).
Recent evidence of two spawning peaks and subsequent settle-
ment peaks suggests the existence of some structuring between
dispersive and resident groups (Yencho 2009). In this paper,
we will refer to these groups as resident and dispersive; how-
ever, whether these groups represent contingents or genetically
separate stocks is unclear.
Research has highlighted the importance of conserving life
history diversity, or biocomplexity, within fish stocks by main-
taining all life history strategies so as to sustain stability and
resiliency to future environmental change (Hilborn et al. 2003;
Kerr et al. 2010). Spatial structure within populations may buffer
one life history strategy against competition and unfavorable
environmental conditions (Secor 2007; Kerr et al. 2010). As-
sessment of a stock’s health must consider all spawning compo-
nents because productivity of each component may vary under
different environmental scenarios (Hilborn et al. 2003). For ex-
ample, solely focusing on one component (e.g., dispersive fish)
may lead to decline and extinction if environmental conditions
change in favor of an alternate strategy (e.g., resident fish) that
declined during the previous regime. In Long Island bays, winter
flounder may be exhibiting partial migration, wherein a portion
of the population remains resident within the natal habitat while
the remaining individuals exhibit migratory behavior (Lundberg
1988; Dingle 1996; Kerr et al. 2009).
Migrations undertaken by winter flounder in the northwest-
ern Atlantic have been related to several factors, including
spawning, environmental conditions, ice formation, and turbu-
lence (McCracken 1963; Van Guelpen and Davis 1979; Pereira
et al. 1999; Wuenschel et al. 2009). Many studies have observed
that adult winter flounder return (or home) to the same spawning
grounds year after year (Saila 1961; McCracken 1963; Howe and
Coates 1975; Saucerman and Deegan 1991; Phelan 1992). Win-
ter flounder north of Cape Cod exhibit localized seasonal move-
ments within bays, whereas those south of Cape Cod move off-
shore when temperatures surpass 15
◦
C and then return inshore
to spawn (Lobell 1939; Perlmutter 1947; McCracken 1963;
Howe and Coates 1975; Phelan 1992; Wuenschel et al. 2009).
However, winter flounder were observed inshore in Great South
Bay, New York, when bottom temperatures exceeded 24
◦
C (Olla
et al. 1969). The physical environment of Long Island exposes
winter flounder to extreme seasonal conditions ranging from ex-
ceedingly warm (up to 30
◦
C; Nichols 1918) to below-freezing
temperatures and ice cover. Cold temperatures may induce mi-
gratory behavior through the creation of turbulence from strong
winds and drifting pack ice (Van Guelpen and Davis 1979).
If winter flounder in Long Island estuaries conform to histor-
ical observations of resident and dispersive contingents, there
will be important implications regarding the ecological and be-
havioral responses of this species to habitat quality and envi-
ronmental fluctuations, including those expected under climate
change. Unfavorable water temperatures and poor water quality
resulting from land runoff, harmful algal blooms, and exploita-
tion may differentially impact the survival and recruitment of
inshore resident winter flounder compared with the winter floun-
der that move offshore. Given the declining inshore abundance
of winter flounder, research examining movement patterns and
residency in relation to the environment within Long Island
bays is imperative. This information will benefit winter floun-
der management and will allow us to decipher the population
structure of winter flounder by identifying life cycle strategies.
Our objective was to monitor adult winter flounder behavior by
utilizing underwater acoustic telemetry to examine movement
patterns and quantify residency within a coastal bay of Long
Island.
METHODS
Study site.—Shinnecock Bay is a barrier beach and lagoonal
estuary located on the south shore of Long Island, approximately
120 km east of New York City (Figure 1). It connects to the
Atlantic Ocean by a dynamic inlet where tidal velocities average
2.5 knots/s (USFWS 1997). A man-made canal controls water
flow and prevents Shinnecock Bay waters from flowing north
into Peconic Bay (USFWS 1997). Shinnecock Bay has a mean
tidal range of 0.88 m at the inlet (Buonaiuto and Bokuniewicz
2008), an average salinity of 30 (Green and Chambers 2007),
and annual water temperatures ranging from −2
◦
Cto24
◦
C;
ice cover is possible in the bay during winter. Shinnecock Bay
encompasses an area of 39 km
2
and is relatively shallow; the
average depth is 3 m for the eastern portion but less than 2 m
for the western portion (USFWS 1997; Green and Chambers
2007).
Collection and preparation of adult winter flounder.—A
trawl survey with a stratified random sampling design was
conducted bimonthly during daylight between April and
August 2007 and monthly between May and August 2008 to col-
lect adult winter flounder. Trawl stations were randomly selected
by dividing the eastern portion of Shinnecock Bay into num-
bered boxes of equal size and using a random number generator
to determine which box would be sampled. To increase sample
size, additional trawling occurred from September to Novem-
ber 2007 (1 d/month), January to March 2008 (1 d/month), and
May to July 2008 (2 d/month). A 9-m otter trawl with 0.6-cm
mesh at the cod end was towed by the R/V Pritchard during
April–July 2007 (8-min tows) and by the R/V Shinnecock dur-
ing August–November 2007 and January–August 2008 (5-min
tows). Trawling throughout the year and during periods when
WINTER FLOUNDER MOVEMENTS 297
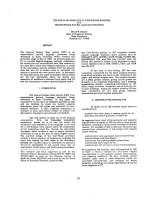
FIGURE 1. Map of Shinnecock Bay, Long Island, New York. Dots represent positions of acoustic receivers. Dashed ellipse identifies the high-density area
(described in Results). Dashed line represents Ponquogue Bridge, which separates the eastern and western portions of the bay.
both contingents were believed to be inshore (fall–winter) re-
duced the possibility of selecting one behavioral group over the
other.
Upon capture, winter flounder were measured for total length
(TL; mm), and healthy adults larger than 240 mm (Perlmutter
1947) were fitted with acoustic transmitters (Model V9-1
L-R64K,69kHz,9× 24 mm; VEMCO Ltd.). Transmitters
were surgically implanted within the peritoneal cavity of each
winter flounder by following procedures that were approved
by the Institutional Animal Care and Use Committee at Stony
Brook University. The first batch (n = 8) of captured winter
flounder was transported to the Stony Brook-Southampton
Marine Station on August 13, 2007; these fish were fitted with
transmitters and monitored for transmitter retention and mor-
tality. Five fish from this batch were released on September 8,
2007, and the remaining three fish were released on September
25, 2007; all were released at the site of capture. All winter
flounder in subsequent collections were fitted with transmitters
onboard, held in a holding tank for observation (≤30 min), and
released at the site of capture upon their recovery.
Acoustic transmitters had a power output of 142–150 dB
referenced to 1 μPa at 1 m, and the estimated battery life
was dependent on power output and transmitter delay. Thirty-
one transmitters were programmed to emit transmissions every
150–300 s (battery life ∼ 400 d), and nine transmitters (de-
ployed in year 2) emitted transmissions every 40–120 s (bat-
tery life ∼ 200 d). Transmission frequency was changed to
increase detection probability in the final year of monitoring.
Although flatfish tend to swim intermittently, they are capable
of swimming continuously at approximately 1 body length/s for
a considerable period at high temperatures (He 2003). Based on
this observation and on an average TL of 320 mm, transmitters
with greater transmission frequency provided greater detection
of winter flounder migrating past receivers because fish in this
study traveled as much as 48 m in 150 s (or 96 m in 300 s).
Field tests indicated a mean receiver range of 350 m, although
this varied with hydrographic and atmospheric conditions.
Passive tracking of winter flounder.—Winter flounder were
tracked passively at 18 stations (Figure 1) by use of VR2W
receivers (diameter = 308 × 73 mm; VEMCO Ltd.), which
are submersible, single-channel acoustic receivers that are ca-
pable of identifying coded acoustic transmitters. When a winter
flounder swam within range, the VR2W recorded the transmit-
ter’s identity and the date and time of detection. Twelve stations
were located in open water (Table 1) and each contained a
VR2W mounted on a concrete block; at the remaining stations,
the VR2W was directly attached to pilings (stations 4 and 14)
or jetties (stations 1–3 and 17). Receiver performance (code
detection efficiency and rejection coefficient) was analyzed as
described by Simpfendorfer et al. (2008).
Interpretation of telemetry data.—All transmitters were
tested in the laboratory and were assumed to work properly
after deployment. If a transmitter was recorded continuously
at the same location for at least 2 months, the individual as-
sociated with that transmitter was excluded from analysis and
was assumed to have died. In addition, single detections within
298 SAGARESE AND FRISK
TABLE 1. Summary of passive acoustic receiver (VR2W) stations used to detect acoustic-tagged winter flounder in Shinnecock Bay, Long Island. Asterisks
indicate receiver loss.
Station number
Number of fish
detected
Number of
detections Monitoring period Location
1 3 15 Jun 1, 2008–May 24, 2009 Inside inlet
2 7 62 Dec 28, 2007–May 24, 2009 Inside inlet
3 5 40 Aug 20, 2007–Apr 26, 2009 Bayside of inlet
4 1 98 Dec 28, 2007–May 8, 2009 Bridge
5 Mar 20, 2008
∗
Open water
6 4 55,525 Mar 20, 2008–Apr 6, 2009 Open water
7 9 2,665 Mar 20–Aug 28, 2008
∗
Open water
8 15 20,498 Mar 20, 2008–Apr 6, 2009 Open water
9 17 14,108 Mar 20, 2008–Apr 6, 2009 Open water
10 0 0 Jun 12–Dec 14, 2008 Open water
11 1 36 Jun 12–Dec 14, 2008 Open water
12 1 19 Jun 12–Dec 14, 2008 Open water
13 1 10 Jun 12–Dec 14, 2008 Open water
14 3 355 Jul 26, 2007–Apr 14, 2009 Marina
15 0 0 Jun 26–Dec 14, 2008 Open water
16 0 0 Jun 26–Dec 14, 2008 Open water
17 11 234 Aug 20, 2007–Dec 14, 2008 Bayside of inlet
18 1 585 Jul 10–Aug 28, 2008
∗
Open water
Total 94,250
a 1-h period were removed from analyses to minimize false
detections. If a fish was not detected on any of the VR2W re-
ceivers, including those gating the bay, there were four possible
explanations: (1) the fish entered an unmonitored region of the
bay, (2) it was consumed by a predator, (3) it was harvested
during the fishing season (April–May), or (4) it left the bay
undetected.
To determine whether a winter flounder was entering or leav-
ing the bay through Shinnecock Inlet, this site was gated by plac-
ing four VR2W receivers around the inlet: two bayside (north)
and two inside the inlet (south; Figure 1). In addition, receivers
at Shinnecock Canal and Ponquogue Bridge monitored alter-
native exits. Tracking of movements in and out of Shinnecock
Inlet was essential in identifying resident and dispersive winter
flounder. If winter flounder displayed inner bay movements for
more than 6 months, they were classified as resident individ-
uals. Those that exited in spring or summer were identified as
dispersive individuals.
Residence time.—To establish the degree of site fidelity for
winter flounder in the study area, a residency index (I
R
)was
calculated as
I
R
= N
total
/N
L
,
where N
total
is the total number of days on which a winter
flounder was detected and N
L
is the time at liberty (i.e., the
number of days between the deployment date and the date of
last detection; Topping et al. 2006; Abecasis and Erzini 2008).
Residency was also described in terms of total presence (total
number of days on which an individual was detected within
the bay) and continuous presence (number of consecutive days
for which an individual was detected; Collins et al. 2007). A
t-test assuming equal variances (α = 0.05) evaluated whether
there were significant differences in both total presence and
continuous presence between small (<300 mm TL) and large
(≥300 mm TL) individuals. Winter flounder size was regressed
against I
R
to determine whether there was a significant difference
in residency between large and small individuals. A single-
factor analysis of variance (ANOVA; α = 0.05) was used to
determine whether there were significant differences in I
R
for
winter flounder that were deployed during different seasons.
Receiver catch per unit of effort.—For each day, receiver
catch per unit of effort (CPUE) was calculated as
CPUE = R
d
/R
t
,
where R
d
is the number of receivers with detections and R
t
is
the total number of active receivers (see Table 1 for monitoring
periods). High CPUE indicated detections by many receivers,
whereas low CPUE indicated that few or no receivers detected
winter flounder. Receiver CPUE between groups based on time
of deployment was tested by use of a nonparametric Wilcoxon’s
signed rank test with a continuity correction in R software
(R Development Core Team 2010). In addition, to represent
WINTER FLOUNDER MOVEMENTS 299
TABLE 2. Summary description of acoustic-tagged winter flounder (TL = total length), including deployment date and detection at receiver (VR2W) stations
in Shinnecock Bay, Long Island, for three migration classes designated based on movement patterns (inner bay movements, dispersal to offshore, and connectivity
to other inshore areas).
Fish number Fish TL (mm) Deployment date
Last detection
date
Number of
detections Stations
Inner bay movements (mean TL = 297 mm, SE = 13)
2 351 Sep 8, 2007 May 30, 2008 11 2, 3, 7–9
3 351 Sep 8, 2007 Sep 6, 2008 2,104 7, 8, 14
8 388 Sep 25, 2007 Aug 27, 2008 734 6–9, 17
10 346 Sep 28, 2007 Apr 3, 2008 8 7
18
a
240 May 14, 2008 Jun 12, 2008 30 8, 9
23 380 May 29, 2008 Oct 2, 2008 1,175 6–8
25 280 Jun 27, 2008 Aug 13, 2008 906 8
31
a
265 Jul 9, 2008 Jul 16, 2008 102 9
32 254 Jul 9, 2008 Nov 30, 2008 836 9
33
a
254 Jul 9, 2008 Jul 10, 2008 41 9
34 271 Jul 9, 2008 Apr 27, 2009 1,322 9
35
a
255 Jul 9, 2008 Jul 16, 2008 600 7–9, 18
36
a
266 Jul 9, 2008 Jul 29, 2008 5,069 8, 9
37 280 Jul 9, 2008 Aug 16, 2008 467 9
40 271 Jul 28, 2008 Dec 9, 2008 4,633 8, 9
Total 18,038
Dispersal to offshore waters (mean TL = 318 mm, SE = 15)
9 380 Sep 28, 2007 Nov 1, 2007 34 17
14 395 Jan 10, 2008 May 7, 2008 11 3, 17
16 310 Apr 11, 2008 Apr 26, 2008 15 2, 9, 17
17 320 May 14, 2008 Apr 1, 2009 128 2, 8, 9, 17
19 250 May 14, 2008 May 28, 2008 2,004 2, 8, 9, 17
20 330 May 14, 2008 May 16, 2008 26 17
21 375 May 29, 2008 Jun 22, 2008 64 1, 6–8
24 270 Jun 27, 2008 Jun 30, 2008 36 2, 3, 17
26 260 Jun 27, 2008 Jul 1, 2008 5 17
28 290 Jun 27, 2008 Jun 29, 2008 99 2, 3, 8
30 314 Jul 9, 2008 Jul 15, 2008 46 9, 17
Total 2,468
Connectivity to other inshore areas (mean TL = 346 mm, SE = 35)
11 348 Sep 28, 2007 Feb 12, 2008 57 14
27 405 Jun 27, 2008 Oct 10, 2008 8,496 7–9, 12–14
29 285 Jun 27, 2008 Nov 15, 2008 65,191 4, 6–9, 11, 17
Total 73,744
a
Fish that exhibited short-term (<1 month) inner bay movements.
regional preferences, the core monitor for each individual was
identified as the receiver with the greatest number of detections
(Topping et al. 2006).
RESULTS
Collection, Preparation, and Tracking of Winter Flounder
In total, 40 adult winter flounder were captured and fitted
with acoustic transmitters over the duration of the project (13
fish in 2007; 27 fish in 2008). Of these, 29 were detected
during this study and their movements were classified based
on spatial and temporal patterns (Table 2). Monitoring of fish
from the first batch indicated 100% retention of transmitters
and no transmitter-related mortality. Overall, none of the winter
flounder were in spawning condition when captured. The gating
of Shinnecock Inlet took longer than expected due to environ-
mental difficulties, and as a result only two VR2W receivers
were in place at the commencement of the study (see Table 1
300 SAGARESE AND FRISK
for monitoring periods). The third VR2W unit was added at the
inlet in December 2007, and the fourth was added in June 2008.
Although Ponquogue Bridge and Shinnecock Canal were each
gated with receivers at the beginning of the study, one receiver
was removed from each site due to minimal winter flounder
detections; these two receivers were placed at stations 15 and
16 to increase coverage elsewhere. Overall, the acoustic array
received 94,250 valid detections (Table 1). Receivers performed
well in terms of code detection efficiency, and more codes were
detected in the high-density area, a relatively deep (2–4-m)
region north of the sandbar, which was characterized by beds of
eelgrass Zostera spp. interspersed with sandy patches (Figure
1). In contrast, fewer codes were detected in major boating
channels. The mean number of detections per synch was 0.395,
suggesting that 39.5% of transmitted codes were detected, a
result similar to the findings of Simpfendorfer et al. (2008).
The rejection coefficient by station ranged from 0.00 to 0.09
rejections/synch and averaged 0.02 rejections/synch.
Residency and Site Fidelity
Data on winter flounder presence within the study area indi-
cated variation in residency over the 20-month period of mon-
itoring (Figure 2). Three groups of winter flounder were rec-
ognized based on time of deployment: (1) 13 fish that were
deployed in summer–fall 2007 (fish numbers 1–13); (2) 10 fish
that were deployed in winter–spring 2008 (fish numbers 14–23);
and (3) 17 fish that were deployed in summer 2008 (fish num-
bers 24–40). Among the winter flounder from deployment group
1, six fish were detected: fish 11 left the bay via Shinnecock
Canal in February 2008, fish 9 was detected by part of the in-
let receiver gate in October 2007, and four individuals (fish 2,
3, 8, and 10) spent 1 week to 5 months in the high-density
area.
Among the individuals released in 2008, 23 fish were de-
tected (group 2: 8 fish detected; group 3: 15 fish detected).
Within group 2, fish 18 was present in the high-density area
for less than 2 months, whereas fish 23 remained in the high-
density area for 5 months. Fish 16, 17, and 19 exited the bay
through the inlet within 2 weeks of release; fish 14 and 20 were
detected on bayside receivers; and fish 21 was detected inside
the inlet. Within group 3, five individuals (fish 25, 31, 33, 36,
and 37) were present for less than 2 months in the high-density
area, whereas three individuals (fish 32, 34, and 40) remained in
this region for 3–9 months. Fish 35 traveled between the south-
eastern corner of Shinnecock Bay and the high-density area.
Fish 24, 26, and 28 exited the bay through the inlet within 2
weeks of release; and fish 30 was detected bayside. Fish 27 left
through Shinnecock Canal in October, whereas fish 29 traveled
underneath Ponquogue Bridge in November.
The I
R
values for winter flounder averaged 0.39 (SE = 0.06)
and ranged from 0.01 to 1.00 (Figure 3a). A significant negative
relationship existed between winter flounder size and I
R
(n =
29, slope =−0.03, intercept = 1.41, r
2
= 0.30, P = 0.002). In
addition, there was a significant difference in mean I
R
among the
FIGURE 2. Detections of acoustic-tagged winter flounder from three deploy-
ment groups (group 1 = summer–fall 2007, fish numbers 1–13; group 2 =
winter–spring 2008, fish numbers 14–23; group 3 = summer 2008, fish num-
bers 24–40) in Shinnecock Bay,Long Island (open rectangles = expected battery
life of transmitter; filled regions = dates of detection; dotted line = date when
the acoustic array was complete; see Table 1 for monitoring periods used at each
station).
three deployment groups (ANOVA: df = 28, P = 0.0003). Fish
that were released during summer 2008 (group 3) exhibited the
largest average I
R
(0.55; SE = 0.07; n = 15), while fish that were
released in summer–fall 2007 (group 1) displayed the smallest
average I
R
(0.07; SE = 0.03; n = 6). Total presence averaged
22.0 d (SE = 5.6) and ranged between 1 and 132 d (Figure 3b).
There was no significant difference in total presence between
small (<300 mm) and large (≥300 mm) individuals (t-test: df
= 27, P = 0.46). In addition, there was no significant difference
in mean total presence among the three deployment groups
(ANOVA: df = 28, P = 0.45). Continuous presence averaged
10.0 d (SE = 3.0) and ranged between 1 and 81 d (Figure 3c).
Continuous presence also did not differ between small and large
winter flounder (t-test: df = 27, P = 0.35) or among the three
deployment groups (ANOVA: df = 28, P = 0.19). The most
common interval for both total and continuous presence was
1–5 d.
WINTER FLOUNDER MOVEMENTS 301
FIGURE 3. Temporal distribution data for acoustically monitored winter
flounder from three deployment groups (gray bars = group 1; black bars =
group 2; white bars = group 3; see Figure 2 for group descriptions) in Shin-
necock Bay, Long Island: (a) residency index (see Methods), (b) total presence
(total number of days on which a fish was detected within the bay), and (c)
continuous presence (number of consecutive days for which a fish was detected
within the bay).
Receiver Catch per Unit of Effort
Receiver CPUE peaked at 0.018 during May 2008 (Figure
4), when 36% of receivers detected winter flounder (five of the
detected fish were released in May); CPUE remained near 0.00
between November 2008 and April 2009. Low CPUE values
were obtained for fish that were released during summer–fall
2007 (group 1); the peak CPUE for these fish (0.02) was ob-
served during late-May 2008 (Figure 4). For fish that were re-
leased in winter–spring 2008 (group 2), CPUE decreased from
April to June 2008 and then remained near 0.00 for the duration
of the study (Figure 4). The CPUE was high for winter flounder
that were deployed in summer 2008 (group 3), and the CPUE
for this group peaked in June 2008 (Figure 4). Overall, 98.5%
of the total detections were made at stations 6–9, which consti-
tuted the high-density area. For 69% of the fish, core monitors
were located in the high-density area; station 9 was the most
common core monitor. For 24% of the fish, the core monitors
were inlet receivers. Receiver CPUE differed significantly be-
tween deployment group 2 (n = 66 d; mean CPUE = 0.015) and
group 1 (n = 110 d; mean = 0.009; Wilcoxon’s signed rank test:
P = 0.002), between group 2 and group 3 (n = 189 d; mean
= 0.005; P = 2.2 × 10
−16
), and between group 1 and group 3
(P = 2.2 × 10
−16
).
Classification of Movements
Three types of winter flounder migratory patterns were ap-
parent during our study: (1) inner bay movements, (2) dispersal
to offshore waters, and (3) connectivity to other inshore areas
(Figure 5). Of the 29 tracked winter flounder, 17% spent less
than 1 month within the high-density area, 24% spent between
1 and 5 months there, and 10% were long-term inhabitants, re-
maining in the high-density area for 6–9 months. Twenty-one
percent of the fish traveled through the inlet, whereas 17% were
inconclusively assigned because they were detected at only part
of the inlet receiver gate. The remaining 10% entered adjacent
inshore waters.
DISCUSSION
In this study, adult winter flounder movement was investi-
gated and inshore residency was quantified by use of long-term
passive tracking. Adult winter flounder were documented as oc-
cupying Shinnecock Bay during all seasons, and the abundance
of monitored individuals peaked during summer. The majority
of winter flounder did not vacate inshore waters when bottom
temperatures surpassed 15
◦
C, in contrast to expectations from
the literature (McCracken 1963; Howe and Coates 1975; Phe-
lan 1992; Wuenschel et al. 2009). Eighty-nine percent of total
receiver detections occurred between May and October, when
winter flounder should have been offshore in cooler water. In
contrast, few fish were detected between October and April,
when they should have been inshore to spawn. Overall, the
monitored winter flounder in Shinnecock Bay were classified as
demonstrating three common movement patterns: (1) inner bay
movements, (2) dispersal to offshore waters, and (3) connectiv-
ity to other inshore areas. The residence and movement patterns
of at least three fish were consistent with the historical notion
of residents (Lobell 1939) because these individuals remained
in the bay long term during warm summer months and were not
detected as leaving the bay. These three winter flounder may rep-
resent the life history strategy that supported both commercial
and recreational fishing several decades ago (Lobell 1939; Poole
1969). The relative abundance and presence of winter flounder
from the summer 2008 deployment group (group 3) may be
indicative of a resident contingent or a separate population.
302 SAGARESE AND FRISK
FIGURE 4. Receiver catch per unit of effort (CPUE; defined in Methods) estimated on a daily basis for acoustic-tagged winter flounder in Shinnecock Bay,
Long Island; panels (from top to bottom) depict all deployment groups combined, group 1, group 2, and group 3 (see Figure 2 for group descriptions). Notethe
difference in scale on the ordinate.
Based on year-round tag returns, Lobell (1939) suggested the
existence of a resident population of winter flounder in Great
South Bay and other south shore bays. In our study, most winter
flounder were collected inshore between May and August, when
bottom water temperatures exceeded 15
◦
C. In contrast, ocean
surveys conducted in coastal waters of Long Island (10–30-m
depths) and areas adjacent to Shinnecock Bay indicated that the
peak abundance of adult winter flounder occurred during fall
and spring and that winter flounder were completely absent dur-
ing summer (M.G.F., unpublished data). Olla et al. (1969) found
winter flounder (150–360 mm) in Great South Bay when bottom
temperatures ranged from 17.2
◦
Cto24
◦
C. Here, we provide fur-
ther evidence that adult winter flounder are present inshore dur-
ing periods when they are expected to be offshore, although the
predominance of fish from the summer 2008 deployment group
may have biased this result. In addition, three winter flounder
in Shinnecock Bay exhibited long-term residency (>6 months)
consistent with the historical notion of resident winter flounder.
Large winter flounder displayed decreased residency compared
with small individuals, possibly as a result of the size differ-
ence between resident and dispersive individuals, which was
originally hypothesized by Lobell (1939). Our results indicate
that fish deployed in summer displayed higher residency than
those deployed in fall–winter, possibly reflecting the dispersive
behavior of fall–winter individuals. Although we detected a sig-
nificant difference in residency based on time of deployment,
our results should be interpreted cautiously because of the large
discrepancy in sample sizes.
It is clear that winter flounder are present in Shinnecock
Bay during the summer; however, it is unclear whether these
individuals represent (1) a unique behavioral contingent within
the population, (2) a genetically distinct population, or (3) a
portion of a single population wherein individuals make an-
nual decisions to disperse or remain resident. Individuals that
were classified as dispersive were probably migratory individ-
uals that consistently returned inshore to spawn. In addition,
WINTER FLOUNDER MOVEMENTS 303
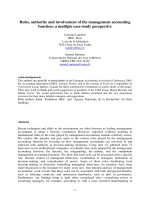
FIGURE 5. Movement patterns of six acoustic-tagged winter flounder in Shinnecock Bay, Long Island, representing examples of (a) inner bay movements (fish
numbers 8 and 3), (b) dispersal to offshore waters (fish numbers 16 and 17), and (c) connectivity to other inshore areas (fish numbers 27 and 29). Circles represent
location, stars indicate deployment date, arrows show directional tracks, and triangles represent dates of presence in region. All dates are in 2008 unless otherwise
noted. Map is based on National Oceanic and Atmospheric Administration shoreline data.
fish that exited through Shinnecock Canal or underneath Pon-
quogue Bridge may have been part of a resident group with a
wider inshore range spanning the south shore bays and perhaps
the Peconic Bays.
Although it is commonly believed that winter flounder move
offshore when inshore temperatures increase during summer
months, adult winter flounder are capable of withstanding warm
temperatures through behavioral modifications, including burial
in sediment, reduced swim speeds, and inactivity (Olla et al.
1969; He 2003). Winter flounder can escape warm bottom wa-
ters by burying up to 6 cm into the sediment, where temperatures
remain roughly 4
◦
C cooler (Olla et al. 1969). However, this be-
havior drastically reduces their detectability by telemetry. Our
ongoing field testing has indicated that transmitters buried in
sand are detectible but at a drastically reduced range, resulting
in a much smaller detection area. In addition to burying in sedi-
ment, winter flounder can reduce swim speed or become inactive
to conserve energy (Olla et al. 1969; He 2003). Although winter
flounder in Shinnecock Bay appear to tolerate warm waters, ex-
treme temperatures combined with low oxygen levels can cause
mass mortality events, as was observed in Moriches Bay, Long
Island (Nichols 1918). Previous studies identified temperatures
304 SAGARESE AND FRISK
greater than 26.5
◦
C as causing mortality of adult winter flounder
(McCracken 1963; Hoff and Westman 1966).
The lack of monitored winter flounder in the high-density
area from November to April (with the exception of one indi-
vidual) was noteworthy because this period is believed to be
the time of spawning. This result indicates that spawning prob-
ably does not occur within the high-density area even though it
contains eelgrass habitat that is considered suitable for winter
flounder young of the year. Many factors may be responsible for
this sudden absence of winter flounder, such as emigration to an
unmonitored region of the bay, predatory events, or other sources
of mortality. One possible explanation may include the in-
creased presence of harbor seals Phoca vitulina, gray seals Hali-
choerus grypus, and harp seals Pagophilus groenlandica in the
bay—particularly in the high-density area—between November
and May (USFWS 1997). Thus, appearance of these seasonal
predators may be placing additional pressure on winter flounder
numbers through predation. Although seals feed heavily on ga-
dids and flatfishes (Hark
¨
onen 1987; Bowen and Harrison 1994;
Hall et al. 1998; Berg et al. 2002), the low abundance of ga-
dids in Shinnecock Bay (M.G.F., unpublished data) may cause
a shift in predatory pressure toward flatfishes. Historically, win-
ter flounder were abundant in Shinnecock Bay and may have
provided a substantial food source for visiting seals.
The stochastic behavior of animals and the unpredictable na-
ture of the environment make telemetry studies susceptible to
uncertainty. The ability of flatfish to bury themselves may re-
duce the probability of detection and, when coupled with poor
environmental conditions, could influence residency estimates.
In an attempt to eliminate this source of uncertainty, we quanti-
fied residency by daily intervals rather than by hourly intervals
so that the frequency of detections (depending on distance from
receiver or burial behavior) would not influence residence es-
timates. We also tried to improve the probability of detection
in year 2 by introducing transmitters with a greater transmis-
sion frequency. Although our collection efforts were designed to
capture members of both contingents, temporal and spatial vari-
ation in spawning may have reduced the probability of capturing
dispersive winter flounder.
The performance of inlet receivers during the study was de-
pendent on hydrographic conditions, boat traffic, and biological
activity and remains a source of uncertainty. Background noise
and sea-state conditions may have prevented detection of com-
plete transmissions or may have reduced the frequency of detec-
tions. In addition, incomplete gating at the initiation of this study
may have masked the occurrence of dispersive winter flounder
from deployment group 1 because this was the only group that
was exposed to an incomplete gate. Although receiver CPUE
differed significantly between groups, this difference may be at-
tributable to different sample sizes. In addition, winter flounder
from group 1 were tracked by fewer receivers. In an attempt to
improve detection for year 2, we used transmitters that emitted
pulses more frequently. To avoid bias resulting from the use of
transmitters with different transmission frequencies, the CPUE
was estimated on a daily basis and standardized for the number
of available transmissions. However, no noticeable differences
in estimated CPUE values or trends were observed when ad-
justed for transmission frequency, and this standardization was
not used in the final estimates. Our data interpretation should be
considered an underestimation of winter flounder movements
because of the many uncertainties inherent in telemetry stud-
ies, including receiver performance, incomplete detections, and
animal behavior.
Management Implications
Winter flounder movements in Shinnecock Bay deviated
from the expected behavior for this species south of Cape Cod
in terms of inshore residency and response to the seasonal en-
vironment. This study provides supporting evidence that winter
flounder in Long Island bays exhibit a complex stock struc-
ture that warrants further investigation to identify biological
traits exhibited by resident and dispersive groups (e.g., genetic
differences, morphometrics, and spawning connectivity). Com-
plex stock structure may be more common in winter flounder
than previously thought: recent research indicates that young
of the year in Narragansett Bay, Rhode Island, represent up to
16 distinct genetic populations (Buckley et al. 2008). Research
is necessary to determine whether winter flounder display par-
tial migration (i.e., resident and dispersive individuals within a
single population) or whether these contingents are instead ge-
netically distinct populations. Resolving the stock structure and
migratory behavior of Long Island winter flounder is crucial to
determine the impacts of local harvest on the sustainability of the
species. If resident winter flounder represent a separate genetic
population, the seasonally more abundant dispersive population
may mask a long-term decline in resident winter flounder that
once supported Long Island fisheries (Lobell 1939) and may
eventually lead to extirpation of residents. This outcome would
require management of each population separately based on
population-specific life history variables. On the other hand, if
resident and dispersive winter flounder are contingents within
a single genetically distinct population that exhibit partial mi-
gration, the relative impact of harvest on resident and dispersive
individuals can be complex (Gross 1991; Kerr et al. 2009). Man-
agement would need to consider the relative abundance of each
contingent through habitat or other conservation efforts aimed
at a specific contingent (Kerr et al. 2010). Under this scenario,
even if all resident individuals are eliminated by fishing, this
contingent could be re-established from the population. Move-
ment patterns and residency of winter flounder are paramount
for describing stock structure of this species in Long Island bays.
Our results provide insight into winter flounder movements in
a coastal bay of Long Island, which may help to identify poten-
tial reasons for a general decline in winter flounder; however,
much work remains to fully understand the stock structure of
this species.
WINTER FLOUNDER MOVEMENTS 305
ACKNOWLEDGMENTS
We thank M. Yencho, M. Nuttall, C. Martinez, C. Hall, J.
Zacharias, M. Wiggins, D. Bowman, D. Getz, R. McIntyre,
B. Gagliardi, and many others for assisting with field work.
We thank R. Cerrato and A. Jordaan for comments on earlier
drafts of this manuscript. This project was made possible by
assistance from Sea Scorpion Dive Services, B. Pfeiffer of Island
Diving, and many other volunteer divers. Wethank the New York
State Department of Environmental Conservation for funding
this project.
REFERENCES
Abecasis, D., and K. Erzini. 2008. Site fidelity and movements of gilthead sea
bream (Sparus aurata) in a coastal lagoon (Ria Formosa, Portugal). Estuarine
Coastal and Shelf Science 79:758–763.
ASMFC (Atlantic States Marine Fisheries Commission). 2006. Species profile:
winter flounder current plan seeks to rebuild southern New England/Mid-
Atlantic stock and sustain Gulf of Maine stock. Atlantic States Marine Fish-
eries Service Fisheries Focus 15:4–6.
ASMFC (Atlantic States Marine Fisheries Commission). 2009. Draft addendum
I to amendment 1 to the interstate fishery management plan for inshore stocks
of winter flounder for public comment. ASMFC, Washington, D.C.
Berg, I., T. Haug, and K. T. Nilssen. 2002. Harbour seal (Phoca vitulina) diet in
Vester
˚
alen, north Norway. Sarsia 87:451–461.
Bowen, W. D., and G. D. Harrison. 1994. Offshore diet of grey seals Halichoerus
grypus near Sable Island, Canada. Marine Ecology Progress Series 112:1–11.
Brown, R. W., and W. L. Gabriel. 1998. Winter flounder. NOAA Technical
Memorandum NMFS-NE-115:81–84.
Buckley, L., J. Collie, L. A. E. Kaplan, and J. Crivello. 2008. Winter floun-
der larval genetic population structure in Narragansett Bay, Rhode Island:
recruitment to juvenile young-of-the-year. Estuaries and Coasts 31:745–754.
Buonaiuto, F. S. Jr., and H. J. Bokuniewicz. 2008. Hydrodynamic partitioning
of a mixed energy tidal inlet. Journal of Coastal Research 24:1339–1348.
Collins, A. B., M. R. Heupel, and P. J. Motta. 2007. Residence and movement
patterns of cownose rays Rhinoptera bonasus within a south-west Florida
estuary. Journal of Fish Biology 71:1159–1178.
Dingle, H. 1996. Migration: the biology of life on the move. Oxford University
Press, New York.
Green, B. S., and R. C. Chambers. 2007. Maternal effects vary between source
populations in the Atlantic tomcod Microgadus tomcod. Marine Ecology
Progress Series 334:185–195.
Gross, M. R. 1991. Salmon breeding behavior and life history evolution in
changing environments. Ecology 72:1180–1186.
Hall, A. J., J. Watkins, and P. S. Hammond. 1998. Seasonal variation in the diet
of harbour seals in the south-western North Sea. Marine Ecology Progress
Series 170:269–281.
Hark
¨
onen, T. J. 1987. Seasonal and regional variations in the feeding habits of
the harbour seal, Phoca vitulina, in the Skagerrak and the Kattegat. Journal
of Zoology (London) 213:535–543.
He, P. 2003. Swimming behavior of winter flounder (Pleuronectes americanus)
on natural fishing grounds as observed by an underwater video camera. Fish-
eries Research 60:507–514.
Hilborn, R., T. P. Quinn, D. E. Schindler, and D. E. Rogers. 2003. Biocomplexity
and fisheries sustainability. Proceedings of the National Academy of Sciences
of the USA 100:6564–6568.
Hjort, J. 1914. Fluctuations in the great fisheries of northern Europe viewed in
the light of biological research. Rapports et Proc
`
es-Verbaux des R
´
eunions du
Conseil Permanent International pour l’Exploration de la Mer 20:1–228.
Hoff, J. G., and J. R. Westman. 1966. Temperature tolerance of three species of
marine fishes. Journal of Marine Research 24:131–140.
Howe, A. B., and P. G. Coates. 1975. Winter flounder movements, growth, and
mortality off Massachusetts. Transactions of the American Fisheries Society
1:13–29.
Howe, A. B., P. G. Coates, and D. E. Pierce. 1976. Winter flounder estuarine year-
class abundance, mortality, and recruitment. Transactions of the American
Fisheries Society 105:647–657.
Kerr, L. A., S. X. Cadrin, and D. H. Secor. 2010. The role of spatial dynamics
in the stability, resilience, and productivity of an estuarine fish population.
Ecological Applications 20:497–507.
Kerr, L. A., D. H. Secor, and P. M. Piccoli. 2009. Partial migration of fishes
as exemplified by the estuarine-dependent white perch. Fisheries 34:114–
123.
Klein-MacPhee, G. 2002. Righteye flounders: family Pleuronectidae. Pages
560–587 in B. B. Collette and G. Klein-MacPhee, editors. Bigelow and
Schroeder’s fishes of the Gulf of Maine, 3rd edition. Smithsonian Institution
Press, Washington, D.C.
Lobell, M. J. 1939. A biological survey of the salt waters of Long Island, 1938.
Report on certain fishes. Winter flounder (Pseudopleuronectes americanus).
Pages 63–96 in Supplement to the 28th annual report, part 1. New York State
Conservation Department, Albany.
Lundberg, P. 1988. The evolution of partial migration in birds. Trends in Ecology
and Evolution 3:172–175.
Manderson, J. P. 2008. The spatial scale of phase synchrony in winter flounder
(Pseudopleuronectes americanus) production increased among southern New
England nurseries in the 1990s. Canadian Journal of Fisheries and Aquatic
Sciences 65:340–351.
McCracken, F. D. 1963. Seasonal movements of the winter flounder, Pseu-
dopleuronectes americanus, on the Atlantic Coast. Journal of the Fisheries
Research Board of Canada 20:551–586.
Nichols, J. T. 1918. An abnormal winter flounder and others. Copeia 55:37–39.
NMFS (National Marine Fisheries Service). 2007. Annual commer-
cial landing statistics. NOAA Fisheries, Office of Science and Tech-
nology, Fisheries Statistics and Economics, Washington, D.C. Avail-
able: www.st.nmfs.noaa.gov/st1/commercial/landings/annual
landings.html.
(September 2010).
Olla, B. L., R. Wicklund, and S. Wilk. 1969. Behavior of winter flounder in
a natural habitat. Transactions of the American Fisheries Society 98:717–
720.
Pereira, J. J., R. Goldberg, J. J. Ziskowski, P. L. Berrien, W. W. Morse, and
D. L. Johnson. 1999. Essential fish habitat source document: winter floun-
der, Pseudopleuronectes americanus, life history and habitat characteristics.
NOAA Technical Memorandum NMFS-NE-138.
Perlmutter, A. 1947. The blackback flounder and its fishery in New England
and New York. Bulletin of the Bingham Oceanographic Collection Yale
University 11:1–101.
Phelan, B. A. 1992. Winter flounder movements in the inner New York Bight.
Transactions of the American Fisheries Society 121:777–784.
Poole, J. C. 1966. Growth and age of winter flounder in four bays of Long
Island. New York Fish and Game Journal 13:206–220.
Poole, J. C. 1969. A study of winter flounder mortality rates in Great South Bay,
New York. Transactions of the American Fisheries Society 98:611–616.
Roessig, J. M., C. M. Woodley, J. J. Cech Jr., and L. J. Hansen. 2004. Effects of
global climate change on marine and estuarine fishes and fisheries. Reviews
in Fish Biology and Fisheries 14:251–275.
Roman, C. T., N. Jaworski, F. T. Short, S. Findlay, and R. S. Warren. 2000.
Estuaries of the Northeastern United States: habitat and land use signatures.
Estuaries 23:743–764.
R Development Core Team. 2010. R: a language and environment for statisti-
cal computing. R Foundation for Statistical Computing, Vienna. Available:
www.R-project.org. (July 2010).
Saila, S. B. 1961. A study of winter flounder movements. Limnology and
Oceanography 6:292–298.
Saucerman, S. E., and L. A. Deegan. 1991. Lateral and cross-channel movement
of young-of-the-year winter flounder (Pseudopleuronectes americanus)in
Waquoit Bay, Massachusetts. Estuaries 14:440–446.
Secor, D. H. 1999. Specifying divergent migrations in the concept of stock: the
contingent hypothesis. Fisheries Research 43:13–34.
Secor, D. H. 2007. The year-class phenomenon and the storage effect in marine
fishes. Journal of Sea Research 57:91–103.
306 SAGARESE AND FRISK
Simpfendorfer, C. A., M. R. Heupel, and A. B. Collins. 2008. Variation in
the performance of acoustic receivers and its implication for positioning
algorithms in a marine setting. Canadian Journal of Fisheries and Aquatic
Sciences 65:482–492.
Taylor, D. L., and D. J. Danila. 2005. Predation on winter flounder (Pseu-
dopleuronectes americanus) eggs by the sand shrimp (Crangon septem-
spinosa). Canadian Journal of Fisheries and Aquatic Sciences 62:1611–
1625.
Topping, D. T., C. G. Lowe, and J. E. Casselle. 2006. Site fidelity and seasonal
movement patterns of adult California sheephead Semicossyphus pulcher
(Labridae): an acoustic monitoring study. Marine Ecology Progress Series
326:257–267.
USFWS (U.S. Fish and Wildlife Service). 1997. Shinnecock Bay complex
12. In Significant habitats and habitat complexes of the New York Bight
Watershed. USFWS, Southern New England–New York Bight Coastal
Ecosystems Program, Final Report, Charlestown, Rhode Island. Available:
library.fws.gov/pubs5/web
link/text/sb form.htm. (August 2009).
Van Guelpen, L., and C. C. Davis. 1979. Seasonal movements of the winter floun-
der, Pseudopleuronectes americanus, in two contrasting inshore locations in
Newfoundland. Transactions of the American Fisheries Society 108:26–37.
Wuenschel, M. J., K. W. Able, and D. Byrne. 2009. Seasonal patterns of winter
flounder Pseudopleuronectes americanus abundance and reproductive con-
dition on the New York Bight continental shelf. Journal of Fish Biology
74:1508–1524.
Yencho, M. A. 2009. Abundance, mortality, age and growth of young-of-the-
year winter flounder (Pseudopleuronectes americanus) in two locations on
Long Island. Master’s thesis. Stony Brook University, Stony Brook, New
Yo rk .